Massive $800K SPY Bear Put Spread - Institutional Hedge Targets 5% S&P 500 Pullback!
January 29, 2026 | Unusual Activity Detected
The Quick Take
A major institutional player just put on a $800K bear put spread on SPY at 12:42:14 today, buying 20,000 contracts of the $658/$653 put spread expiring February 20th. This is a defined-risk bearish bet targeting a ~5% decline in the S&P 500 from current levels near $691. With a max payout of $10 MILLION on just $800K of risk (12.5:1 reward-to-risk), this looks like a high-conviction portfolio hedge as mega-cap earnings, tariff uncertainty, and Microsoft's -12% plunge create a fragile market environment. Translation: Smart money is buying cheap insurance against a February correction while the S&P 500 flirts with 7,000.
ETF Overview
SPDR S&P 500 ETF Trust (SPY) is the largest and most traded ETF in the world, tracking the S&P 500 index of 500 large-cap US stocks:
- AUM: $714.34 Billion
- Expense Ratio: 0.09%
- Current Price: $690.91 (at time of trade)
- 52-Week Range: $481.80 - $696.09
- Top Sectors: Technology (34.77%), Financial Services (12.44%), Communication Services (10.91%)
- Forward P/E: 22.2x | TTM P/E: 28.51x
- Dividend Yield: 1.1%
The Option Flow Breakdown
The Tape (January 29, 2026 @ 12:42:14) - TWO-LEG SPREAD:
| Time | Symbol | Side | Buy/Sell | Type | Expiration | Premium | Strike | Volume | OI | Size | Spot | Option Price |
|---|---|---|---|---|---|---|---|---|---|---|---|---|
| 12:42:14 | SPY | ASK | BUY | PUT $658 | 2026-02-20 | $4.9M | $658 | 61,000 | 19,000 | 20,000 | $690.91 | $2.44 |
| 12:42:14 | SPY | MID | SELL | PUT $653 | 2026-02-20 | $4.1M | $653 | 63,000 | 19,000 | 20,000 | $690.91 | $2.03 |
What This Actually Means
This is a bear put spread -- a defined-risk, directional bearish strategy. Here is the full breakdown:
- Strategy: Buy the $658 put (long leg) and sell the $653 put (short leg) for a $0.41 net debit per share ($2.44 - $2.03)
- Total net debit: ~$800K ($0.41 x 20,000 contracts x 100 shares)
- Max profit: $5.00 spread width - $0.41 debit = $4.59 per share x 20,000 contracts = $9.18 MILLION (if SPY closes below $653 at expiration)
- Max loss: $800K (the premium paid -- defined and capped)
- Breakeven: $657.59 (upper strike minus debit) -- SPY needs to drop only 4.8% from $690.91
- Risk/Reward: 12.5 to 1 -- for every $1 risked, the potential payoff is $12.50
- Notional exposure: 20,000 contracts = 2 million shares = ~$1.38 BILLION of SPY notional
What is really happening here: This trader is constructing a relatively cheap bearish hedge using a put spread rather than outright puts. The long $658 put was bought aggressively at the ask ($2.44), while the short $653 put was sold at mid ($2.03), reducing the net cost. Both strikes are approximately 5% out-of-the-money, sitting near the lower end of the monthly implied move range ($675.79). This is textbook institutional hedging: pay a small premium for outsized protection against a tail event. The 20,000-contract size on SPY -- representing $1.38B in notional -- signals a large fund protecting a broad equity portfolio into a volatile February.
Unusual Score: EXTREME -- 20,000-contract clip on a two-leg spread executed simultaneously is a hallmark of institutional or hedge fund activity. Retail traders do not execute 20,000-lot spreads at the midpoint. The volume of 61,000-63,000 on these strikes (vs. 19,000 open interest) confirms this was a fresh, opening position.
Technical Setup / Chart Check-Up
One Calendar Year Chart
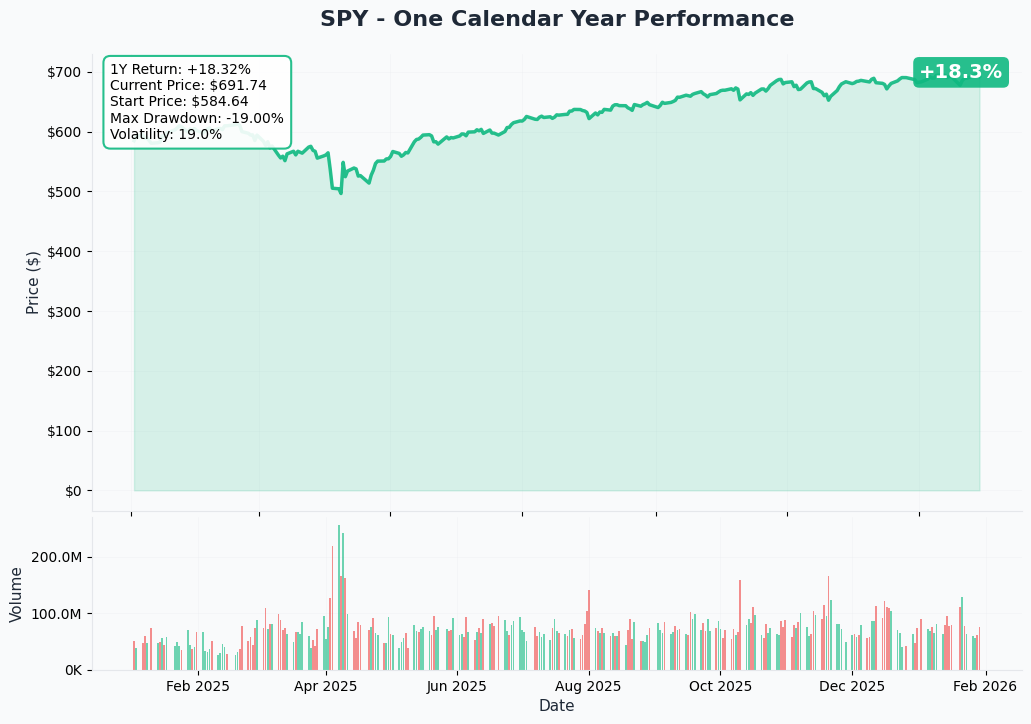
SPY is up +18.3% YTD (based on the full trailing year), with the S&P 500 hitting a fresh all-time high of 6,980.75 on January 27, 2026 -- just two days ago. The index is approaching the psychologically significant 7,000 level, a milestone that has attracted significant attention from both bulls and bears.
Key observations:
- All-time high territory: SPY tagged $696.09 on January 27 before pulling back
- Trailing year strength: The S&P 500 has delivered strong double-digit returns driven by AI capex spending and earnings growth
- Microsoft shock: Today's session is pressured by Microsoft's -12% plunge (its worst day since March 2020) after cloud growth decelerated
- Breadth question: The rally has been heavily concentrated in mega-cap tech (Technology is 34.77% of SPY), creating vulnerability if the "Magnificent 7" stumble
- Volume pickup: Elevated options volume across SPY and index products today reflects hedging activity post-MSFT selloff
Gamma-Based Support & Resistance Analysis
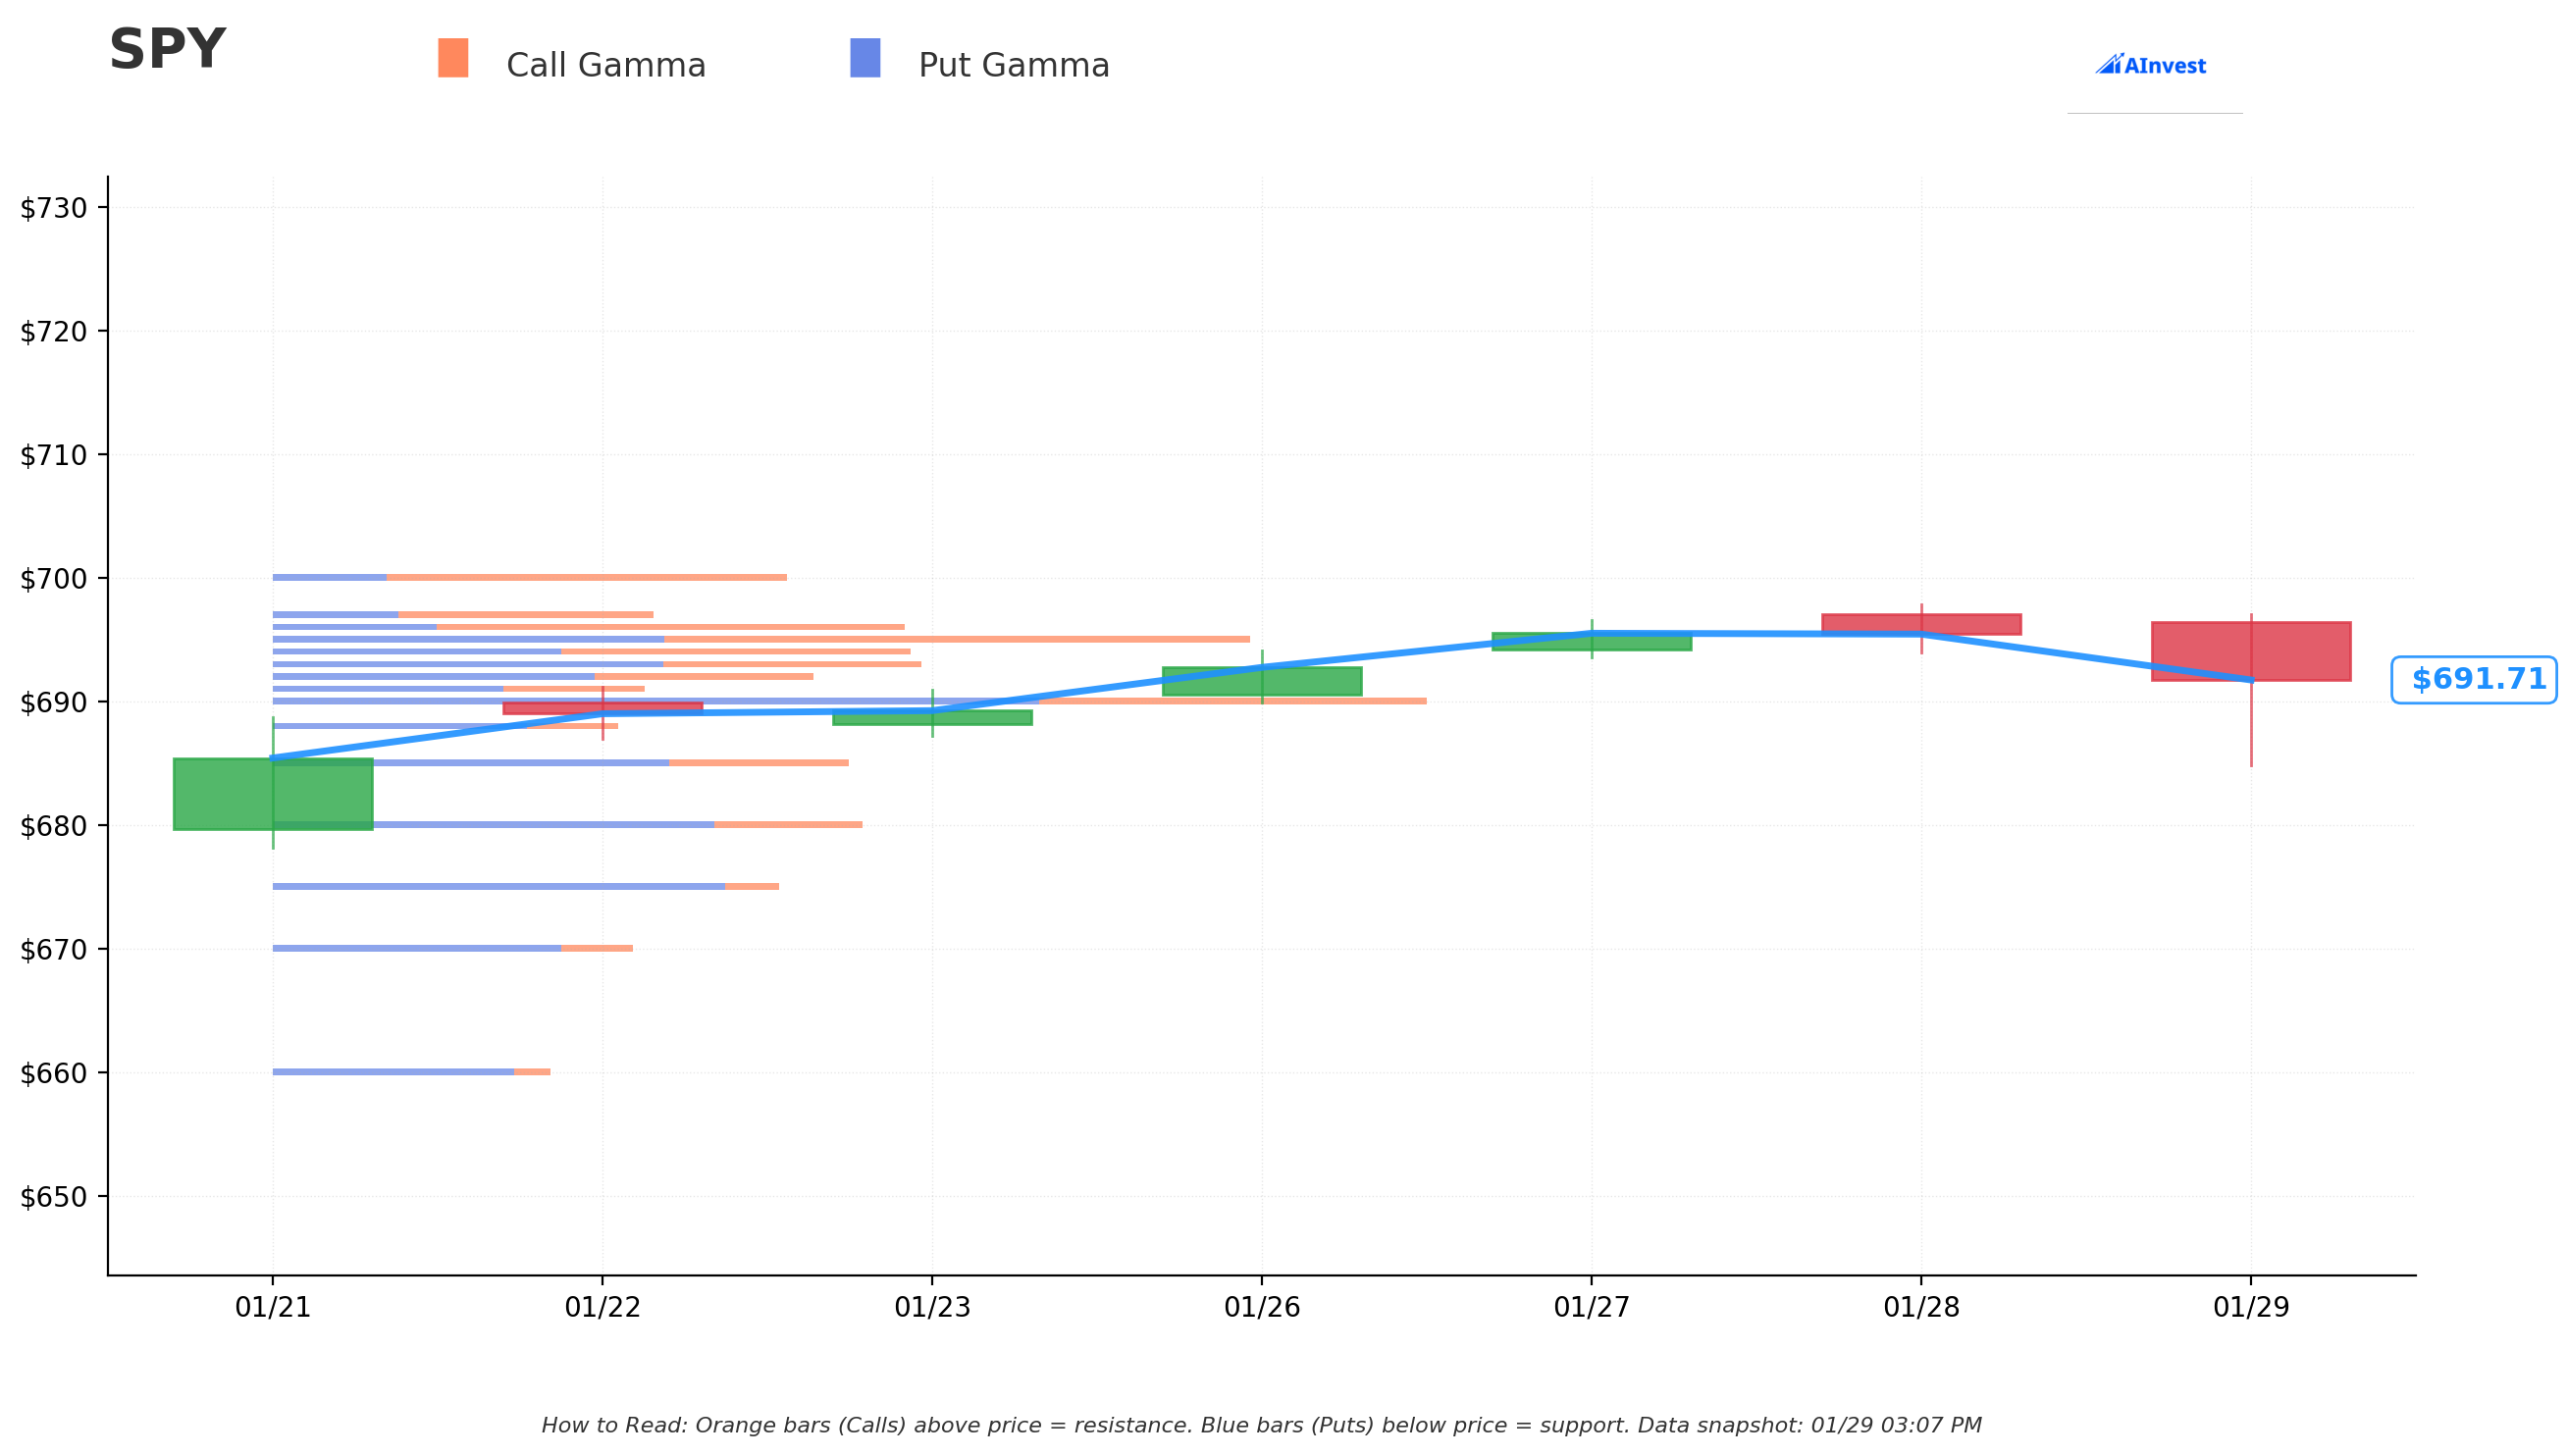
Current Price: $691.85
The gamma exposure map reveals the key levels where market maker hedging flows will create mechanical support and resistance:
Support Levels (Put Gamma Below Price):
- $690 - Immediate support (round number, first gamma floor)
- $685 - Secondary support with meaningful put gamma concentration
- $680 - Structural floor with heavy put open interest
- $675 - Major support zone, aligns with monthly implied move lower bound ($675.79)
Resistance Levels (Call Gamma Above Price):
- $692 - Immediate overhead resistance
- $693-$694 - Call gamma cluster creating selling pressure into rallies
- $695 - Strong resistance near the all-time high ($696.09)
- $696 - All-time high level, massive psychological barrier
- $700 - Major round-number resistance and gamma wall
What this means for traders: SPY is trading in a zone where call gamma dominates overhead between $692-$700, meaning market makers will sell into rallies to hedge. The $700 round number and all-time high at $696 create a dense resistance zone. Below, $685-$690 provides first support, but a break through $680 could accelerate selling toward $675. The put spread buyer's strikes at $658/$653 are well below the immediate gamma support levels -- they are betting on a scenario where support FAILS and momentum carries the index lower.
Notice the alignment: The $658 strike sits roughly 5% below current price, which is beyond the typical gamma-supported range. This trader is positioning for a break of the entire support structure -- not a garden-variety 2-3% pullback, but a genuine 5%+ correction.
Net GEX Bias: Bearish -- consistent with the broader hedging activity and the institutional put spread flow.
Implied Move Analysis
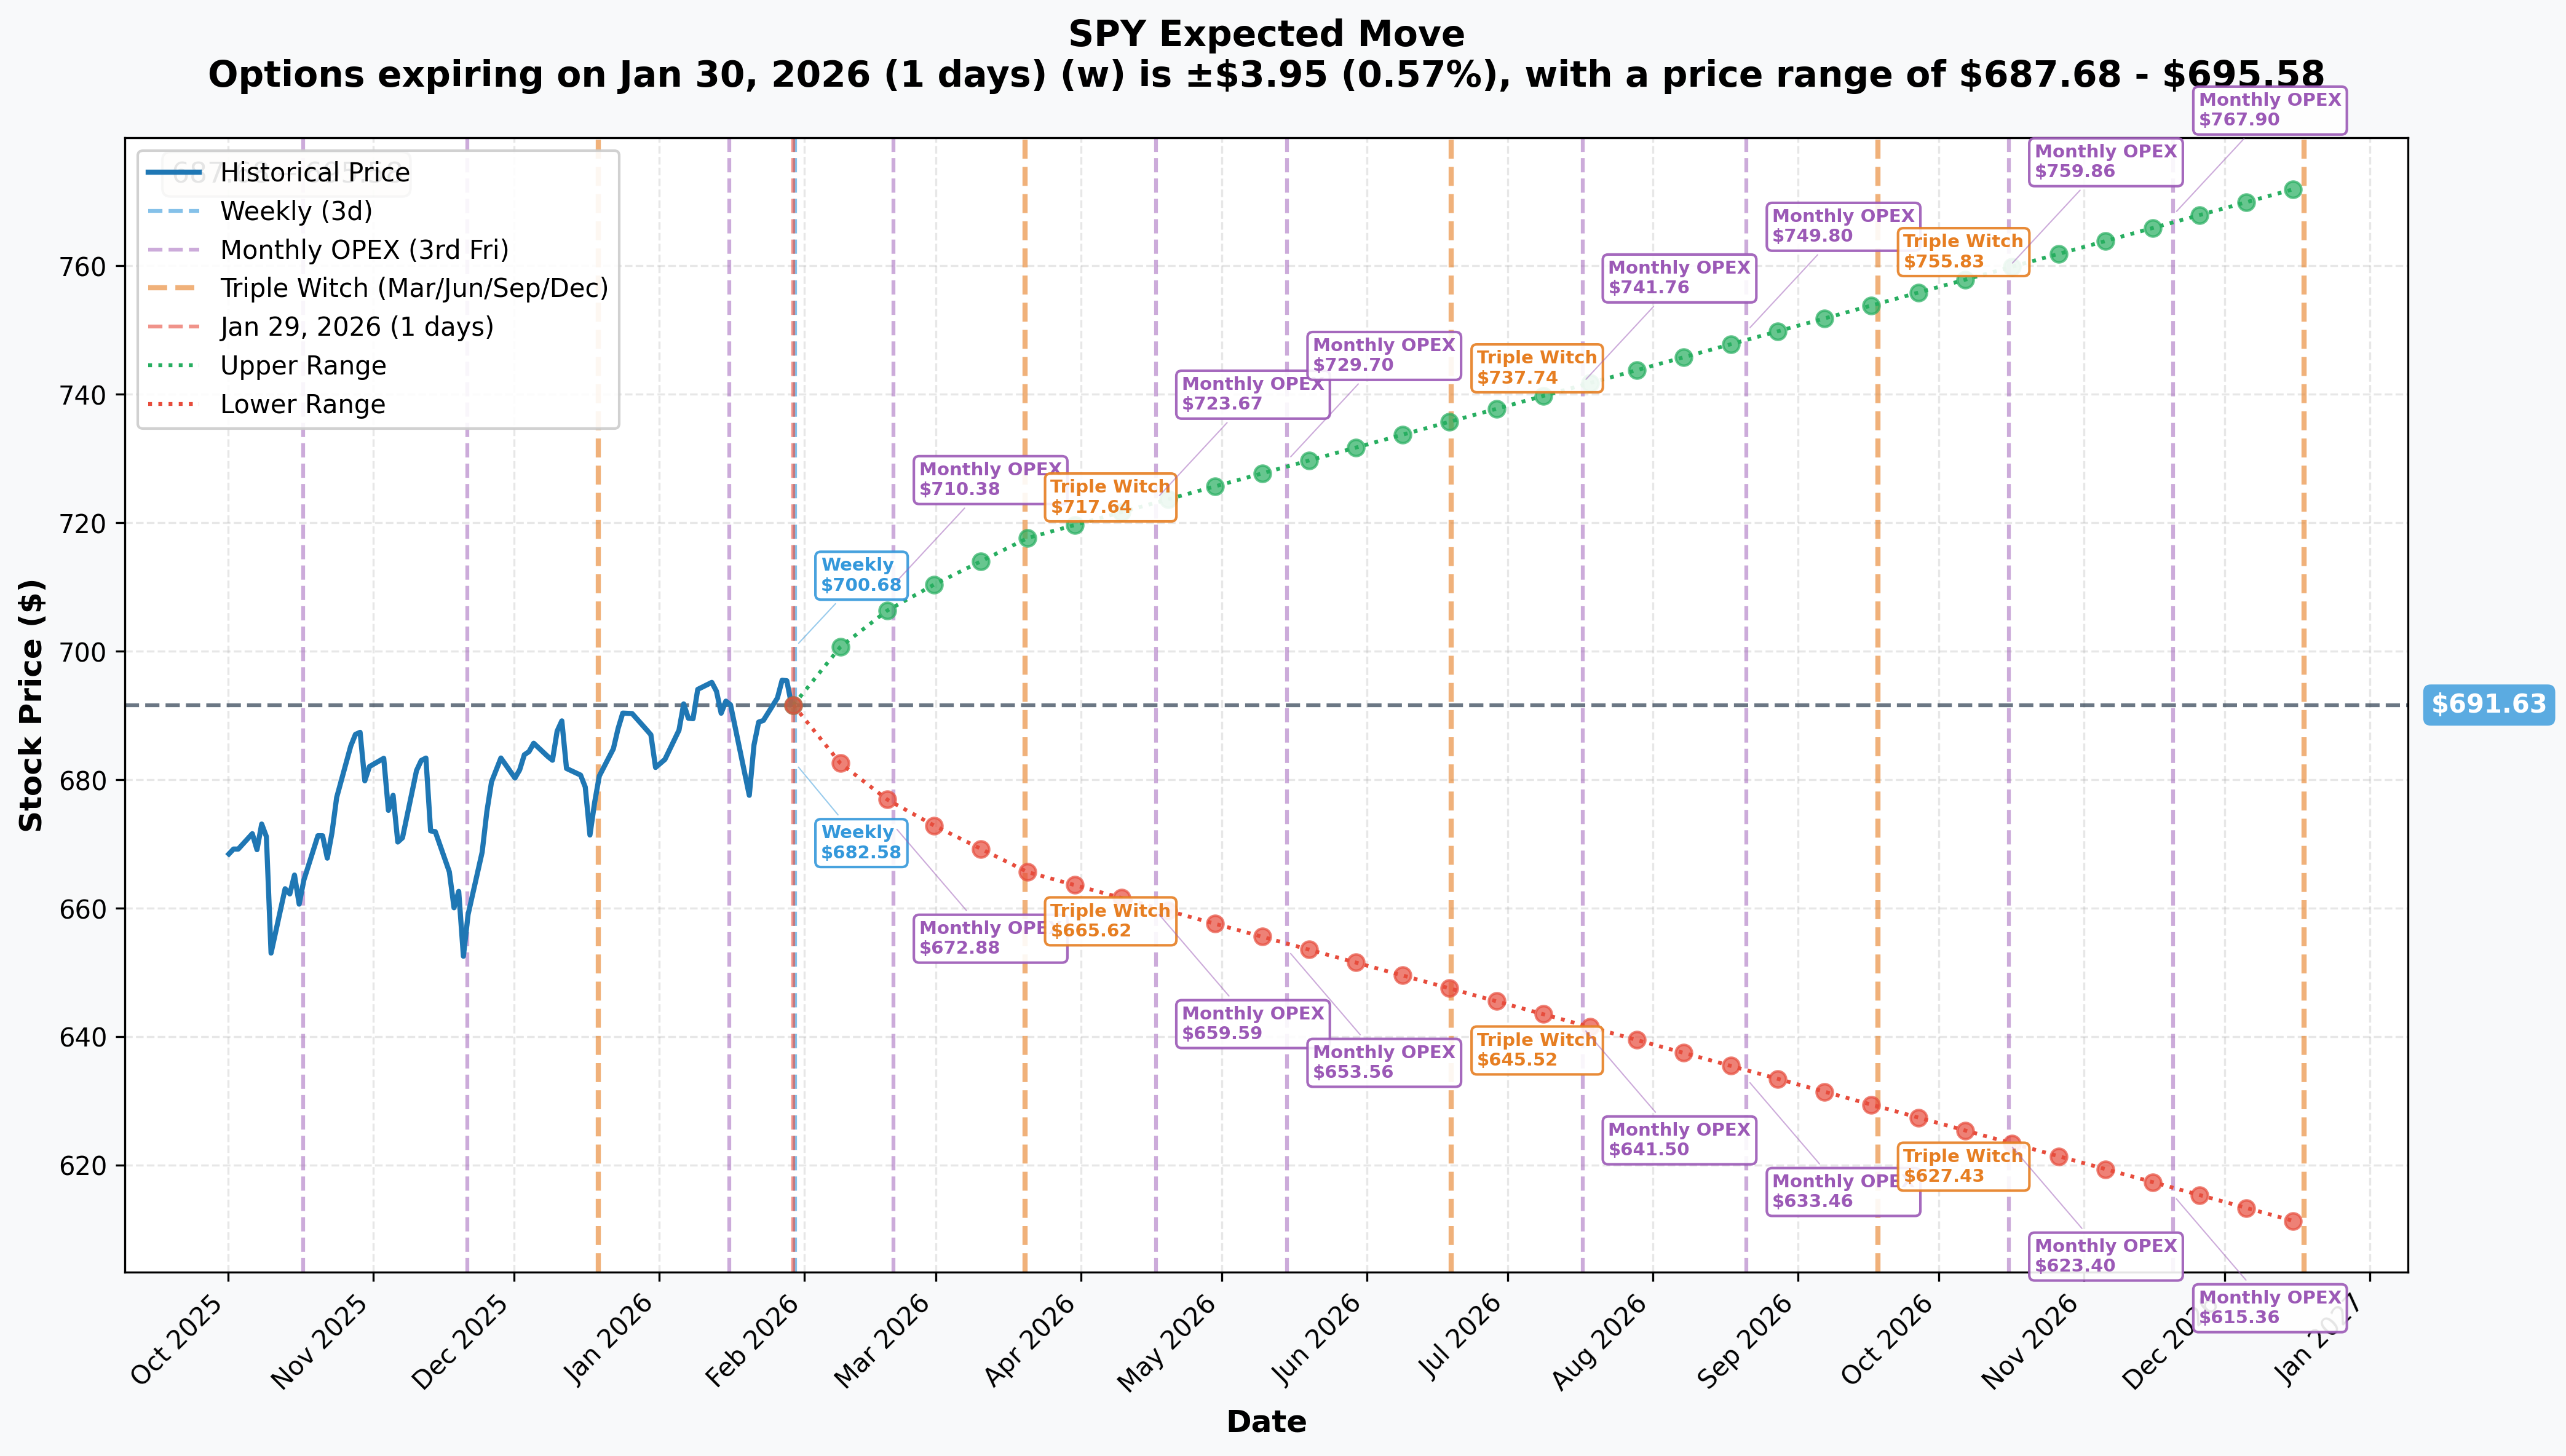
Options market pricing for upcoming expirations:
- Weekly (Jan 30 - 1 day): +/-$3.95 (+/-0.57%) -- Range: $687.68 - $695.58
- Monthly OPEX (Feb 20 - 22 days - THIS TRADE!): +/-$15.84 (+/-2.29%) -- Range: $675.79 - $707.47
- Quarterly (Mar 20 - 50 days): +/-$26.01 (+/-3.76%) -- Range: $665.62 - $717.64
Translation for regular folks: The options market expects SPY to stay within a roughly $32 range ($675-$707) by February 20th. That is a +/-2.29% move, which is typical for the broad market over a 3-week window. The put spread's upper strike at $658 is below the implied move's lower bound of $675.79 -- meaning the options market assigns a relatively low probability to SPY reaching the trade's profit zone.
However, that is precisely what makes this trade interesting. The trader is paying just $800K for a lottery ticket worth up to $10M. They are not betting this WILL happen -- they are betting the cost of insurance is cheap relative to the potential payout. With Microsoft down 12%, tariff uncertainty, and no Fed rate cuts until June, the tail risk of a 5%+ correction in the next 22 days is arguably underpriced by the market.
Key insight: The implied move for February OPEX (+/-2.29%) is relatively compressed, reflecting the low-volatility regime of the past several months. But compressed vol can snap -- and when SPY moves, it moves fast. A 5% correction from $691 would take SPY to $656, right into the sweet spot of this spread.
Catalysts
Immediate Catalysts (Next 7 Days)
Microsoft -12% Crash -- January 29, 2026 (TODAY!)
Microsoft's worst day since March 2020 is sending shockwaves through the market. Azure cloud growth decelerated, raising questions about whether the AI capex supercycle is translating into revenue growth. As the 3rd largest holding in SPY, MSFT's -12% move alone shaves roughly 70-80 basis points off the index:
- Cloud growth slowdown raises questions about enterprise AI spending ROI
- SPY has 34.77% in Technology -- a sustained tech selloff would drag the entire index
- Contagion risk to other cloud/AI names (AMZN, GOOGL, ORCL)
- Potential catalyst for institutional rebalancing away from mega-cap tech
Apple (AAPL) Q4 Earnings -- January 29, 2026 (AFTER CLOSE TODAY)
Apple reports Q4 earnings tonight as the 2nd largest holding in SPY (~6.39% weight). After Microsoft's ugly reaction, the bar for Apple is high:
- Whispers of strong iPhone demand in Asia provide some optimism
- Any disappointment would compound the Microsoft-driven tech selloff
- Services revenue growth trajectory critical for multiple expansion narrative
- If Apple also misses, the "Magnificent 7" narrative takes a serious hit
Federal Reserve Held Rates Steady -- January 28, 2026 (YESTERDAY)
The FOMC voted to hold rates at 3.50%-3.75%, pausing after three consecutive 25bp cuts in late 2025. Two dissents (Miran and Waller favored another cut). Key implications:
- No rate cuts expected until at least June 2026 -- the "Fed put" is on hold
- Chair Powell called the economy on "firm footing" but acknowledged tariff-related inflation could peak mid-2026
- Futures markets price at most two rate reductions in all of 2026
- Without the tailwind of rate cuts, markets must rely entirely on earnings growth
Near-Term Catalysts (Before Feb 20 Expiration)
Mega-Cap Earnings Gauntlet (Feb 4-25)
The remaining mega-cap earnings reports will define SPY's direction into this trade's expiration:
- Amazon (AMZN) + Alphabet (GOOGL): Report early February -- combined ~7.2% of SPY weight. AWS and Google Cloud growth rates will be compared directly against Microsoft's disappointing Azure numbers
- NVIDIA (NVDA) Q4 FY2026 earnings: Reports February 25 -- 7.66% of SPY weight (largest holding). This reports AFTER the put spread expires, but pre-earnings positioning and guidance whispers could impact SPY beforehand
- Meta (META) results: Already reported -- $8.88 EPS vs $8.23 est, +10% after-hours. Also announced $115-135B 2026 capex guidance, nearly doubling 2025 spending. This is bullish for AI infrastructure but raises ROI concerns
Q4 2025 Earnings Season Scorecard
As of January 23, 13% of S&P 500 companies have reported Q4 2025 results:
- Blended YoY earnings growth: 8.2% (10th consecutive quarter of growth)
- Beat rate: 75% beating EPS estimates -- BELOW the 5-year average of 78%
- This is the weakest beat rate in years, suggesting corporate guidance is getting more cautious
Semiconductor Tariffs -- Ongoing Uncertainty
President Trump imposed 25% tariffs on advanced AI semiconductors (NVIDIA H200, AMD MI325X) on January 15, 2026. While exemptions exist for U.S. data centers, the broader implications are significant:
- U.S.-Taiwan deal secured $250B in chip investment commitments with tariffs capped at 15%
- 90-day negotiation deadline (mid-April) -- broader semiconductor tariffs possible
- U.S.-South Korea tariff tensions (15% to 25% increase threatened) add supply chain uncertainty
- Any escalation would hit Technology (34.77% of SPY) disproportionately
Longer-Term Catalysts (2026)
Fed Chair Transition -- May 2026
Jerome Powell's term expires May 15, 2026. Treasury Secretary Bessent indicated a nomination could come within days. Historically, "the market struggles in the first six months of a new Fed Chair, with an average correction of about 15%." This is a major structural risk for the second half of 2026.
S&P 500 Earnings Growth Trajectory
FactSet estimates for 2026:
- Q1 2026: +12.2% YoY
- Q2 2026: +14.6% YoY
- Full Year 2026: +14.9% YoY
These estimates need to HOLD for current valuations to be justified. Any downward revisions would pressure the index.
Price Targets & Probabilities
Using gamma levels, implied move data, and upcoming catalysts, here are the scenarios through the February 20th expiration:
Bull Case (30% probability)
Target: $700-$710
How we get there:
- Apple beats earnings tonight and rallies 3-5%, offsetting the Microsoft drag
- Amazon and Alphabet deliver strong cloud growth in early February, restoring AI confidence
- Tariff fears ease with conciliatory comments from trade negotiators
- Market breaks through $696 all-time high and pushes to $700+ on momentum
- Earnings season beat rate improves from 75% as more companies report
- Buyback season ramps up with blackout windows ending
Why 30% probability: Despite near-term headwinds, the S&P 500 has consistently bought dips throughout this cycle. The $700 round number is a powerful magnet, and institutional flows typically support the index near all-time highs. Meta's strong earnings and massive capex announcement provide an AI tailwind.
Put spread P&L: Total loss of $800K (both puts expire worthless well out-of-the-money)
Base Case (45% probability)
Target: $675-$695 range (CHOPPY CONSOLIDATION)
Most likely scenario:
- Apple reports inline or slightly better, but market remains cautious after Microsoft
- SPY consolidates between $680-$695 as earnings season plays out
- Gamma support at $685-$690 holds, but resistance at $695-$700 caps upside
- Mixed mega-cap earnings create rotational rather than directional action
- Implied volatility stays elevated through February as tariff and Fed uncertainty lingers
- Index digests the Microsoft shock without a full-blown correction
Put spread P&L: Total loss of $800K (SPY stays above $658 breakeven)
This is the most likely outcome: The put spread expires worthless, but the trader is comfortable with this. They paid $800K to protect a much larger portfolio -- the same way you pay for car insurance hoping you never need it.
Bear Case (25% probability)
Target: $650-$675 (CORRECTION TERRITORY)
What could go wrong:
- Apple misses earnings tonight, compounding the Microsoft selloff -- two of the top 3 SPY holdings down in the same week
- Amazon and/or Alphabet also disappoint on cloud growth, creating a "cloud winter" narrative
- Tariff escalation headlines emerge, adding 2-3% to cost structures for tech companies
- J.P. Morgan's 35% recession probability starts gaining traction as economic data softens
- Equity risk premium at 0.02% -- among the lowest on record -- means stocks have zero cushion for disappointment
- Break below $680 gamma support triggers cascading stops and momentum selling
- No Fed backstop until June at the earliest
- Institutional rebalancing away from mega-cap tech into defensive sectors
Critical support levels:
- $685-$690: First gamma support -- must hold or momentum shifts bearish
- $675: Major structural support, aligns with implied move lower bound
- $665-$670: Prior consolidation zone
- $650-$658: Deep support and the put spread's profit zone
Put spread P&L in Bear Case:
- SPY at $658 on Feb 20: Break even (tiny profit)
- SPY at $655 on Feb 20: Profit = $2.59/share x 20,000 = $5.18M (547% ROI)
- SPY at $653 on Feb 20: Max profit = $4.59/share x 20,000 = $9.18M (1,048% ROI)
- SPY at $640 on Feb 20: Still max profit of $9.18M (spread is capped at $5 width)
Probability assessment: 25% because it requires multiple negative catalysts to align within 22 days. However, the setup is more plausible than usual: Microsoft has already cracked, valuations offer zero buffer, the Fed is not cutting, and tariff uncertainty is real. Historical precedent shows that after years where the S&P gains 15%+, the following year typically sees average mid-year drawdowns of ~14%.
Trading Ideas
Conservative: Wait for the Dust to Settle
Play: Stay on the sidelines until mega-cap earnings are complete (through early February)
Why this works:
- Microsoft's -12% crash is a WARNING SIGN -- the largest single-day drop since March 2020 for one of SPY's top 3 holdings
- Apple reports TONIGHT -- binary event risk with ~6.4% SPY weighting
- Amazon and Alphabet report next week -- combined ~7.2% of SPY
- These three companies plus Microsoft represent ~25% of SPY -- their earnings will define direction
- Implied volatility is elevated, making options expensive to buy right now
- The equity risk premium is near zero -- stocks are not compensating you for risk at current levels
- No Fed rate cuts until June means no monetary policy backstop if things go wrong
Action plan:
- Watch Apple earnings tonight for confirmation or reversal of the Microsoft-led tech selloff
- Monitor Amazon/Alphabet results in early February for cloud spending trends
- Look for SPY pullback to $675-$680 range (3-5% correction from highs) for better entry
- If SPY holds above $685 through early February, consider re-entering long positions
- Keep position sizes small until tariff and earnings uncertainty clears
Risk level: Minimal (cash position) | Skill level: Beginner-friendly
Expected outcome: Avoid potential 5-10% drawdown if mega-cap earnings disappoint sequentially. Preserve capital for better entry points.
Balanced: Protective Put Spread on Existing SPY Holdings
Play: If you already own SPY or S&P 500 index funds, hedge your portfolio with a smaller version of the institutional trade
Structure: Buy $658 puts, Sell $653 puts (February 20 expiration -- same as the institutional trade)
Why this works:
- Mirrors exactly what the institutional trader did -- "copy the smart money" at the same strikes and expiration
- Defined risk spread costs approximately $0.41 per share ($41 per spread)
- $5 spread width means max profit of $4.59 per share ($459 per spread) if SPY drops below $653
- 12.5:1 reward-to-risk ratio provides meaningful portfolio insurance for very little capital
- 22 days to expiration captures the remaining earnings season, tariff developments, and NVIDIA pre-positioning
- Protects against a 5%+ correction -- the type of drawdown that makes investors panic-sell at the worst time
- Even if the puts expire worthless, the "insurance premium" of $41 per spread is trivial relative to portfolio value
Estimated P&L:
- Cost: ~$41 per spread (buy 658P at $2.44, sell 653P at $2.03)
- Max profit: $459 per spread if SPY below $653 at Feb 20 expiration
- Max loss: $41 per spread (100% of premium, but defined and small)
- Breakeven: SPY at $657.59
Position sizing: For a $100K portfolio, buying 10-20 spreads ($410-$820 total cost) provides meaningful downside protection. This is 0.4-0.8% of portfolio value for insurance against a 5%+ correction.
Risk level: Low-to-Moderate (defined risk, small capital at risk) | Skill level: Intermediate
Aggressive: Short-Term Iron Condor Into Earnings Volatility
Play: Sell an iron condor on SPY to collect premium from elevated implied volatility, betting the index stays range-bound
Structure: Sell $700/$705 call spread + Sell $675/$670 put spread (February 7 expiration -- short-dated to capture IV crush after earnings)
Why this could work:
- Implied volatility is elevated due to earnings uncertainty and the Microsoft selloff
- SPY rarely moves more than 3% in a single week outside of crisis periods
- Gamma support at $685-$690 and resistance at $695-$700 create natural boundaries
- The most likely outcome (45% base case) is range-bound consolidation between $675-$695
- Short-dated expiration (9 days) means rapid time decay works in your favor
- Post-earnings IV crush will deflate option premiums, benefiting short positions
Why this could go wrong (REAL RISKS):
- Apple earnings tonight could gap SPY +/-2% by tomorrow morning
- If Apple AND Amazon disappoint, a cascading tech selloff could blow through the $675 put strike
- Tariff escalation headlines could spike volatility without warning
- The Microsoft crash shows that single-stock events can impact SPY meaningfully (MSFT is ~6.5% of the index)
- Iron condors have limited profit but potentially significant loss if breached
Estimated P&L:
- Estimated credit: $1.00-$1.50 per iron condor ($100-$150 per spread)
- Max profit: Full credit received if SPY stays between $675-$700 at Feb 7 expiration
- Max loss: $3.50-$4.00 per spread ($350-$400) if SPY breaks above $705 or below $670
- Probability of profit: ~60-65%
CRITICAL WARNING -- DO NOT attempt unless you:
- Have traded iron condors before and understand max loss scenarios
- Can monitor positions daily and adjust if SPY approaches breakeven levels
- Accept the risk of losing 2-3x the premium collected
- Understand that earnings-related gaps can blow through short strikes overnight
- Have sufficient margin to hold the position
Risk level: HIGH (unlimited loss relative to premium, gap risk) | Skill level: Advanced only
Risk Factors
Do not ignore these potential landmines:
-
Microsoft contagion -- the $2 TRILLION warning shot: Microsoft's -12% crash today (worst since March 2020) on slowing Azure cloud growth is not an isolated event. As the 3rd largest SPY holding (~6.5% weight), this single stock erased roughly $250B in market cap in one session. If this signals a broader enterprise AI spending deceleration, the ripple effects through SPY's 34.77% Technology weighting could be severe. Amazon (AWS), Alphabet (Google Cloud), and other cloud/AI names report in early February -- any similar disappointments would compound the damage.
-
Extreme concentration risk -- "Magnificent 7" dependency: The top 7 stocks in SPY (Apple, Microsoft, NVIDIA, Amazon, Alphabet, Meta, Tesla) represent approximately 30-35% of the entire index. This means a coordinated 10% decline in these names alone would drag SPY down 3-3.5%. With Microsoft already down 12% and Apple reporting tonight, the concentration risk is not theoretical -- it is playing out in real time.
-
Near-zero equity risk premium: At current valuations, the S&P 500's equity risk premium is just 0.02% -- among the lowest on record. Translation: stocks are priced to deliver almost identical returns to risk-free Treasury bonds. At these levels, as analysts note, "stocks don't need a crisis to fall; they only need disappointment." The margin for error is essentially zero.
-
No Fed backstop until June: The FOMC held rates at 3.50%-3.75% yesterday with no cuts expected until at least June. In prior selloffs (2018, 2020, 2022-23), the market relied on the "Fed put" -- the expectation that the Fed would cut rates to support markets. That safety net does not exist right now. If SPY drops 5-10%, the Fed is unlikely to respond with emergency action while inflation concerns from tariffs persist.
-
Tariff escalation wildcard: The January 15 semiconductor tariffs are just the beginning. The 90-day negotiation deadline extends to mid-April, and broader semiconductor tariffs remain possible. U.S.-South Korea tariff tensions could further disrupt supply chains. Any surprise escalation could spike volatility and hit tech-heavy SPY disproportionately.
-
Recession risk is not zero: J.P. Morgan assigns a 35% probability of U.S./global recession in 2026. Unemployment is rising, layoffs are up 54% YoY, and consumer confidence is near decade lows. At 28.5x trailing P/E, SPY is priced for growth, not contraction. Even a mild recession could trigger a 20-30% correction from current levels.
-
Historical precedent after strong years: After years where the S&P 500 gains 15%+, the following year typically sees average mid-year drawdowns of ~14%. With the S&P up strongly in both 2024 and 2025, the odds of a meaningful pullback in 2026 are elevated by historical standards.
-
Fed Chair transition uncertainty: Powell's term expires May 15, 2026, and history shows "the market struggles in the first six months of a new Fed Chair, with an average correction of about 15%". While this is beyond the Feb 20 expiration, the uncertainty begins to get priced in well before the actual transition.
The Bottom Line
Real talk: An institutional player just paid $800K for the right to make $10 MILLION if the S&P 500 drops 5% in the next 22 days. On any normal day, this would be unremarkable portfolio insurance. But today is not a normal day. Microsoft -- one of the three largest companies in the world -- just lost 12% of its value in a single session. Apple reports earnings tonight. The Fed is on hold. Tariffs are creating uncertainty. And the equity risk premium is essentially zero.
What this trade tells us:
- Sophisticated money sees the next 22 days as a high-risk window for broad market weakness
- The $658/$653 strike selection (5% below current price) is not random -- it targets a correction that breaks through all nearby support levels
- The 12.5:1 reward-to-risk structure means they need this to work less than 10% of the time to be a positive expected value trade over repeated bets
- The timing aligns perfectly with the densest earnings window of the year plus unresolved macro catalysts
- The size (20,000 contracts, $1.38B notional) confirms this is institutional, not retail speculation
This is NOT a "sell everything" signal. This IS a "buy insurance while it is cheap" signal.
If you own SPY or S&P 500 index funds:
- Consider trimming 10-20% of your equity exposure at $690+ (lock in gains near all-time highs)
- If holding through the earnings gauntlet, accept the risk of a 5-10% drawdown and do not panic-sell at the bottom
- A small protective put spread (like the institutional trade above) costs less than 0.1% of portfolio value and protects against the worst-case scenario
- Watch $680 as the critical "line in the sand" -- a close below that level on meaningful volume would suggest the correction is real
If you are watching from the sidelines:
- Do NOT chase the rally at $690+ with the S&P at all-time highs and mega-cap earnings creating binary risk
- A pullback to $665-$675 would offer a much better entry point with 3-5% margin of safety
- Implied volatility should decline after the earnings gauntlet completes in early February -- wait for cheaper option premiums
- The consensus year-end 2026 target is $750 (SPY equivalent) -- there is plenty of upside even if you wait for a dip
If you are bearish:
- The bear put spread structure used by the institutional trader is the smartest way to play downside -- defined risk, outsized reward
- Watch for Apple earnings tonight as the next catalyst -- a miss would create a two-day mega-cap selloff (MSFT + AAPL) that could accelerate the correction
- $680 is the first major support to watch -- break below triggers momentum selling toward $675, then $665
- Do NOT short SPY outright at all-time highs -- use defined-risk option strategies only
Mark your calendar -- Key dates:
- January 29 (Today) after close - Apple (AAPL) Q4 earnings (6.4% of SPY)
- February 4-5 - Amazon (AMZN) + Alphabet (GOOGL) earnings (combined ~7.2% of SPY)
- February 20 - Monthly OPEX and expiration of this $800K put spread
- February 25 - NVIDIA (NVDA) Q4 FY2026 earnings (7.66% of SPY -- largest holding)
- March 18-19 - FOMC Meeting (no cut expected)
- Mid-April - Semiconductor tariff 90-day negotiation deadline
- May 15 - Jerome Powell's Fed Chair term expires
- June 16-17 - FOMC Meeting (first potential rate cut)
Final verdict: SPY is at one of those inflection points where the bullish trend meets a wall of near-term risk. The long-term case for U.S. equities remains intact -- earnings growth of 14.9% is expected for 2026, AI capex is booming (Meta just guided $115-135B for 2026), and the economy is on "firm footing" per the Fed. But the next 22 days are loaded with landmines: mega-cap earnings that could disappoint (Microsoft already has), no Fed rate cuts to backstop a selloff, tariff uncertainty, and near-zero equity risk premium that leaves no room for error.
The institutional put spread buyer is not betting the market will crash. They are saying: "At 12.5:1 odds, the cost of being wrong is trivial -- and the cost of being right is life-changing." That is smart risk management, not fear.
Be patient. Let earnings play out. If the market dips, buy the dip with conviction. If it does not dip, you will still sleep well knowing you did not overpay at the top.
Disclaimer: Options trading involves substantial risk of loss and is not suitable for all investors. This analysis is for educational purposes only and not financial advice. Past performance does not guarantee future results. The unusual activity detected reflects this specific trade's characteristics -- it does not imply the trade will be profitable or that you should follow it. SPY options are highly liquid, but spreads can still experience slippage on large orders. Always do your own research and consider consulting a licensed financial advisor before trading. Bear put spreads have defined risk but can still result in 100% loss of premium paid. The S&P 500 can gap significantly overnight on earnings or geopolitical news.
About SPDR S&P 500 ETF Trust: SPY is the world's largest ETF with $714.34 billion in assets under management, tracking the S&P 500 index of 500 leading U.S. large-cap companies. With a 0.09% expense ratio and 1.1% dividend yield, it serves as the benchmark for U.S. equity markets and the most actively traded security in the world.