🛡️ SPY Massive $51M Hedging Bomb Dropped - Institutions Bracing for Turbulence!
📅 February 24, 2026 | 🔥 Unusual Activity Detected
🎯 The Quick Take
Someone just deployed $51.1 MILLION in put options on SPY in a single coordinated block at 10:45:57 AM - and this isn't just bearish betting, it's sophisticated institutional hedging through a put calendar spread structure. With $42M in put buys against only $9.4M in put sales, big money is paying up for downside protection heading into a minefield of catalysts: sticky inflation (Core PCE at 3.0%), fresh 15% global tariffs, and the Fed stuck at 3.5-3.75%. When the smart money hedges this aggressively, retail traders need to pay attention.
📊 About SPY
State Street SPDR S&P 500 ETF Trust is the world's largest and most liquid ETF, tracking the S&P 500 index with $695.77 billion in assets under management. SPY is the go-to instrument for institutional hedging, index exposure, and options trading - making unusual options activity here a crucial barometer for broader market sentiment.
| Metric | Value |
|---|---|
| Current Price | $685.84 |
| 52-Week Range | $481.80 - $697.84 |
| AUM | $695.77B |
| YTD Return | +0.6% |
| S&P 500 Level | ~6,900 |
💰 The Option Flow Breakdown
📊 What Just Happened
Five massive put trades hit the tape simultaneously at 10:45:57 AM - a coordinated institutional move totaling $51.1 million in premium:
| Direction | Strike | Expiration | Premium | Size | Price | Option Symbol |
|---|---|---|---|---|---|---|
| 🔴 BUY PUT | $695 | 2026-03-06 | $15M | 12,720 | $11.85 | SPY20260306P695 |
| 🔴 BUY PUT | $660 | 2026-05-29 | $9.5M | 6,678 | $14.23 | SPY20260529P660 |
| 🟢 SELL PUT | $690 | 2026-02-27 | $9.4M | 14,014 | $6.69 | SPY20260227P690 |
| 🔴 BUY PUT | $690 | 2026-03-06 | $8.6M | 9,540 | $9.26 | SPY20260306P690 |
| 🔴 BUY PUT | $695 | 2026-03-06 | $8.6M | 7,280 | $11.84 | SPY20260306P695 |
Net Premium Paid: ~$41.7M (buying $51.1M in puts, selling $9.4M)
Strategy Detection: All five trades executed as standalone positions with HIGH_ACTIVITY volume signals (Vol/OI ratios of 4.5x to 19x), indicating fresh institutional positioning rather than rolls or adjustments.
🤓 What This Actually Means
This isn't panic selling or a one-way bearish bet - this is textbook institutional hedging through a put calendar spread structure:
🔵 The Short-Dated Put Sale ($690 strike, Feb 27 exp): They're collecting $9.4M in premium by selling puts expiring in just 3 days. This reduces the net cost of their hedge and profits if SPY stays above $690 through Friday.
🔵 The Near-Term Put Buys ($690-$695 strikes, Mar 6 exp): The bulk of the position - $32.2M - is concentrated in puts expiring in 10 days. These protect against a sharp selloff through the February jobs report (March 6) and into the March 12 CPI print.
🔵 The Longer-Dated Put Buy ($660 strike, May 29 exp): A $9.5M position 3+ months out at $660 (3.8% below current price) provides tail-risk protection through the March FOMC meeting, Q1 earnings season, and spring volatility.
Translation: Big money expects potential turbulence over the next 2-4 weeks but isn't betting on a crash. They're paying a premium to sleep well at night while maintaining market exposure.
📈 Technical Setup / Chart Check-Up
YTD Performance Analysis
SPY is essentially flat year-to-date, up just +0.6% after a choppy start to 2026. The chart shows the index has been range-bound between $680 and $700, with recent attempts to break higher failing at resistance.
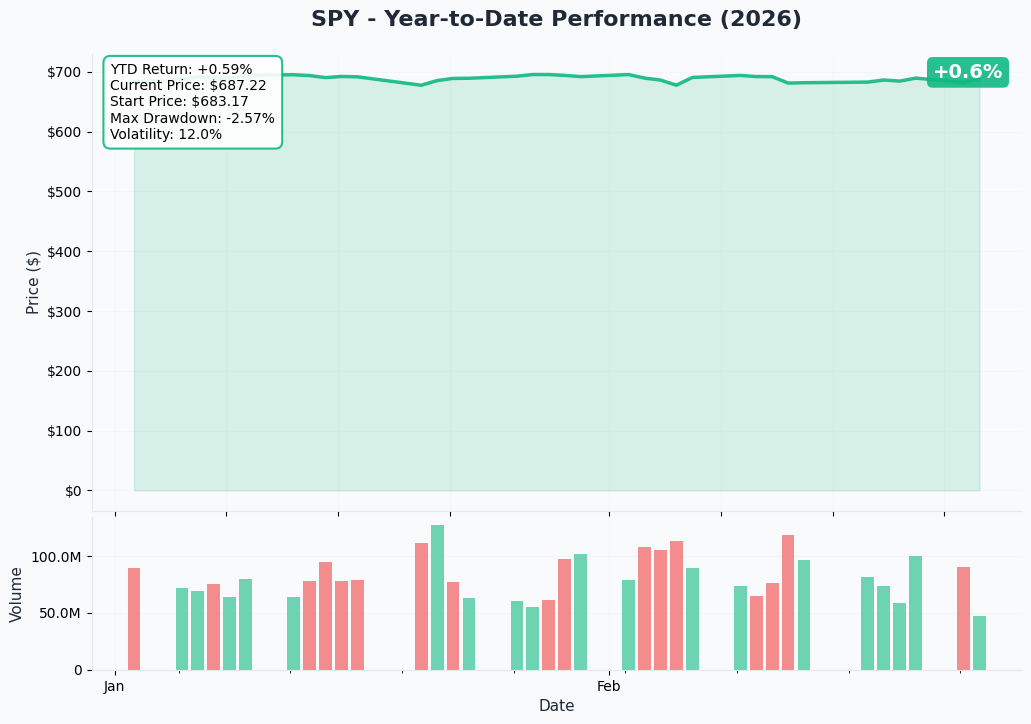
Key Technical Observations:
📉 Max Drawdown: -2.57% YTD - relatively contained despite the volatility spike 📊 Volatility: 12.0% annualized - elevated but not extreme 🎯 Current Price: $685.84 - sitting in the middle of the recent range
Key Support & Resistance Levels
Based on technical analysis from Financial Content:
| Level Type | SPY Price | S&P 500 Level | Significance |
|---|---|---|---|
| 🟠 Major Resistance | $700-702 | 7,000-7,020 | Psychological + 161.8% Fib extension |
| 🟠 Current Resistance | $690 | 6,900 | Historic horizontal resistance |
| 🔵 Near Support | $694-697 | 6,945-6,975 | Brief consolidation zone |
| 🔵 Critical Support | $680 | 6,800 | Bull/bear pivot - "line in the sand" |
| 🔵 Deep Support | $678-672 | 6,780-6,720 | Pattern support |
| 🔵 Downside Target | $673 | 6,730 | Seasonal weakness resolution |
The Option Flow Connection: The put buying is concentrated at $690-$695 strikes - exactly where the current resistance and consolidation zone sits. Institutions are protecting against a break below the $690 level that could trigger accelerated selling toward the $680 "line in the sand."
🎪 Catalysts
🔴 Recent Catalysts (Already Happened)
📉 February 23 - PCE Inflation Hot: Core PCE came in at 3.0%, well above the Fed's 2% target. Supercore services inflation surged 0.6% in January - the sharpest monthly gain in nearly a year. Rate cut hopes crushed.
📉 February 23 - 15% Global Tariff Signed: President Trump signed executive order implementing 15% flat global tariff under Section 122 after Supreme Court struck down reciprocal tariffs. Trade war escalation risk elevated.
📉 February 24 - VIX Spikes 42% YTD: Fear index hit 2026 highs of 21.01-21.53 amid "software-mageddon" and tariff concerns.
📊 Q4 2025 Earnings Solid: 13.2% YoY earnings growth, 74% beat rate, highest net profit margins since 2009 at 13.2%.
🟢 Upcoming Catalysts (Mark Your Calendar)
| Date | Event | Why It Matters |
|---|---|---|
| 📅 March 6, 2026 | February Jobs Report | Labor market health - January was +130K |
| 📅 March 12, 2026 | February CPI Report | Inflation trajectory - January was 2.4% YoY |
| 📅 March 17-18, 2026 | FOMC Meeting + Projections | Fed expected to hold at 3.50-3.75% |
| 📅 April 2026 | Q1 2026 Earnings Begin | 11.1% growth expected |
| 📅 November 2026 | Midterm Elections | Historical volatility catalyst |
Catalyst Alignment with Options: The March 6 expiration puts ($32.2M) cover the jobs report. The May 29 expiration put ($9.5M) covers FOMC, earnings season, and spring volatility.
🎲 Price Targets & Probabilities
Based on the institutional positioning and technical setup:
🐻 Bear Case: $660-$680 (25% probability)
Scenario: Inflation stays sticky, Fed turns more hawkish, tariff impacts hit earnings guidance, market breadth deteriorates further.
Triggers:
- Break below $680 "line in the sand"
- CPI surprises higher on March 12
- Services PMI stays below 50 signaling recession
The $660 put buy targets exactly this scenario - a 3.8% decline to deep support.
⚖️ Base Case: $680-$695 (50% probability)
Scenario: Market digests recent shocks, consolidates below $700 resistance, choppy trading ahead of FOMC.
Why This Works: High gamma at current strikes creates "magnetic" effect. Market makers hedging these massive put positions will buy dips and sell rallies, keeping prices range-bound.
🚀 Bull Case: $695-$710 (25% probability)
Scenario: Inflation cools, Fed signals cuts possible, tariff fears overblown, earnings guidance remains strong.
Triggers:
- Clean break above $690-695 resistance
- CPI comes in below 2.4%
- Dovish FOMC surprise
💡 Trading Ideas
🛡️ Conservative: "Sleep Well" Hedge
Strategy: Buy SPY $680 Put, 2026-03-21 expiration
Why This Works: Protect your portfolio through the March FOMC meeting and jobs/CPI data. If you own SPY or S&P 500 stocks, this is cheap insurance against a 5%+ correction.
Risk/Reward: Limited downside (premium paid), unlimited protection below $680.
⚖️ Balanced: "Follow the Whales" Put Spread
Strategy: Buy SPY $690 Put / Sell SPY $670 Put, 2026-03-06 expiration
Why This Works: Mirrors the institutional structure - buy downside protection but sell further OTM puts to reduce cost. Profits on a move from current $685 down to $670 area.
Max Profit: $2,000 per spread | Max Loss: Premium paid (~$3-4 per spread)
🚀 Aggressive: "Volatility Crush" Calendar Spread
Strategy: Sell SPY $685 Put (2026-02-28 exp) / Buy SPY $685 Put (2026-03-06 exp)
Why This Works: If SPY stays pinned near current levels through Friday's expiration, the short put decays faster. You profit from the volatility differential and time decay.
Risk: Gap down before short put expires.
⚠️ Risk Factors
🔴 Inflation Stays Sticky
Core PCE at 3.0% is well above target. If supercore services inflation persists, the Fed may turn hawkish, crushing rate cut hopes and pressuring valuations.
🔴 Trade War Escalation
The 15% global tariff could trigger retaliation and hit supply chains. Services PMI already dropped below 50 for the first time in two years - a recession warning sign.
🔴 Valuation Rich, No Margin for Error
At 21.5x forward P/E and near-zero equity risk premium, the market is priced for perfection. Any earnings disappointment could trigger a sharp repricing.
🔴 Market Breadth Deterioration
Savior Market Conviction Compass dropped from 62 to 51 - fewer stocks participating in advances means the index is increasingly fragile.
🔴 VIX Elevated
With the VIX up 42% YTD, options premiums are expensive. Hedges cost more, and any volatility spike could trigger systematic selling.
🎯 The Bottom Line
Real talk: When institutions drop $51 million on put protection in a single second, they're not being paranoid - they're seeing something in the data that retail traders might miss.
The combination of:
- 🔴 Sticky 3% Core PCE inflation
- 🔴 New 15% global tariffs
- 🔴 VIX at 2026 highs
- 🔴 Market breadth deteriorating
- 🔴 Near-zero equity risk premium
...creates a fragile environment where the upside is capped at $700 resistance and the downside could accelerate quickly if $680 breaks.
📋 Your Action Plan
If you own SPY or S&P 500 exposure:
- Consider adding put protection through the March FOMC meeting
- Watch the $680 level as your "line in the sand"
- Be ready to reduce exposure if CPI surprises hot on March 12
If you're looking to buy the dip:
- Wait for a test of $680 support before adding
- Scale in gradually - don't YOLO at resistance
- Use the March 17-18 FOMC as your decision point
If you're bearish:
- The institutions have already shown you the playbook: put calendars
- Focus on the $660-$680 zone as your target
- Don't fight the Fed if they turn hawkish
Mark Your Calendar: March 6 (Jobs), March 12 (CPI), March 17-18 (FOMC) - these are your decision points.
📊 Track SPY options flow live: SPY on Ainvest
Disclaimer: This analysis is for informational purposes only and does not constitute investment advice. Options trading involves substantial risk of loss and is not suitable for all investors. Past performance does not guarantee future results. Always do your own research and consider your risk tolerance before trading.