🐋 SPY $39.5M Put Fortress - Institutional Whale Builds Massive Crash Insurance Ahead of NVIDIA Earnings!
📅 February 25, 2026 | 🔥 Unusual Activity Detected
🎯 The Quick Take
Someone just dropped $39.5 MILLION across two massive put structures on SPY -- a bear put spread and a put butterfly totaling 500,000+ contracts expiring April 17, 2026. These strikes range from $475 to $585, all deep out-of-the-money puts protecting against a -15% to -31% crash from current levels. This is not a directional bet -- this is institutional-grade portfolio insurance from someone managing billions in equity exposure, and they are paying up for it on the same day NVIDIA reports earnings and tariff uncertainty is peaking.
📊 ETF Overview
SPDR S&P 500 ETF Trust (SPY) is the world's largest and most liquid ETF, tracking the S&P 500 Index:
- 📈 What it tracks: The S&P 500 Index -- 500 of America's largest publicly traded companies
- 💰 AUM: ~$707B (managed by State Street Global Advisors)
- 🏢 Sector: Broad Market ETF
- 📈 Exchange: NYSE Arca
- 📊 Current Price: ~$693
- 📊 52-Week Range: $481.80 - $697.84
- 📊 YTD Return: +1.4% (S&P 500 level ~6,925)
- 🔥 Key Story: Navigating a historically significant week -- NVIDIA earnings tonight, Supreme Court tariff ruling aftermath, "Software-mageddon" fears, and the "Great Rotation" away from mega-cap tech
💰 The Option Flow Breakdown
📊 The Tape - Block 1: Bear Put Spread (February 25, 2026 @ 11:52:22)
| Time | Symbol | Side | Buy/Sell | Type | Expiration | Premium | Strike | Volume | Spot | Option Symbol |
|---|---|---|---|---|---|---|---|---|---|---|
| 11:52:22 | SPY | MID | BUY | PUT $585 | 2026-04-17 | $18M | $585 | 100,000 | $693 | SPY20260417P585 |
| 11:52:22 | SPY | MID | SELL | PUT $485 | 2026-04-17 | $5M | $485 | 100,000 | $693 | SPY20260417P485 |
| 11:52:22 | SPY | MID | SELL | PUT $535 | 2026-04-17 | $9.1M | $535 | 200,000 | $693 | SPY20260417P535 |
| 11:52:22 | SPY | MID | BUY | PUT $535 | 2026-04-17 | $9.2M | $535 | 100,000 | $693 | SPY20260417P535 |
Block 1 Net Cost: ~$12.9M ($18M - $5M - $9.1M + $9.2M)
📊 The Tape - Block 2: Put Butterfly (February 25, 2026 @ 14:50:14)
| Time | Symbol | Side | Buy/Sell | Type | Expiration | Premium | Strike | Volume | Spot | Option Symbol |
|---|---|---|---|---|---|---|---|---|---|---|
| 14:50:14 | SPY | MID | BUY | PUT $575 | 2026-04-17 | $11M | $575 | 75,000 | $693 | SPY20260417P575 |
| 14:50:14 | SPY | MID | SELL | PUT $525 | 2026-04-17 | $12M | $525 | 150,000 | $693 | SPY20260417P525 |
| 14:50:14 | SPY | MID | BUY | PUT $475 | 2026-04-17 | $3.4M | $475 | 75,000 | $693 | SPY20260417P475 |
Block 2 Net Cost: ~$2.4M ($11M + $3.4M - $12M)
Combined Total: ~$39.5M gross premium across 500,000+ contracts | Net cost: ~$15.3M
🤓 What This Actually Means
Let me break this down in plain English -- because these two trades tell a very specific story about how serious money protects itself:
Block 1 -- The Bear Put Spread + Short Put (~$12.9M net):
- 💸 $18M spent buying 100,000 $585 puts -- the core downside protection leg
- 🛡️ $5M collected selling 100,000 $485 puts -- caps the protection floor at $485 (a -30% crash level)
- ⚖️ The $535 puts net to selling 100,000 contracts for a tiny $0.1M credit (200,000 sold minus 100,000 bought at essentially the same price)
- 📊 What it does: Pays out between $585 and $485 if SPY crashes, with a short $535 put adding income but also creating additional risk below that level
- 🎯 Sweet spot: Maximum protection kicks in between $535-$585 (a -15.6% to -22.8% decline)
Block 2 -- The Put Butterfly (~$2.4M net):
- 🦋 Long $575 / Short $525 / Long $475 put butterfly in a clean 1:2:1 ratio (75k / 150k / 75k)
- 📈 Max profit at $525 -- that is SPY dropping roughly -24% from current levels
- 💰 Cost just $2.4M for enormous notional exposure -- this is spectacularly capital-efficient crash insurance
- 📊 Profit range: Between $575 and $475 -- pays off in a severe correction or crash scenario
The Big Picture:
This is tail risk hedging / portfolio insurance -- the financial equivalent of a billionaire buying the most expensive earthquake policy available.
- ⚠️ All strikes ($475-$585) are far below even the April 17 implied lower range of $668. These are -15% to -31% OTM puts
- 🏦 The 500,000+ contract size screams institutional hedge fund, pension fund, or sovereign wealth fund protecting a multi-billion dollar equity portfolio
- 📅 The April 17 expiration covers the next two FOMC meetings (March 17-18, April 28-29), jobs reports, PCE inflation data, and the Section 122 tariff window
- 🤝 MID fills on both blocks confirm institutional negotiation -- this was pre-arranged with market makers, not someone panic-buying on a screen
- 🎯 The overlapping $535 strikes and complementary structures suggest the same institution placed both blocks, building layered downside protection
- ⏰ Two blocks spaced 3 hours apart (11:52 and 14:50) suggest deliberate, phased execution -- not a single panic trade
Why today? NVIDIA earnings tonight (6-7% of the S&P 500), tariff policy in flux after the Supreme Court's IEEPA ruling, VIX at its 2026 peak, and GDP already stumbling at 1.4%. This is the most catalyst-dense single day of Q1 2026.
📈 Technical Setup / Chart Check-Up
YTD Performance
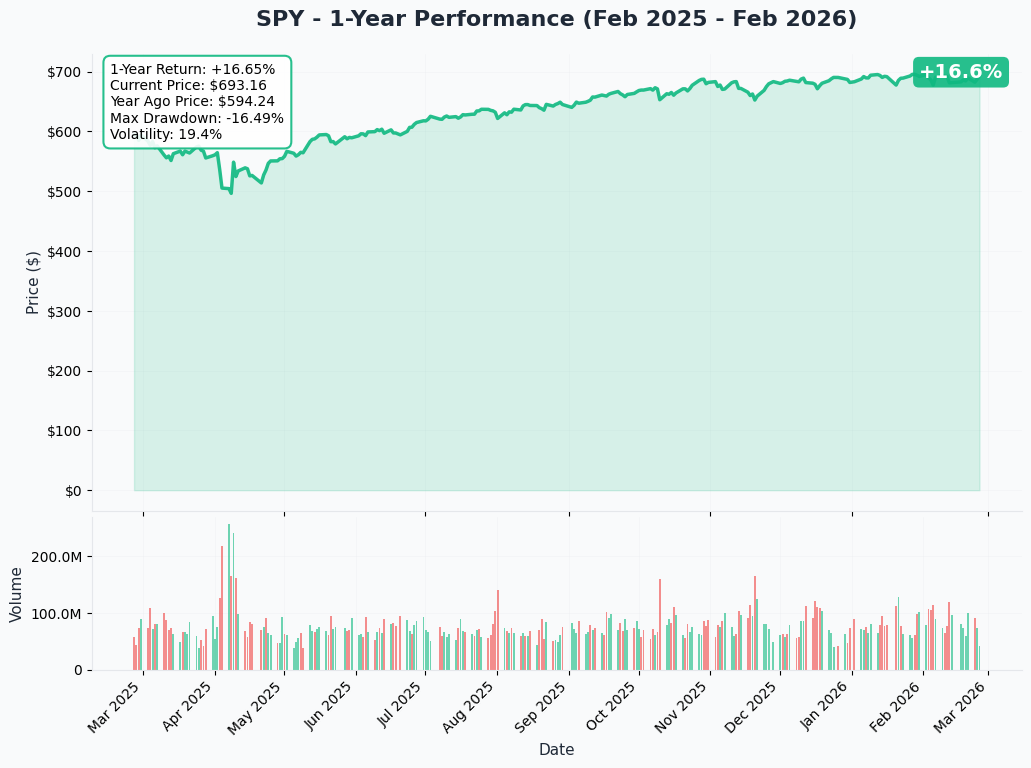
SPY is up a modest +1.4% YTD at ~$693, trading near its all-time high of $697.84. But the headline number masks violent rotations churning underneath:
- 🔄 The Great Rotation: Equal-weight RSP is up >5% YTD while cap-weighted SPY barely budges -- the widest gap since 1992
- 📉 Software-mageddon: $800B+ erased from the S&P 500 Software Index in early February after AI agent disruption fears
- ⚡ Energy leads, tech lags: Energy +22.7% YTD vs Info Tech -4.5% -- a complete reversal from the prior 3 years
- 📊 Near ATH but fragile: SPY is near its all-time high, which makes this massive put hedge even more notable -- someone sees cracks beneath the surface
- 😰 VIX at 21+ -- the 2026 peak, up from 14-15 just three weeks ago
- 📊 $8.8B of inflows over 6 weeks through mid-February -- but recent 5-day data shows -$5.0B in outflows, suggesting the tide may be turning
Key takeaway: SPY is deceptively calm on the surface while a once-in-a-generation sector rotation rips through the index. The mega-cap tech names that carried markets for 3 years are now the biggest drag, and this whale is hedging against the possibility that the rotation turns into a rout.
Gamma-Based Support & Resistance Analysis
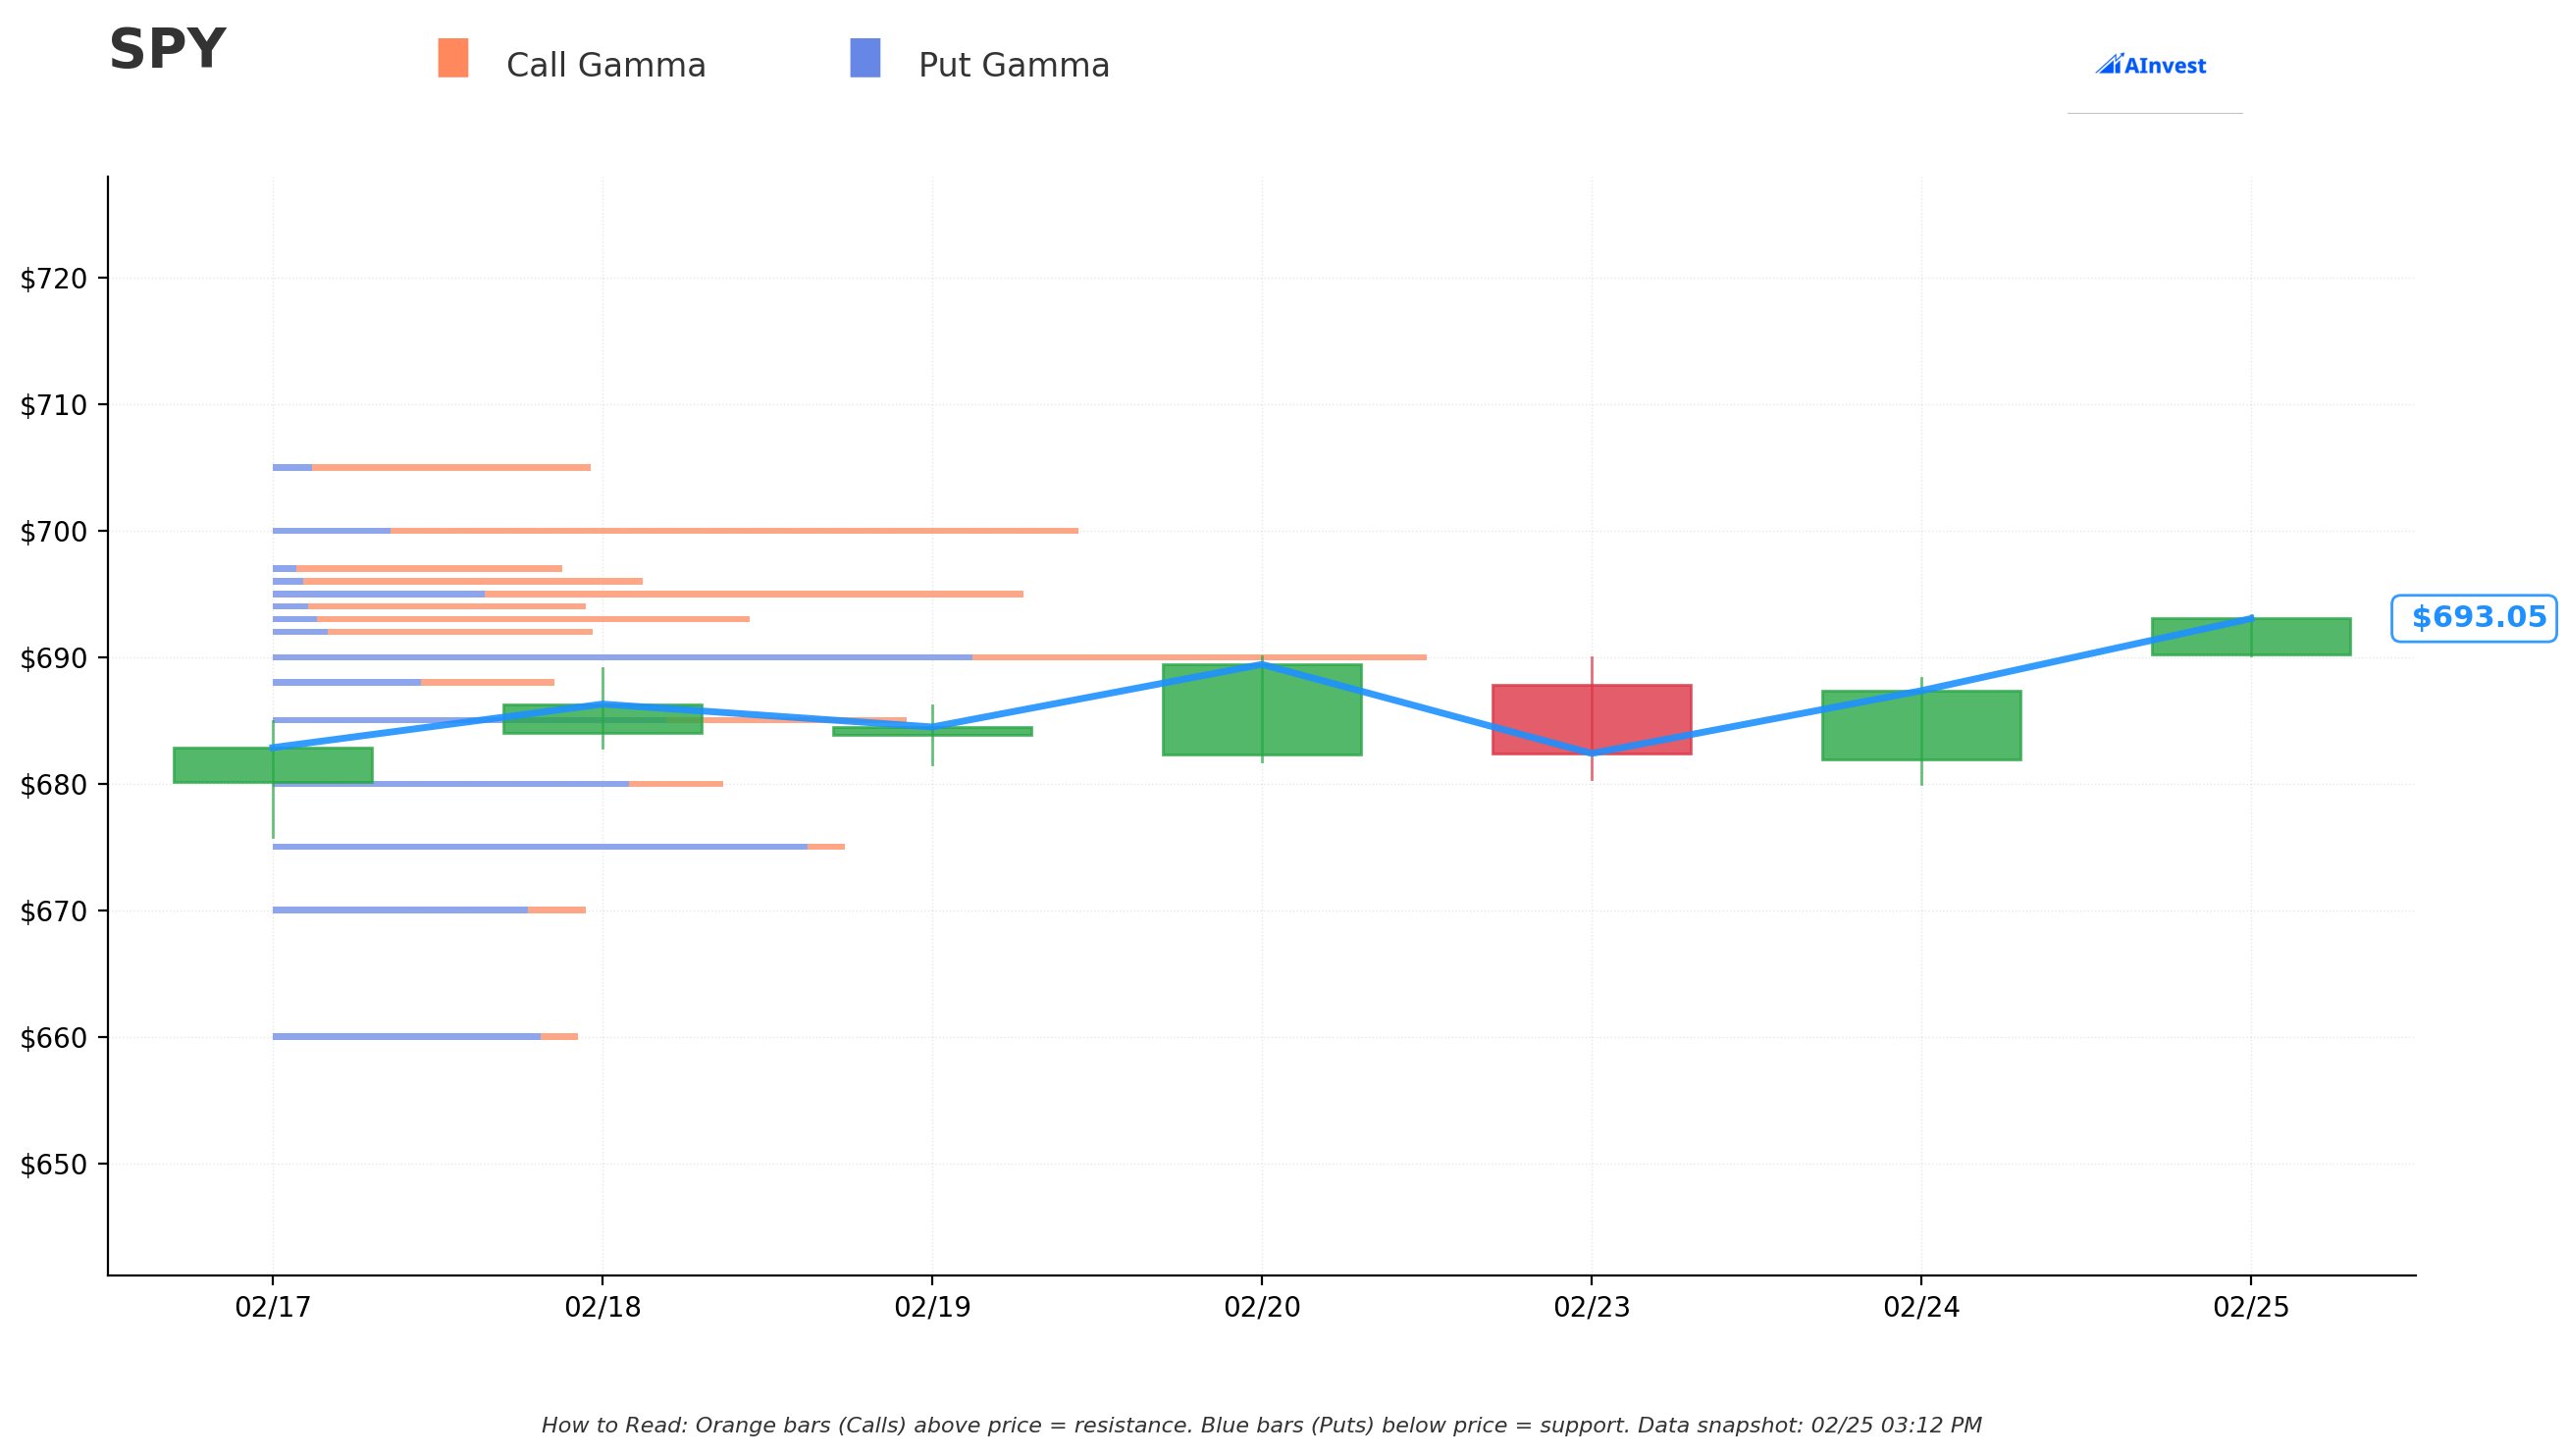
Current Price: $692.98
The gamma exposure map shows where options dealers have massive positions -- these create natural magnets and barriers for price:
🔵 Support Levels (Put Gamma Below Price):
- $692 -- Immediate floor with 131B total gamma (just 0.14% below -- very tight support)
- $690 -- MASSIVE support at 473B total gamma (0.43% below -- strongest put concentration on the board! This is the LINE IN THE SAND)
- $685 -- Secondary support at 261B gamma (1.15% below)
- $680 -- Structural floor at 185B gamma (1.87% below)
- $675 -- Extended support at 235B gamma (2.59% below -- serious put wall)
🟠 Resistance Levels (Call Gamma Above Price):
- $693 -- Immediate resistance at 195B gamma (essentially at current price -- dealers selling here)
- $695 -- Key near-term hurdle at 304B gamma (0.29% above)
- $696 -- Additional resistance at 149B gamma
- $700 -- MAJOR psychological and technical resistance at 326B gamma (1.01% above -- the BIG level everyone is watching)
- $705 -- Extended resistance at 129B gamma (1.73% above)
What this means for traders:
SPY is sandwiched in a tight $690-$700 range. The $690 level has the strongest gamma concentration of any single level -- this is the floor that market makers will defend. On the upside, $700 is the gateway: clearing it opens the path toward a new all-time high. A break below $690 opens up $680, and below that, gamma thins out considerably -- meaning selling could accelerate if those levels fail.
Critical context for the put trades: The whale's strikes ($475-$585) are far, far below any current gamma support levels. This is not about trading the near-term range. This is insuring against a scenario where ALL current support levels fail and the market enters free-fall. Think March 2020, not a garden-variety 5% pullback.
Net GEX Bias: Bullish (3,142B total call gamma vs. 2,593B total put gamma) -- overall dealer positioning leans bullish, which means dealers are short calls and long puts. In a selloff, they would be selling delta to stay hedged, potentially amplifying downward moves. This is exactly the dynamic that makes institutional tail hedging valuable.
Implied Move Analysis
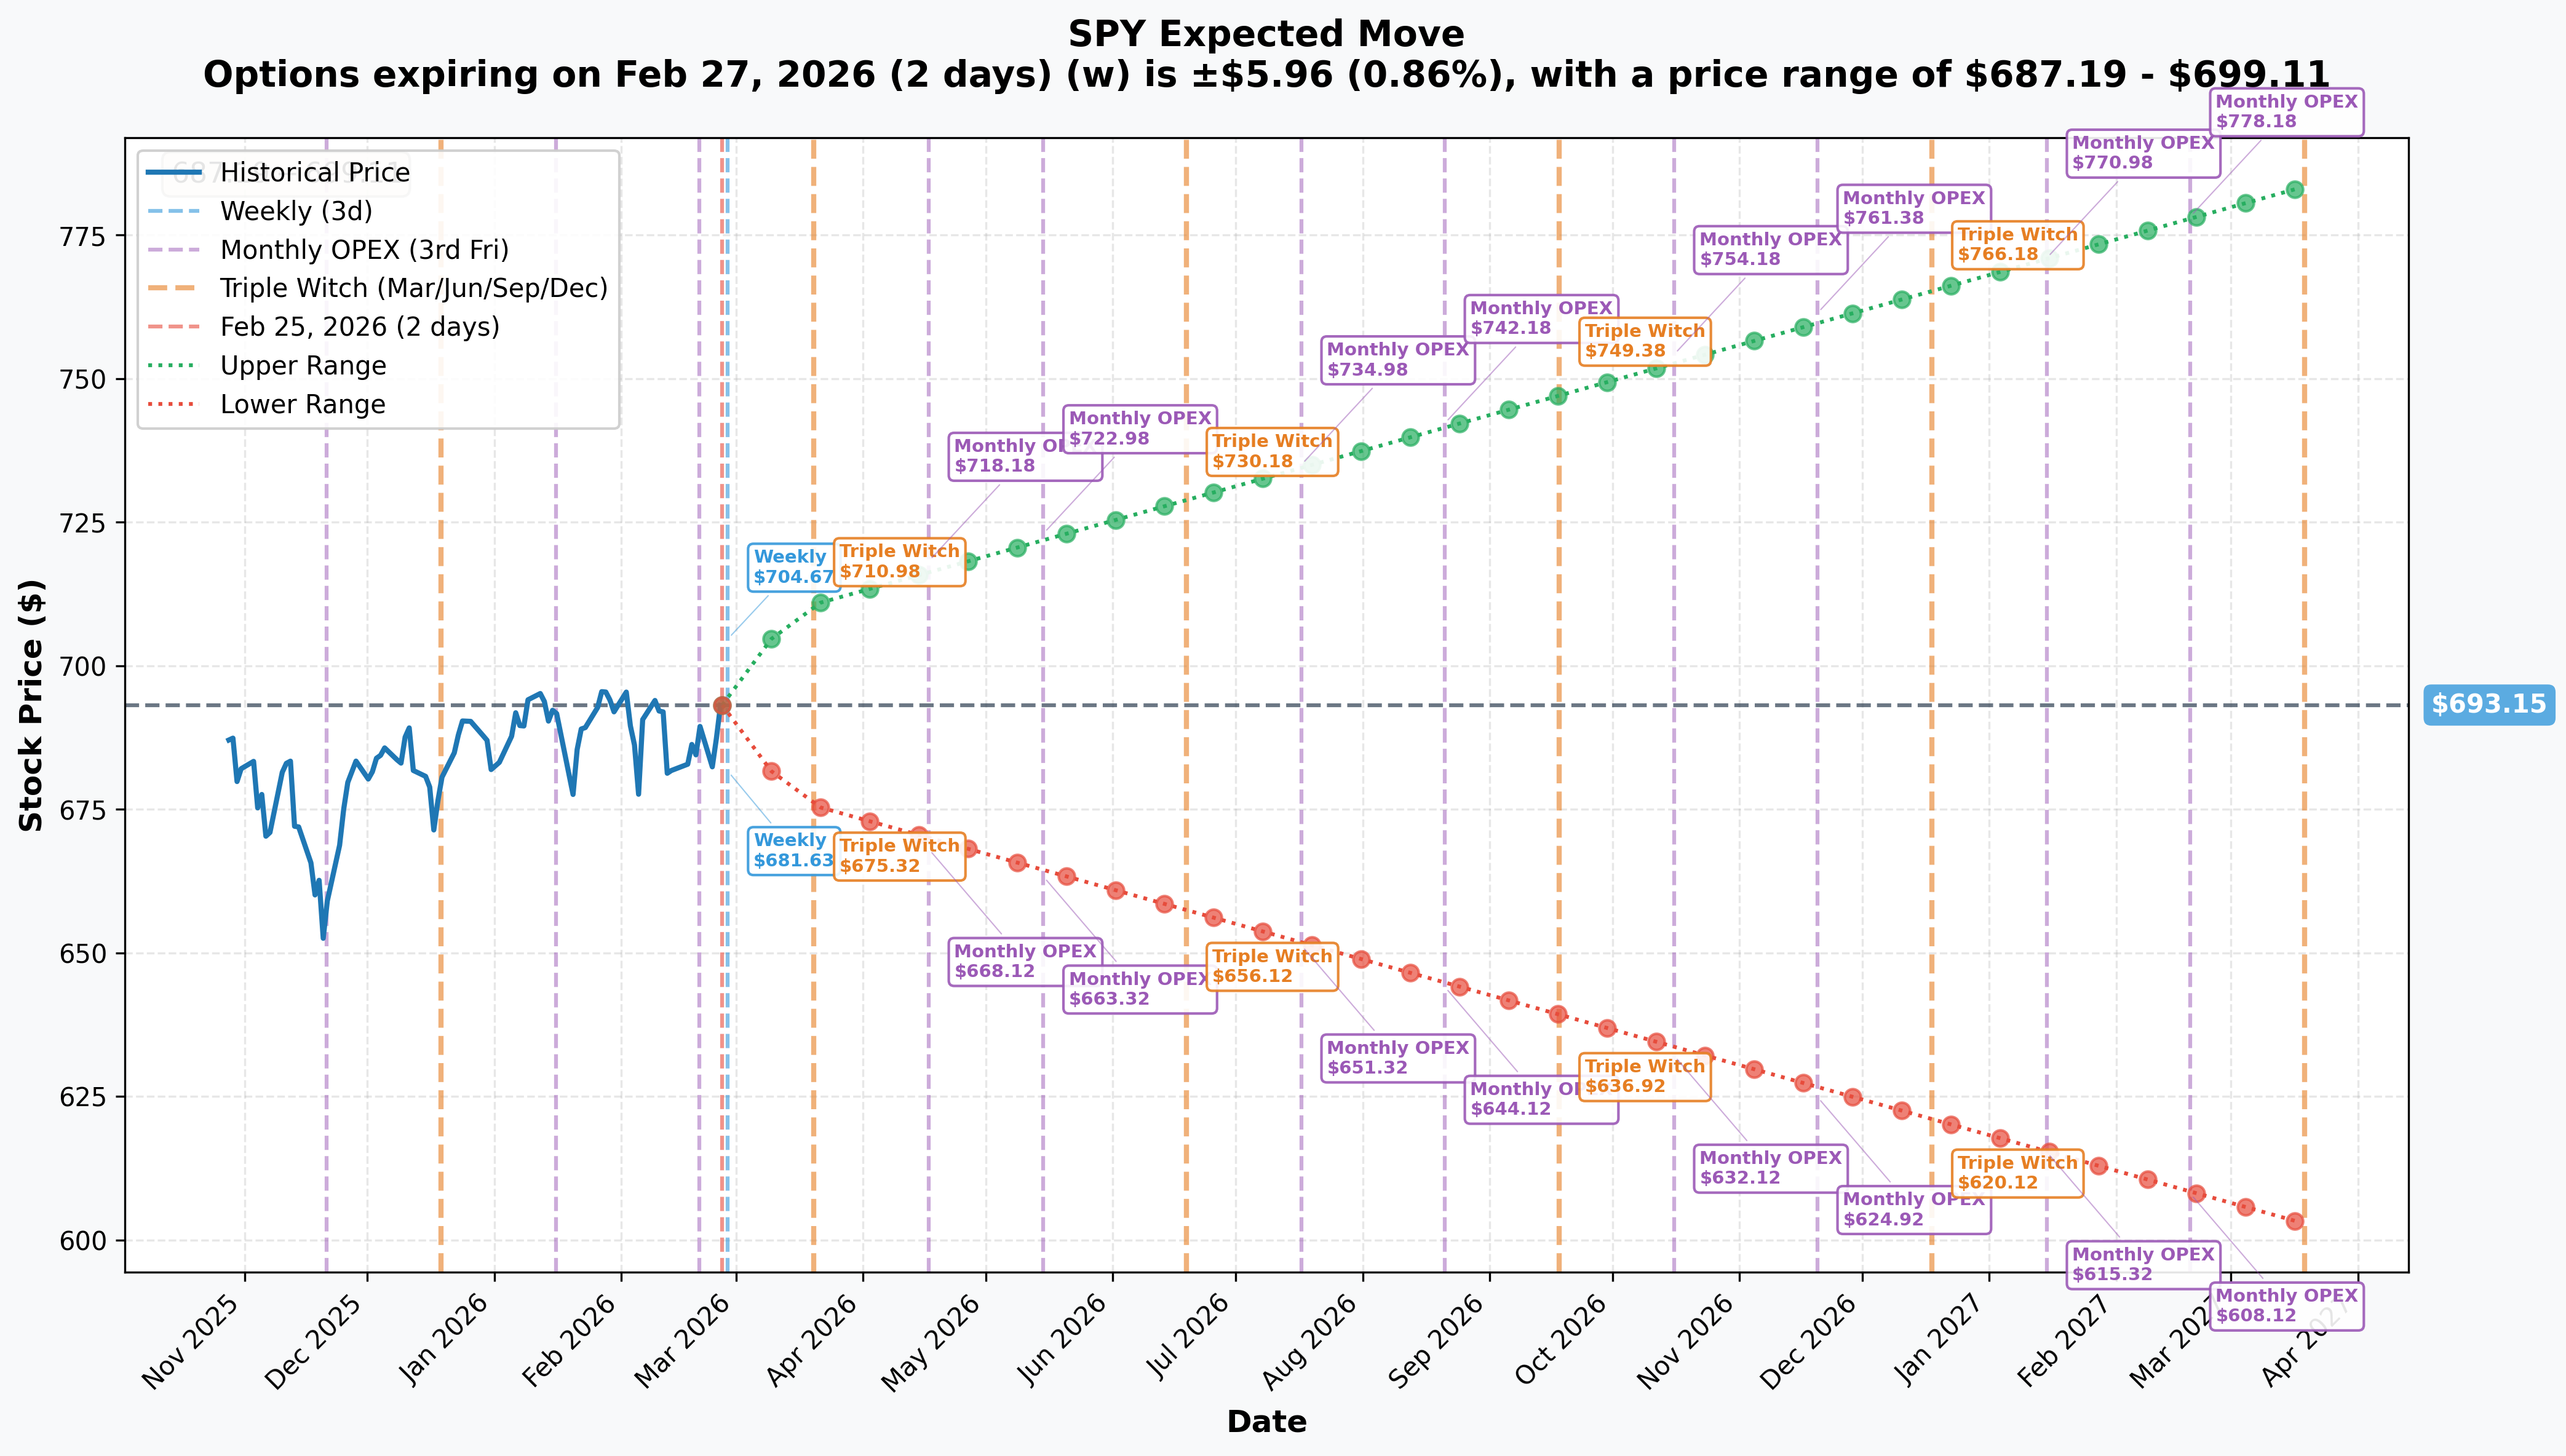
Options market pricing for upcoming expirations:
- 📅 Weekly (Feb 27 -- 2 days): ±$5.96 (±0.86%) --> Range: $687.19 - $699.11
- 📅 Monthly OPEX / Triple Witch (Mar 20 -- 23 days): ±$17.63 (±2.54%) --> Range: $675.52 - $710.78
- 📅 April 17 OPEX (THIS TRADE!): Range: $668.12 - $718.18 (±3.6%)
- 📅 Yearly LEAPs (Mar 2027): ±$90.43 (±13.05%) --> Range: $602.72 - $783.58
Translation:
The options market expects SPY to stay within about $668 to $718 through the April 17 expiration. Now look at where the whale placed their puts:
- 📊 $585 put = $83 below the implied lower bound ($668) -- 12.5% below expectations
- 📊 $575 put = $93 below the implied lower bound
- 📊 $535 put = $133 below the implied lower bound
- 📊 $525 put = $143 below the implied lower bound
- 📊 $485 put = $183 below the implied lower bound
- 📊 $475 put = $193 below the implied lower bound
These strikes are way outside the expected distribution. The market is pricing roughly a 1-3% probability of SPY reaching any of these levels by April 17. So why pay $39.5M for something that almost certainly expires worthless?
Because if the 1-3% scenario happens, these puts could be worth hundreds of millions. That is the entire point of tail risk hedging -- you pay a small premium relative to your portfolio to protect against catastrophic loss. If this institution manages a $10B+ equity portfolio, $15.3M in net premium is roughly 15 basis points -- a rounding error for insurance against a 2008- or 2020-style event.
🎪 Catalysts
🔥 Immediate Catalysts (This Week)
NVIDIA Q4 FY26 Earnings -- TONIGHT (February 25, After Close) 🚀
This is THE immediate trigger and arguably the single most impactful event for SPY in the near term. NVIDIA alone represents ~6-7% of the S&P 500 weight, making tonight's report a binary market event:
- 📊 Revenue consensus: $65.7B (+67% YoY); some estimates at $72B
- 💰 EPS consensus: $1.53 (+71.9% YoY)
- 🎯 Key watch: Gross margin guidance (previously ~75%), Blackwell chip ramp commentary, forward AI capex outlook
- ⚠️ Risk: Morgan Stanley expects $2B+ upside to guidance -- expectations are sky-high
- 💥 Impact: A guidance disappointment could easily knock 1.5-2.5% off SPY in a single session given NVDA's index weight
📅 Near-Term Catalysts (Next 2-4 Weeks)
Section 122 Tariff Escalation Risk -- Ongoing ⚖️
The biggest structural change in trade policy in decades:
- ⚖️ The Supreme Court ruled 6-3 that IEEPA does not authorize presidential tariffs on February 20, invalidating roughly half of all US customs duties
- 💰 Potential $165-175B in refund exposure from cumulative IEEPA tariff collections
- 🔄 The administration responded on February 24 with a 10% universal tariff under Section 122 of the Trade Act of 1974
- 📈 Escalation risk: Trump announced intent to raise to 15% -- the statutory maximum
- ⏰ Section 122 has a 150-day limit expiring ~late July 2026; legal challenges expected
March 6 -- February Jobs Report (NFP) 📊
January showed +130K jobs vs +75K consensus with unemployment at 4.3%. February data will reveal the initial impact of DOGE federal workforce reductions (~300K direct, up to ~1M total affected) and tariff uncertainty on hiring.
March 13 -- January PCE Inflation 📊
The Fed's preferred inflation gauge. December core PCE came in hot at 3.0% YoY -- well above the 2% target. Another hot print would slam the door on rate cut hopes for H1 2026.
March 17-18 -- FOMC Meeting 🏦
The market prices 94-96% probability of a hold at the current 3.50-3.75% rate. The updated Summary of Economic Projections (dot plot) and press conference will be critical for gauging whether the Fed still sees room for cuts in 2026.
April 17 -- Monthly OPEX (THIS TRADE EXPIRES) 📅
All seven legs of the put hedge settle on this date. Implied move range: $668.12 - $718.18.
✅ Recent Catalysts (Already Happened)
Supreme Court IEEPA Tariff Ruling -- February 20, 2026 ⚖️
A landmark 6-3 decision in Learning Resources Inc. v. Trump that struck down IEEPA-based tariffs. The administration immediately pivoted to Section 122 at 10%.
"Software-mageddon" -- Early February 2026 💻
Anthropic's "Claude Cowork" agentic AI release triggered an $800B+ selloff in the S&P 500 Software Index. Dan Ives (Wedbush) called the selloff a "generational buying opportunity" -- but the disruption threat is real.
Q4 2025 GDP Miss -- February 20, 2026 📉
GDP came in at just +1.4% annualized vs. 3.0% consensus -- a sharp slowdown from 4.4% in Q3. The government shutdown subtracted ~1.0pp, but even adjusting for that, the economy is clearly decelerating.
Q4 2025 Earnings Season -- Ongoing 📊
Blended EPS growth of +13.2% YoY vs. initial 8.3% estimate -- the 5th consecutive quarter of double-digit growth. Record net profit margin of 13.2%. The earnings picture remains solid, but forward guidance is where the risk lies.
Consumer Confidence Below Recession Threshold -- 13 Straight Months 😰
The Conference Board Expectations Index has been below 80 for 13 consecutive months. February's reading improved slightly to 72.0 but remains deeply in recession warning territory.
🎲 Price Targets & Probabilities
Using gamma levels, implied move data, Wall Street targets, and the catalyst calendar, here are the scenarios through the April 17, 2026 expiration (the timeframe of these trades):
📈 Bull Case (35% probability)
Target: $710-$730
How we get there:
- 🚀 NVIDIA crushes earnings tonight AND raises guidance -- reignites the AI trade and lifts SPY 1-2% by itself
- ⚖️ Section 122 tariffs stay at 10% (not escalated to 15%) and markets price in the 150-day expiration as manageable
- 📊 February jobs report strong, January PCE inflation cooperates (below 2.8% YoY) -- rate cut expectations move to June
- 🔄 "Great Rotation" broadens bull market participation -- breadth expansion is historically the healthiest kind of rally
- 📈 Breakout above $700 gamma resistance (326B) triggers momentum buying from systematic strategies
- 🎯 FOMC on March 17-18 confirms 1-2 cuts still on the table for 2026 with a dovish tone
- 💰 Wall Street consensus year-end target of ~$758 provides fundamental support; Oppenheimer targeting $810
Put trade P&L: All puts expire worthless. Loss = -$15.3M net premium (100%)
This is actually the EXPECTED outcome for these trades. You do not buy fire insurance hoping your house burns down. The institution would happily lose $15.3M because their equity portfolio would be worth billions more in this scenario.
🎯 Base Case (45% probability)
Target: $675-$700 (Range-Bound Consolidation)
Most likely scenario:
- ✅ NVIDIA meets but does not materially beat expectations -- muted market reaction
- 📊 Economic data comes in mixed: jobs okay, inflation sticky at 2.5-3.0%, GDP soft but not recessionary
- ⚖️ FOMC holds at March meeting, signals patience -- no immediate catalyst for breakout
- 🔄 Sector rotation continues beneath the surface -- SPY goes sideways while sectors churn
- 📈 Gamma range of $690-$700 holds for weeks, with occasional tests of $680-$685
- 💤 VIX gradually normalizes from 21 back toward 16-18 as tariff clarity emerges
Put trade P&L: All puts expire worthless. Loss = -$15.3M net premium (100%)
Same outcome as the bull case -- the insurance is not needed. The institution's equity portfolio holds value, and the $15.3M is the cost of sleeping well at night. That is about 0.15% of a $10B portfolio -- cheaper than most homeowner's insurance policies.
📉 Bear Case (15% probability)
Target: $640-$670 (Correction)
What could go wrong:
- 😰 NVIDIA misses or guides weak -- 6-7% of S&P 500 weight gaps down 10-15%, pulling SPY -1.5-2.5% overnight
- 🌍 Tariffs escalate to 15% with retaliatory measures from the EU, China, and other trading partners -- trade war fears roar back
- 📉 GDP slowdown deepens toward sub-1%; Q1 2026 data confirms deceleration
- 🔥 Core PCE inflation re-accelerates above 3.0% -- rate cuts fully priced OUT for 2026
- 💻 "Software-mageddon Phase 2" spreads beyond SaaS into financial services and consulting
- 😰 Consumer Expectations Index below 80 for 13+ months finally manifests in actual spending pullback
- 🔨 Break below $690 gamma support (473B) triggers cascade through $680, $675, and $668 (implied move lower bound)
Put trade P&L: Puts still far OTM at $640-$670. Most expire worthless. Loss = -$15.3M (100%)
Even in a meaningful 5-8% correction, these deep OTM puts do not pay off. This is designed for true tail events, not normal market volatility.
💀 Tail Risk / Black Swan Case (< 5% probability)
Target: $475-$585 (THE PAYOUT ZONE)
The nightmare scenario this hedge is built for:
- 🚨 Multiple catalysts cascade simultaneously: NVIDIA miss + tariff escalation + credit event + geopolitical shock
- 📉 Market enters a March 2020-style crash: -15% to -30% in weeks
- 🏦 Credit markets seize; recession officially declared; earnings estimates slashed 20%+
- 📉 VIX explodes above 40; all gamma support levels fail in sequence
Put trade P&L at $535:
- Block 1 bear put spread: worth ~$50/share x 100,000 contracts = $500M
- Block 2 butterfly: near max profit at $525 center = $50/share x 75,000 contracts = $375M
- Total potential payout: $500M-$800M+ on $15.3M invested
This is the scenario where a 30:1 to 50:1 payoff ratio turns $15.3M into hundreds of millions. The institution's equity portfolio would be down billions, but the put hedge recovers a meaningful portion of those losses. That is the entire point of portfolio insurance.
💡 Trading Ideas
🛡️ Conservative: "Sleep Well at Night" -- Protective Put Spread
Play: Buy SPY April 17 $680 puts, sell April 17 $660 puts
Structure: $680/$660 bear put spread -- much closer to the money than the whale's trade, targeting a realistic correction
Why this works:
- 📊 $680 is just 1.87% below current price -- right at a key gamma support level (185B)
- 🛡️ Defined risk: you lose only the net debit paid (roughly $3-4 per spread, or $300-400)
- 💰 Max profit: $20 per spread minus debit ($16-17 gain) if SPY closes below $660
- ⏰ April 17 expiration captures all major catalysts: NVIDIA follow-through, jobs, PCE, FOMC, tariff developments
- 📈 Risk/reward: roughly 4:1 -- risk $350 to make $1,650 at max
- 📊 Protection starts at a realistic level where gamma support exists, not 30% below the market
Position sizing: 10-20 spreads at ~$3.50 each = $3,500-$7,000 max risk for $16,500-$34,000 max profit. Spend no more than 1% of your portfolio on this insurance.
Risk level: Moderate (defined risk, hedging) | Skill level: Intermediate
⚖️ Balanced: "The Butterfly Net" -- Put Butterfly
Play: Buy 1x SPY April 17 $670 put, sell 2x $650 puts, buy 1x $630 put
Structure: $670/$650/$630 put butterfly -- same structure as the whale's Block 2, but at strikes that are actually reachable in a normal correction
Why this works:
- 🦋 Max profit at $650 (a -6.2% decline from current levels) -- meaningful correction, not a crash
- 💸 Very capital-efficient: butterfly costs roughly $1.50-$2.50 per spread ($150-250)
- 📊 Risk/reward roughly 8:1 if SPY settles near $650
- 🎯 Payout range of $630-$670 captures a realistic correction scenario driven by tariff escalation or FOMC hawkishness
- ⏰ Same April 17 expiration aligns with the institutional positioning
- 🛡️ If March FOMC turns hawkish or tariffs escalate to 15%, a 5-6% pullback is well within historical norms
Position sizing: 20-50 spreads at ~$2 each = $4,000-$10,000 risk for up to $80,000 max profit.
Risk level: Moderate (defined risk, needs precision) | Skill level: Intermediate-Advanced
🚀 Aggressive: "Volatility Pop" -- VIX Calls
Play: Buy VIX March $25 calls to profit from a spike in market fear
Why this works (and why it is risky):
- 💥 VIX already at 21+ (2026 peak) -- but if NVIDIA misses tonight and tariffs escalate to 15%, VIX could spike to 30+
- 📊 A VIX spike from 21 to 30 would roughly double the value of $25 VIX calls
- 🎢 VIX futures in backwardation (22.55-22.79) signals the market is already pricing near-term risk -- but a true shock could push it much higher
- ⏰ Short-dated for maximum gamma -- you get the biggest bang for your buck on a volatility spike
Why it could blow up:
- 💸 VIX is already elevated at 21 -- you are buying high
- ⏰ VIX has a strong mean-reverting tendency -- it could easily drop back to 17-18 if NVIDIA delivers and tariff fears ease
- 📉 Time decay on VIX options is brutal -- if the move does not happen quickly, you lose
- ⚠️ VIX options settle to VIX futures, not spot VIX -- make sure you understand the settlement mechanics
Position sizing: Risk ONLY what you can afford to lose completely. 10 VIX March $25 calls at ~$1.50 each = $1,500 at risk. Potentially worth $5,000+ if VIX hits 30.
Risk level: HIGH (can lose 100% of premium) | Skill level: Advanced
⚠️ Risk Factors
Don't ignore these warning signs:
-
📉 These puts will almost certainly expire worthless. Let's be real: the whale's strikes are -15% to -31% OTM with only 51 days to expiration. The implied probability of SPY reaching $585 by April 17 is under 3%. This is insurance, not an alpha trade. Do not blindly copy these strikes thinking the institution "knows something" about a crash. They are hedging, not predicting.
-
🌍 Tariff policy remains the single biggest macro wildcard. The Section 122 framework is legally untested, could be escalated to 15%, and faces certain legal challenges. The $165-175B in potential IEEPA tariff refunds adds fiscal uncertainty. Each tariff headline can swing SPY 0.5-1% in minutes.
-
🏦 The Fed is stuck between a rock and a hard place. Core PCE at 3.0% is too hot to cut rates, while GDP at 1.4% is too cold to hike. This policy paralysis means the Fed cannot ride to the rescue if things deteriorate -- and new tariffs could make inflation even stickier.
-
💻 NVIDIA tonight is a binary event for the entire index. With ~6-7% S&P 500 weight, a miss or weak guidance could single-handedly knock 1.5-2.5% off SPY in one session. Expectations are extremely elevated with consensus at $65.7B revenue. Even a beat-and-lower-guidance scenario could trigger selling.
-
😰 Consumer confidence has been flashing recession signals for over a year. The Expectations Index below 80 for 13 consecutive months has historically preceded recessions. At some point, pessimism becomes self-fulfilling through reduced spending and hiring.
-
📊 Mag 7 concentration risk is extreme. The Magnificent 7 represents ~35-40% of the S&P 500. If the rotation away from mega-caps accelerates, SPY could underperform even as most stocks are doing fine. A broad tech selloff -- whether from AI disappointment, tariffs on chips, or valuation compression -- drags the cap-weighted index disproportionately.
-
📉 "Software-mageddon" may not be over. The $800B+ SaaS selloff was triggered by a single AI agent release. If AI disruption spreads beyond SaaS to financial services, consulting, or legal sectors, the next wave could be larger.
-
📊 Put/call ratios are already extreme. SPY's OI put/call ratio sits at 2.09 -- well above normal. Elevated hedging demand makes puts expensive. Contrarian traders would note that extreme put buying has historically been a near-term bottom signal -- but this time the macro backdrop may genuinely warrant the caution.
🎯 The Bottom Line
Here's the deal: Someone managing a very large equity portfolio just spent $39.5M ($15.3M net) building layered crash insurance on SPY. This is NOT a prediction that the market is about to crash. This is the financial equivalent of buying earthquake insurance when you start feeling tremors.
What these trades tell us:
- 🎯 An institution with likely $5-10B+ in equity exposure is nervous enough to spend $15.3M net on tail protection covering -15% to -31% drawdowns
- 📊 They structured across multiple strikes ($475 to $585) and two distinct strategies (bear put spread + butterfly) covering different severity scenarios -- from a bad correction to a full-blown crash
- ⏰ April 17 expiration captures every major catalyst: NVIDIA tonight, FOMC March 17-18, jobs March 6, PCE March 13, tariff escalation risk, and Q1 earnings season
- 🤝 Two separate blocks executed 3 hours apart with MID fills confirm deliberate, pre-planned institutional hedging -- not panic
- 💰 At ~0.15% of the estimated portfolio value, the net cost is a rounding error for the protection received
The tremors are real:
- VIX at its 2026 peak above 21
- Tariff regime in legal chaos after the Supreme Court ruling
- GDP slowing to 1.4%
- Consumer confidence in recession territory for 13 months
- $800B+ wiped from software stocks on AI disruption
- Sector rotation at a 30-year extreme
None of these individually cause a crash. But stacked together, the macro fragility is exactly why institutions are buying protection at this scale.
If you own SPY or have significant S&P 500 exposure:
- ✅ Consider adding modest put protection (0.5-1% of portfolio) through April 17 to cover the catalyst-dense period
- 📊 Watch $690 as the critical gamma support level -- a close below $690 would be the first sign of trouble
- 🎯 The $700 resistance level is the upside gate -- a convincing breakout above $700 signals the all-clear
- ⏰ Tonight's NVIDIA earnings are the immediate swing factor -- wait for the reaction before making major portfolio decisions
If you are watching from the sidelines:
- 👀 This is NOT a signal to panic-sell or go short -- the puts are insurance, not a directional bet
- 📊 SPY near all-time highs with improving breadth (65% of stocks outperforming) is actually a healthy long-term setup
- 🎯 Consensus year-end S&P 500 target of
7,580 ($758) implies ~10% upside from here - ⏰ Best approach: wait for NVIDIA reaction, then the March 17-18 FOMC for clarity on rate path and tariff impact
If you are bearish:
- 📊 The institutions paid $39.5M because they see the same risks you do -- but they still own the underlying stocks
- 🎯 Put spreads in the $680/$665 zone offer the best risk/reward for betting on a correction without overpaying for crash puts
- ⚠️ Shorting SPY near all-time highs is dangerous -- use defined-risk structures only
- 🔄 The rotation trade (long RSP / short SPY) captures relative underperformance without needing a crash
Key dates to mark:
- 📅 February 25 (TONIGHT) -- NVIDIA Q4 FY26 earnings after close -- single biggest near-term catalyst
- 📅 March 6 -- February jobs report (NFP) -- DOGE layoff impact first visible here
- 📅 March 13 -- January PCE inflation -- will the Fed's preferred measure cool or stay sticky?
- 📅 March 17-18 -- FOMC meeting with dot plot and press conference -- rate path clarity
- 📅 March 20 -- Triple Witch / Monthly OPEX (implied range: $675-$711)
- 📅 April 17 -- THIS TRADE EXPIRES -- moment of truth for the $39.5M put hedge
- 📅 ~Late July -- Section 122 tariff 150-day expiration -- renewal or expiration decision
Final thought: When someone spends $39.5M on crash protection, it does not mean a crash is coming. It means the person managing $7-10 billion in stocks has done the math and decided that 15 basis points is a reasonable price for sleeping at night. The question for you is: can you afford NOT to have any protection at all during the most uncertain macro environment since 2020?
The whale paid $15.3M to sleep well tonight. Figure out what your number is -- and pay it. 💪
Disclaimer: Options trading involves substantial risk of loss and is not suitable for all investors. This analysis is for educational purposes only and not financial advice. Past performance does not guarantee future results. The trades described involve institutional-scale positions (100,000+ contracts) that are not replicable by retail traders. SPY options are highly liquid but deep out-of-the-money puts can still have wide bid-ask spreads. Tail risk hedges are expected to expire worthless the vast majority of the time -- that is their nature. Always do your own research and consider consulting a licensed financial advisor before trading.
About SPDR S&P 500 ETF Trust (SPY): The largest and most liquid equity ETF in the world, tracking the S&P 500 Index with over $707B in assets under management. Managed by State Street Global Advisors. SPY is the benchmark vehicle for broad US large-cap equity exposure, serving as the primary hedging instrument for institutional portfolio managers worldwide.