🐻 SPY $36M Bear Put Spread -- Institutional Money Betting on a Drop Below $675 by March 13!
📅 March 2, 2026 | 🔥 Unusual Activity Detected
🎯 The Quick Take
Someone just dropped $36.5M across 6 simultaneous put legs on SPY at 11:10:48 AM today -- constructing a massive bear put spread funded by selling tomorrow's expiring puts. This is a complex, multi-leg institutional structure: ~44,500 contracts of the Mar 13 $675/$660 bear put spread, financed by dumping 0DTE $675 puts expiring tomorrow. Net debit: roughly $7.8M for a structure that prints if SPY drops from $685 to below $675 in the next 11 days. With Iran conflict rattling markets, CPI on March 11, and FOMC on March 17-18, this trader is positioning for turbulence ahead.
📊 ETF Overview
SPDR S&P 500 ETF Trust (SPY) is the largest and most liquid ETF in the world, tracking the S&P 500 Index:
- 💰 AUM: $698.27B -- the benchmark ETF for U.S. equities
- 📊 Tracks: S&P 500 Index ($62.37T total market cap)
- 📈 Current Price: $685.41 (spot at time of trade)
- 🔢 Forward P/E: 22.2x (above 5-yr avg of 20.0x and 10-yr avg of 18.7x)
- 📉 YTD Return: +0.9% (cap-weighted) vs +6.7% (equal-weight RSP) -- the "Great Rotation" in action
💰 The Option Flow Breakdown
📊 What Just Happened
The Tape (March 2, 2026 @ 11:10:48) -- 6 Simultaneous Legs:
| Time | Symbol | Side | Buy/Sell | Type | Expiration | Premium | Strike | Volume | OI | Size | Spot | Option Price |
|---|---|---|---|---|---|---|---|---|---|---|---|---|
| 11:10:48 | SPY | BID | SELL | PUT | 2026-03-13 | $6.9M | $660 | 28K | 7.5K | 25,643 | $685.41 | $2.71 |
| 11:10:48 | SPY | BID | SELL | PUT | 2026-03-03 | $1.7M | $675 | 104K | 117K | 25,643 | $685.41 | $0.65 |
| 11:10:48 | SPY | ASK | BUY | PUT | 2026-03-13 | $13M | $675 | 27K | 11K | 25,643 | $685.41 | $5.15 |
| 11:10:48 | SPY | BID | SELL | PUT | 2026-03-13 | $5.1M | $660 | 49K | 7.5K | 18,860 | $685.41 | $2.72 |
| 11:10:48 | SPY | ABOVE ASK | BUY | PUT | 2026-03-13 | $9.7M | $675 | 48K | 11K | 18,860 | $685.41 | $5.16 |
| 11:10:48 | SPY | BID | SELL | PUT | 2026-03-03 | $1.2M | $675 | 125K | 117K | 18,860 | $685.41 | $0.65 |
🤓 What This Actually Means
This is a complex multi-leg institutional bear put spread with 0DTE financing. Let's break it down piece by piece:
Block 1 (25,643 contracts):
- 🔴 SELL Mar 13 $660 Put @ $2.71 (STO -- opening a new short) = $6.9M collected
- 🔴 SELL Mar 3 $675 Put @ $0.65 (STC -- closing an existing short) = $1.7M collected
- 🟢 BUY Mar 13 $675 Put @ $5.15 (BTO -- opening a new long) = $13M spent
Block 2 (18,860 contracts):
- 🔴 SELL Mar 13 $660 Put @ $2.72 (STO -- opening a new short) = $5.1M collected
- 🟢 BUY Mar 13 $675 Put @ $5.16 (BTO -- ABOVE ASK, very aggressive!) = $9.7M spent
- 🔴 SELL Mar 3 $675 Put @ $0.65 (STC -- closing an existing short) = $1.2M collected
The combined structure:
- 📈 ~44,500 contracts of Mar 13 $675 puts BOUGHT for ~$22.7M total
- 📉 ~44,500 contracts of Mar 13 $660 puts SOLD for ~$12M total
- 💰 ~44,500 contracts of 0DTE Mar 3 $675 puts SOLD for ~$2.9M collected (closing existing positions)
- 💵 Net debit: ~$7.8M for a $15-wide bear put spread
Translation for regular folks: This trader is betting SPY drops from $685 to below $675 by March 13. They're using a spread to cap risk (max loss is the $7.8M debit if SPY stays above $675) and max profit potential is about $59M if SPY drops to $660 or below. The 0DTE puts being sold to close suggest they had existing short put exposure from a prior position and are rolling that bearish view into a new, defined-risk structure.
How aggressive was this? The second block's Mar 13 $675 put was bought ABOVE ASK -- meaning the trader paid more than the listed asking price to guarantee a fill. When you see someone paying above ask on nearly 19,000 contracts, that's urgency. They wanted this position NOW.
Z-Score: 🔥 EXTREMELY UNUSUAL across all legs (z-scores ranging from 3.1 to 39.0). The Mar 13 $660 put leg hit a z-score of 39.0 -- that's a level of activity that happens maybe a few times a year at most. This is clearly institutional-scale positioning.
📈 Technical Setup / Chart Check-Up
YTD Performance Chart
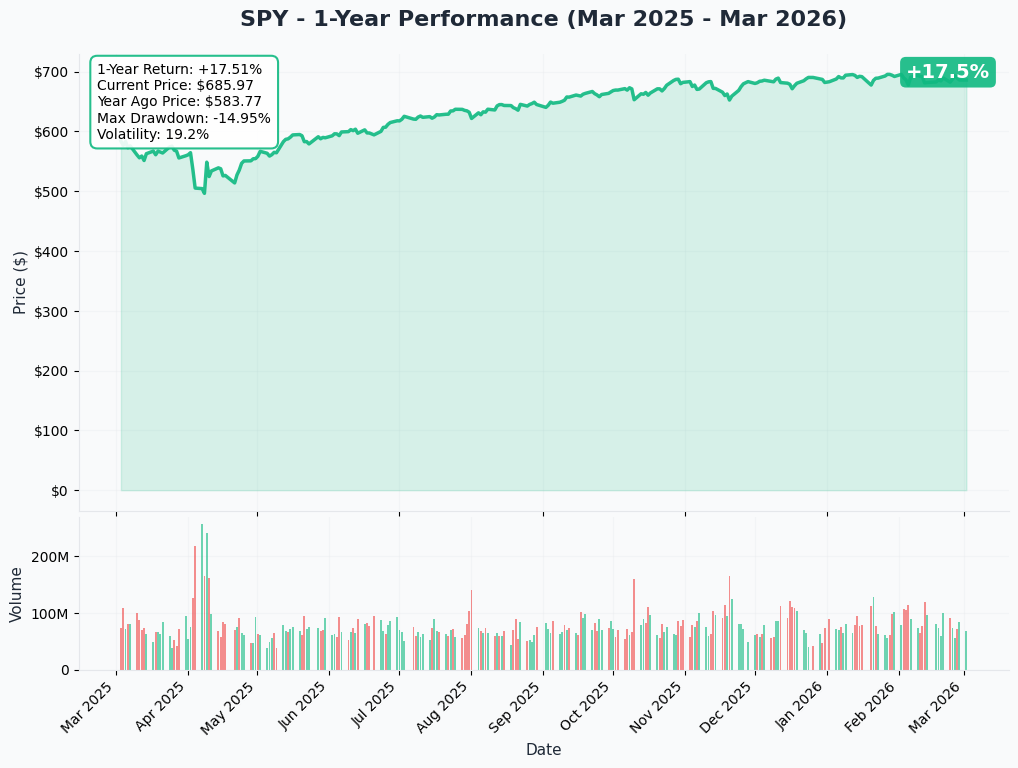
SPY is up +17.5% over the past year with a current price of $685.97. But the recent picture is much more nuanced than that headline number suggests.
Key observations:
- 📈 1-Year Return: +17.5% (from $583.77 to $685.97)
- 📉 Max Drawdown: -14.95% -- that April 2025 tariff-driven selloff was brutal
- 🎢 Annualized Volatility: 19.2%
- 📊 YTD 2026: Essentially flat at +0.9%, despite the average S&P 500 stock being up +7% (the "Great Rotation")
- 🏔️ Near 52-week highs: The $697 area has been a ceiling; SPY has been stuck in a historically narrow 2.65% range for the first two months of 2026
The narrowest trading range on record in Jan-Feb has set up conditions where a shock event gets amplified -- and this weekend's Iran conflict may be exactly that catalyst.
Gamma-Based Support & Resistance Analysis
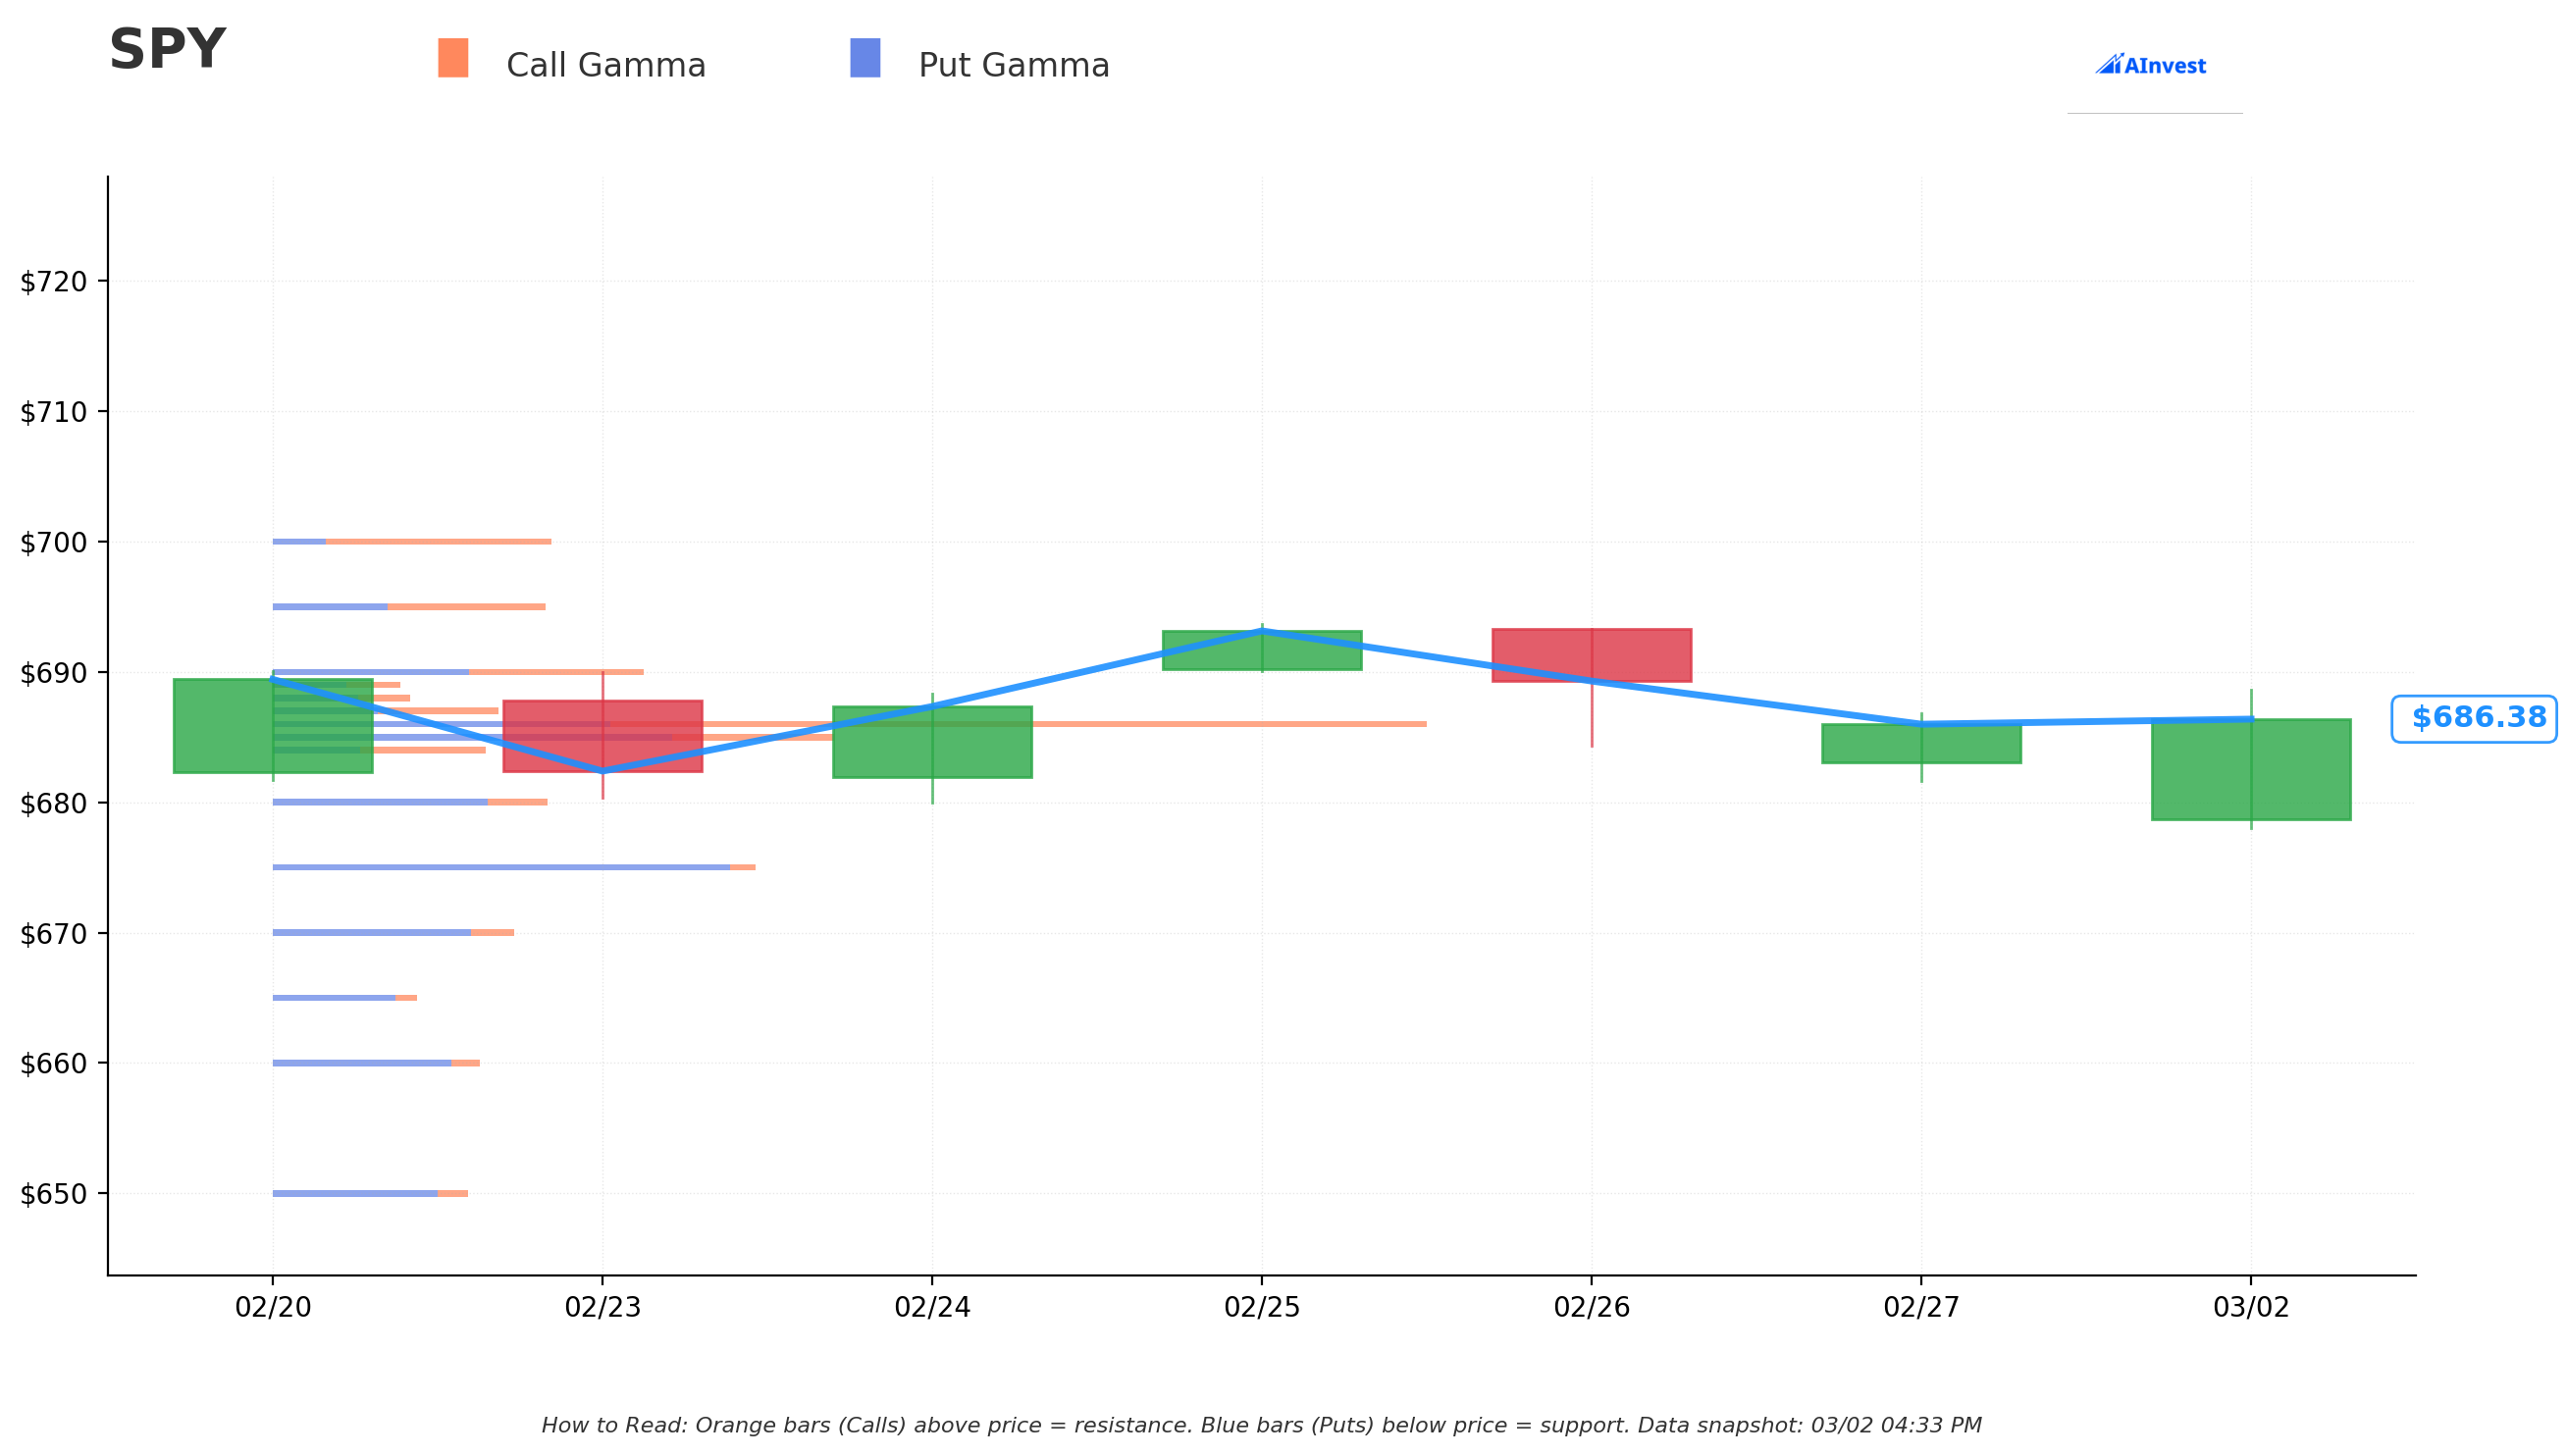
Current Price: $686.38
The gamma exposure chart shows the interplay between call gamma (orange bars = resistance above price) and put gamma (blue bars = support below price) over recent sessions.
🟠 Resistance Levels (Call Gamma Above Price):
- $690 -- Immediate overhead resistance; call gamma has been building here
- $693-$695 -- Secondary resistance band visible in recent sessions
- $700 -- Major psychological and gamma resistance level
🔵 Support Levels (Put Gamma Below Price):
- $680 -- First meaningful support zone; put gamma visible
- $675 -- Key put gamma level (this is exactly where the bear put spread targets!)
- $670 -- Secondary support
- $660-$665 -- Deep support zone with put gamma extending lower
What this means for traders: The gamma chart is telling us SPY is in a tight zone between $680 support and $690 resistance. Market makers hedging their positions will sell into rallies above $690 and buy dips near $680, keeping price contained -- unless a major catalyst breaks the range. The negative gamma environment (SPY put/call OI ratio at 2.17) means that once support breaks, dealer hedging will amplify the move lower. That's exactly the setup this bear put spread trader is betting on.
Implied Move Analysis
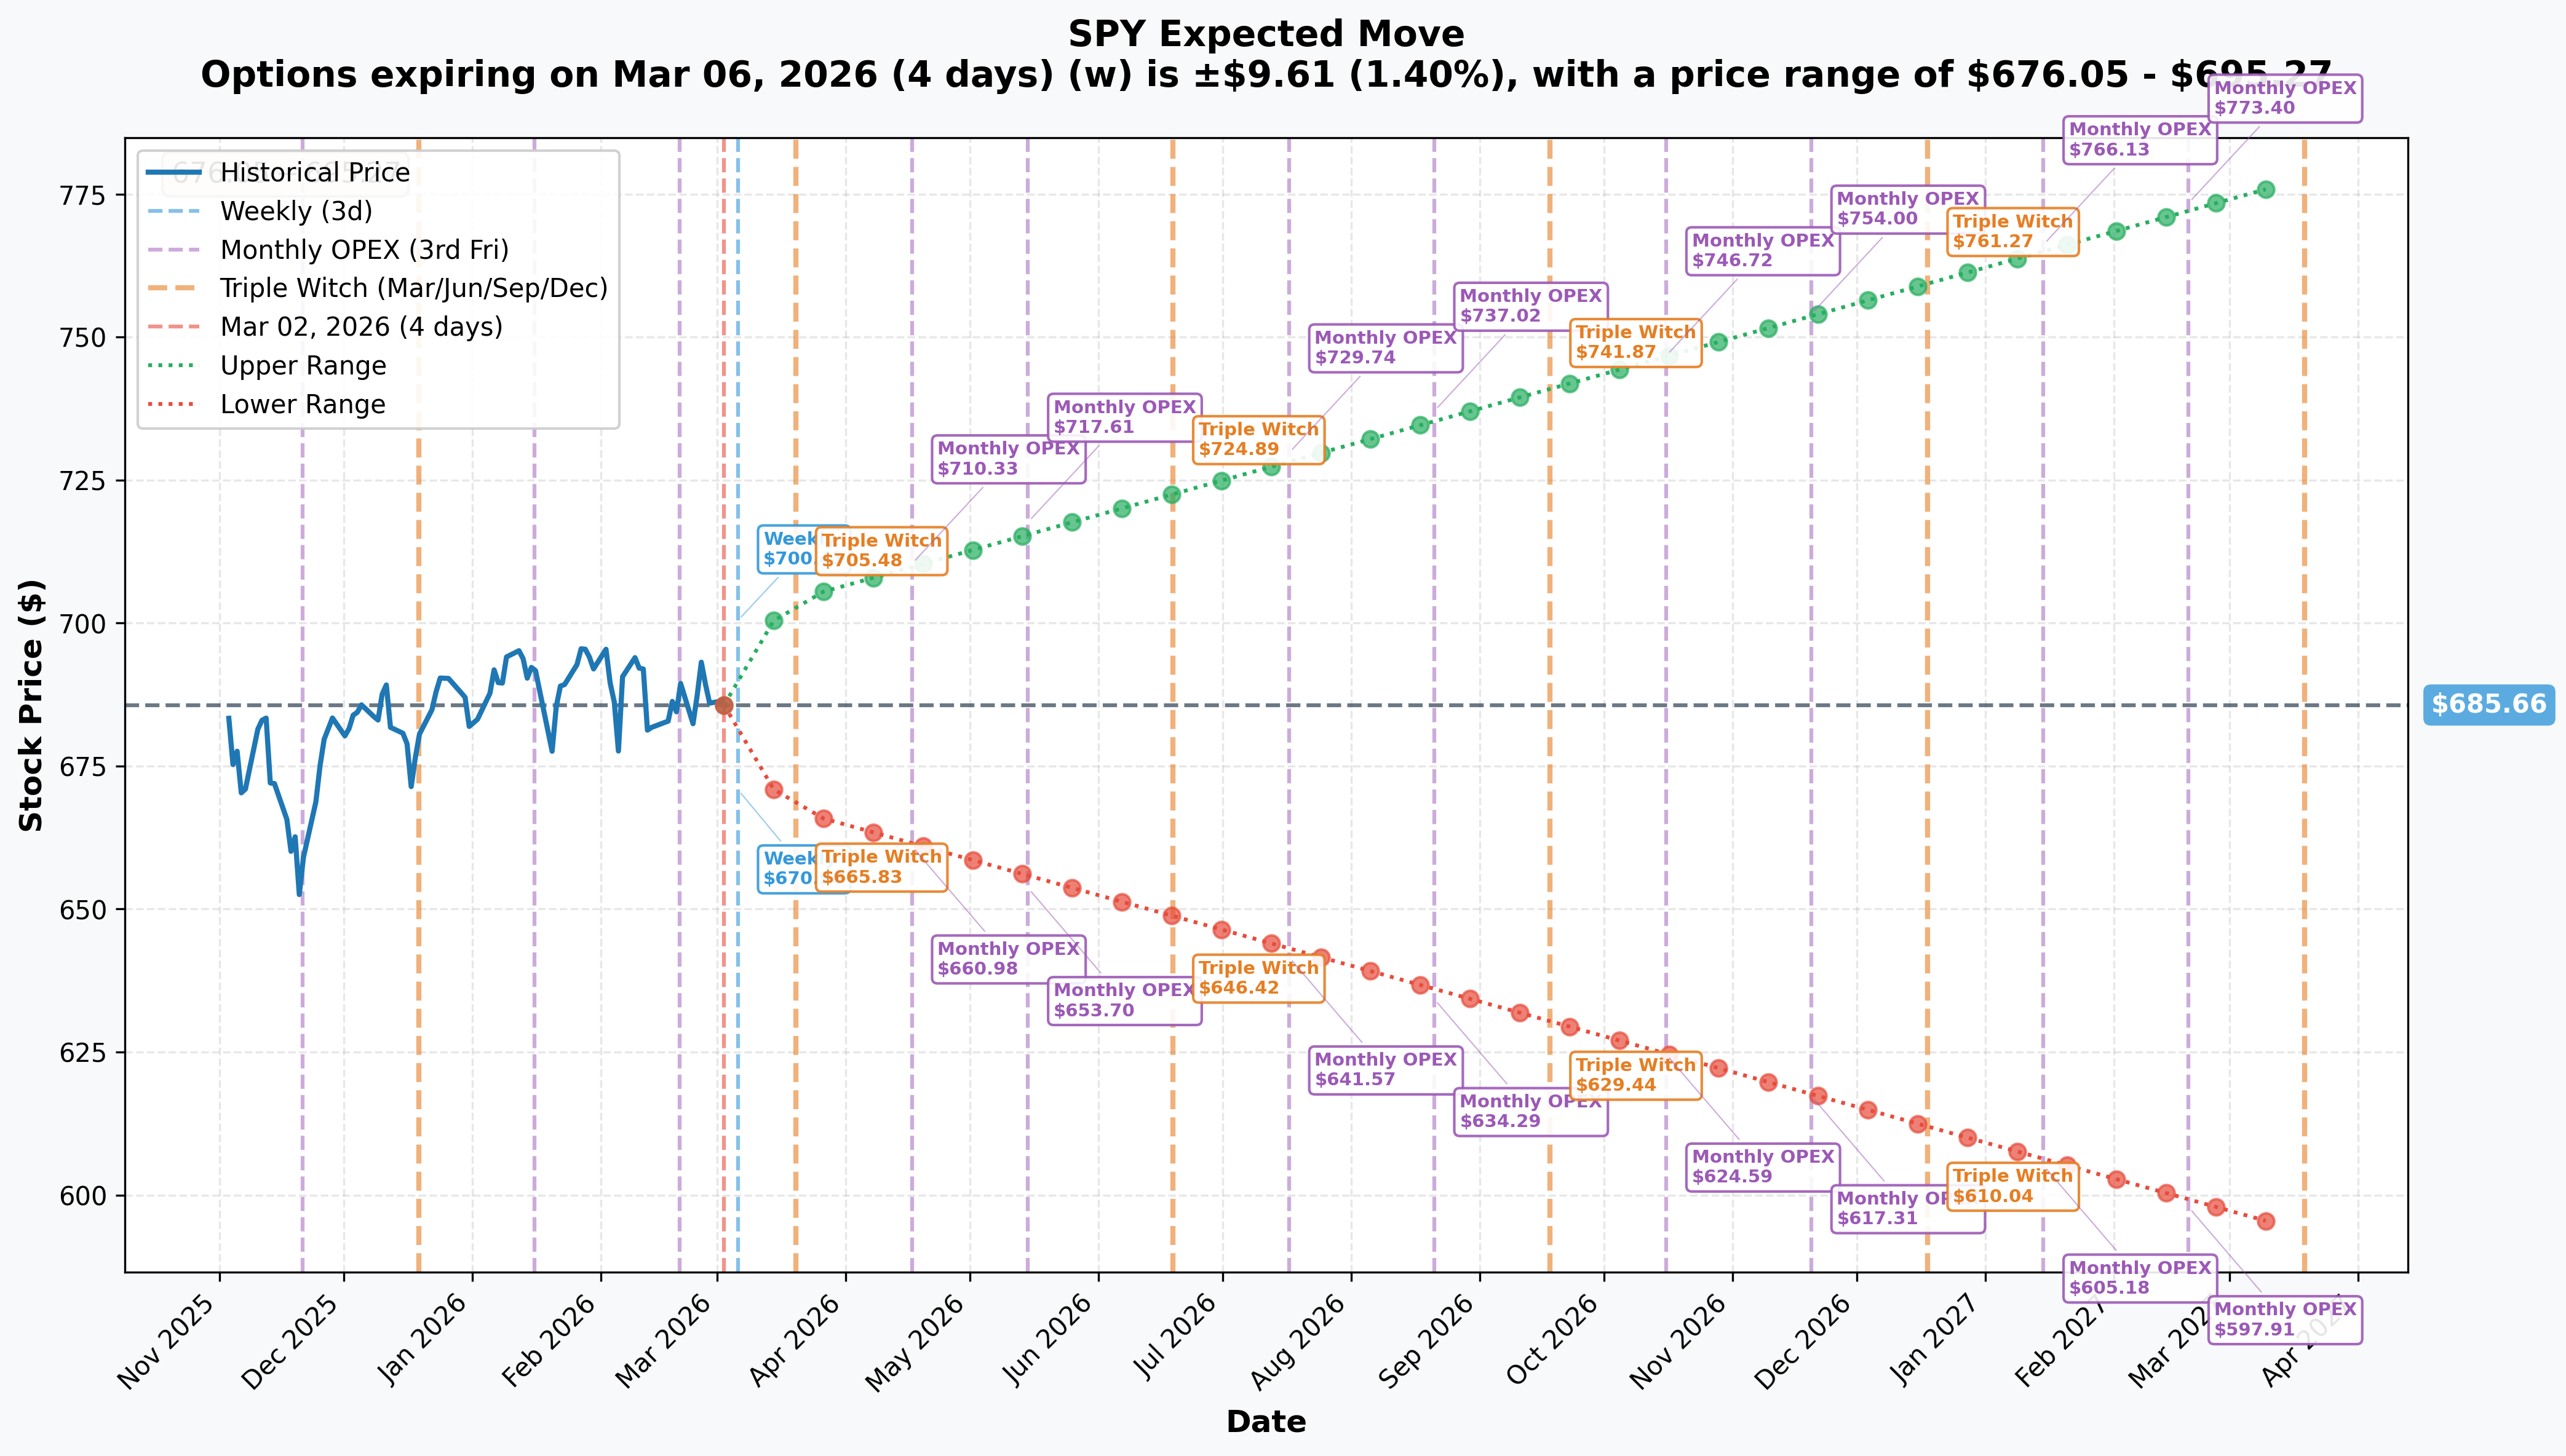
Options market pricing for upcoming expirations:
- 📅 Weekly (Mar 6 -- 4 days): +/-$9.61 (+/-1.40%) --> Range: $676.05 - $695.27
- 📅 Monthly OPEX / Triple Witch (Mar 20 -- 18 days): +/-$18.61 (+/-2.71%) --> Range: $667.04 - $704.27
- 📅 LEAPS (Mar 2027 -- 382 days): +/-$92.20 (+/-13.45%) --> Range: $593.46 - $777.85
Translation for regular folks: The options market is pricing in a 1.4% move ($9.61) by Friday and a 2.7% move ($18.61) through the March 20 triple witch expiration. That weekly implied move puts the lower bound at $676 -- very close to the $675 strike targeted by today's bear put spread. The market is saying there's a realistic probability of testing that level within days.
The Mar 13 expiration (when this trade settles) falls between the weekly and monthly timeframes. A move to $675 represents only a 1.5% decline from current levels -- well within the implied move range. This isn't a wild bet; it's a calculated position within the market's own expectations.
🎪 Catalysts
🔥 Immediate Catalysts (This Week and Next)
Iran Conflict -- U.S./Israel Strikes Over the Weekend (Mar 1-2) 💥
This is the biggest near-term risk for markets right now. U.S. and Israel struck Iran over the weekend, killing the Supreme Leader. Iran retaliated by striking Gulf neighbors and threatening Strait of Hormuz closure:
- 🛢️ Oil surging: WTI +8.4% to $72.74, Brent +9% to $79.45, with analysts seeing $85-90 possible
- ⛽ Strait of Hormuz: De facto closure via insurance withdrawal -- ~20% of global oil supply at risk
- 📉 Market reaction Mar 2: Dow opened down ~600 points before dip-buyers emerged; VIX spiked to 24.66 open, range 20.37-25.24
- ⚠️ Key risk: Sustained oil above $90 historically triggers recession fears (Oxford Economics)
February Jobs Report -- March 6 (Friday) 📊
Nonfarm payrolls release is the next major data point. January came in at +130K (beat the 70K estimate). A weak number could accelerate the selloff; a strong number could raise "Fed stays higher for longer" fears. Either way, it's a volatility catalyst.
February CPI -- March 11 (Tuesday) 🔥
This one matters enormously for the bear put spread's Mar 13 expiration. Consensus: headline +0.3% m/m, 2.5% YoY; core +0.3% m/m, 2.5% YoY. A hot print -- especially with oil surging from Iran -- could push inflation fears back to the forefront just 2 days before the trade expires. This is likely the specific catalyst the trader is positioning around.
📅 Near-Term Catalysts (March 2026)
FOMC Meeting -- March 17-18 🏛️
The Fed is expected to hold at 3.50-3.75% with near-zero probability of a cut. But the statement language around tariffs, Iran-driven oil inflation, and the growth outlook will set the tone for Q2. The first potential rate cut isn't priced until June.
EU Trade Deal Reassessment -- March 4 🌍
EU lawmakers reconvene to reassess trade commitments after the Supreme Court's IEEPA tariff ruling struck down country-specific tariffs. The new Section 122 tariffs (10% global, rising to 15%) add policy uncertainty.
📆 Already Happened (Background Context)
Supreme Court IEEPA Ruling (Feb 20): Struck down IEEPA-based tariffs 6-3, creating a legal vacuum with $175-179B in tariff collections now questionable.
Q4 GDP Miss (Feb 20): Only 1.4% annualized growth vs 2.5-3.0% consensus, though the 43-day government shutdown skewed the data.
Nvidia Earnings Disappoint (Feb 25): Revenue $68.1B (+73% YoY) beat estimates, but stock fell 5.5% as investors worried about AI capex sustainability -- fueling the ongoing "Great Rotation" out of mega-cap tech.
🎲 Price Targets & Probabilities
Using gamma levels, implied move data, and the dense catalyst calendar, here are the scenarios through March 13 (the trade's expiration):
📉 Bear Case (40% probability)
Target: $660-$675 (This is what the trader is betting on)
How we get there:
- 💥 Iran conflict escalates further -- Strait of Hormuz disruption pushes oil toward $85-90, triggering stagflation fears
- 📊 February CPI on March 11 comes in hot (above 2.5% YoY), especially with rising energy costs
- 📉 Negative gamma environment amplifies the selloff -- dealers forced to sell into declines
- 🔻 S&P 500 breaks the 6,830 "line in the sand" support, opening path to 6,775 (100-day MA)
- 💰 Tariff uncertainty + weakening consumer confidence (Expectations Index at 72.0, below 80 recession threshold)
Trade P&L: The $675/$660 bear put spread is worth $15 at max payout ($660 or below). At ~$1.75 net debit per spread ($7.8M / 44,500 contracts), that's roughly 8.6x return on the $7.8M investment = ~$59M profit at max. If SPY hits $675 exactly, the spread is near breakeven.
🎯 Base Case (40% probability)
Target: $675-$690 range
Most likely scenario:
- ⚖️ Iran situation creates initial volatility but doesn't escalate to full Strait of Hormuz closure
- 📊 Economic data (jobs Mar 6, CPI Mar 11) comes in roughly in line with expectations
- 🔄 SPY stays within the implied move range ($676-$695 by Friday)
- 📈 The "Great Rotation" continues -- breadth healthy but SPY cap-weighted index stays range-bound
- 🛡️ Gamma support at $680 and put gamma at $675 cushion the downside
Trade P&L: The bear put spread likely loses most or all of the $7.8M net debit if SPY stays above $675. The 0DTE puts already collected $2.9M in financing regardless of outcome.
📈 Bull Case (20% probability)
Target: $690-$705
How we get there:
- 🕊️ Iran conflict de-escalates rapidly (ceasefire, diplomatic resolution)
- 📊 Strong jobs data on Mar 6 + benign CPI on Mar 11 calm fears
- 💪 Dip-buyers overwhelm sellers; market breaks above $690 gamma resistance
- 🏦 Wall Street consensus still targets ~7,575 year-end (+10.9% from here)
- 📈 Monthly OPEX implied move upper range: $704.27
Trade P&L: The bear put spread expires worthless -- full $7.8M loss. However, this is a defined-risk trade, so the max loss is capped.
💡 Trading Ideas
🛡️ Conservative: "Insurance Policy" (Buy-and-Hold Hedge)
Play: Buy a simple put spread for portfolio protection through the March catalyst gauntlet.
Structure: Buy SPY Mar 20 $680 Put / Sell SPY Mar 20 $670 Put
Why this works:
- 🛡️ Cheap downside protection through CPI (Mar 11) AND FOMC (Mar 17-18)
- 💰 A $10-wide spread costs roughly $2.50-$3.00 ($250-$300 per spread)
- 📊 Max profit: $700-$750 per spread if SPY drops to $670 or below by Mar 20
- ⏰ Triple witch expiration (Mar 20) captures all the major March catalysts
- 🎯 Think of it as buying home insurance before hurricane season
Risk level: Low (defined max loss of premium paid) | Skill level: Beginner-friendly
⚖️ Balanced: "Follow the Whale" Bear Put Spread
Play: Take a smaller version of the institutional trade -- the Mar 13 $675/$660 bear put spread.
Structure: Buy SPY Mar 13 $675 Put / Sell SPY Mar 13 $660 Put
Why this works:
- 🐋 You're aligning with a $36.5M institutional bet -- not leading, following
- 📊 Defined risk: Max loss is the debit paid (~$2.40-$2.50 per spread = $240-$250)
- 📈 Max profit: $15 wide spread - debit = ~$12.50 per spread ($1,250) if SPY at $660 or below
- 🎯 CPI on March 11 is the key catalyst -- 2 days before expiration
- 📉 Implied move lower range for weekly already extends to $676, and negative gamma amplifies further
Position sizing: Risk no more than 2-3% of your account. For a $25K account, that's 2-3 spreads max.
Risk level: Moderate (defined risk) | Skill level: Intermediate
🚀 Aggressive: "Geopolitical Shock" Put Butterfly
Play: Position for a specific move to the $670-$675 area using a put butterfly.
Structure: Buy 1x SPY Mar 13 $680 Put / Sell 2x SPY Mar 13 $670 Put / Buy 1x SPY Mar 13 $660 Put
Why this could work:
- 💰 Very cheap entry: Butterfly costs roughly $1.50-$2.00 ($150-$200 per butterfly)
- 🎯 Max profit at $670: $10.00 per spread ($1,000) -- that's a potential 5-6x return
- 📉 Targets the exact zone between gamma support ($675) and the institutional spread's lower strike ($660)
- ⏰ March 11 CPI + ongoing Iran uncertainty could push SPY into this zone
- 📊 Risk capped at premium paid
Why this could fail:
- ❗ Butterflies need a very specific landing zone -- too much or too little movement kills it
- 📉 If SPY crashes through $660, the butterfly's value collapses
- ⏰ Short time to expiration means theta burns fast
- 🎢 VIX already elevated at 24-25 -- options are pricier than usual
Risk level: High (need specific price outcome) | Skill level: Advanced
⚠️ Risk Factors
Don't get caught by these potential landmines:
-
💥 Iran escalation is unpredictable: This conflict can go from "markets shrug it off" to "Strait of Hormuz fully closed, oil at $100+" in a single headline. The de facto insurance withdrawal already disrupted 20% of global oil supply routes. Any escalation beyond the current strikes could cause moves well beyond what's currently priced.
-
📊 Negative gamma amplifies both directions: The 2.17 put/call OI ratio means market makers are net short puts. They hedge by selling futures as prices drop, creating a vicious cycle. But if markets rally, the same dynamic works in reverse -- shorts covering + dealer buying can trigger violent squeezes higher.
-
📈 Dip-buyers showed up today: Despite the Iran shock, S&P 500 recovered from -1.2% to roughly flat by close. This market has been conditioned to "buy the dip" for over a year. The bear case needs sustained selling pressure, not just a one-day scare.
-
🏛️ CPI timing is a double-edged sword: If February CPI on March 11 comes in cool (below 2.5%), it removes the inflation fear catalyst and the bear put spread likely loses. The 2-day window between CPI and the Mar 13 expiration leaves very little margin for error.
-
💵 Tariff policy is in flux: The Supreme Court's IEEPA ruling created legal chaos, and the new Section 122 tariffs have a 150-day shelf life. Policy whiplash can cause sharp moves in either direction -- not just down.
-
📉 Valuation provides some cushion -- for now: At 22.2x forward P/E, SPY is expensive but not wildly overvalued by recent standards. Wall Street consensus still sees +10.9% upside to year-end. The institutional community isn't uniformly bearish.
-
🐋 This could be a hedge, not a directional bet: An institution running billions in long equity exposure might use this bear put spread as a tactical hedge through the March catalyst gauntlet -- not as a conviction short. If it's a hedge, it doesn't necessarily signal a broader bearish view.
🎯 The Bottom Line
Real talk: A $36.5M, 6-leg put structure on SPY doesn't show up every day. This is institutional-grade positioning -- likely a hedge fund or large asset manager preparing for the possibility that Iran conflict + CPI + tariff uncertainty pushes the market lower over the next 11 days.
What this trade tells us:
- 🎯 The trader expects SPY to drop from $685 to below $675 by March 13 -- a 1.5% decline
- 💰 They paid above ask on one leg (nearly 19,000 contracts) showing genuine urgency
- ⏰ The 0DTE financing component (selling tomorrow's $675 puts to close) shows sophistication -- they're rolling an existing position into a new structure
- 📊 Net risk of $7.8M for a potential $59M payout = this is a high-conviction, asymmetric bet
- 🔥 Z-scores up to 39.0 across the legs confirm this is EXTREMELY unusual activity
If you own SPY or a broad market portfolio:
- 🛡️ Consider adding some downside protection (put spreads or collars) through March 20 triple witch
- 📊 Key support levels to watch: $680 (first gamma support), $675 (the bear spread's target), $670 (100-day MA zone)
- ⏰ The next 11 days are catalyst-dense -- don't overleverage in either direction
- 💰 If you've been meaning to take some profits or rebalance, this is a reasonable time to do it
If you're watching from the sidelines:
- 👀 March 6 (jobs report) and March 11 (CPI) are the key dates -- mark your calendar
- 📉 A break below $680 would confirm the bearish thesis; a bounce off $680 with strong volume would invalidate it
- 🎯 If markets do pull back to $670-$675, that could be a solid entry point for long-term bulls -- Wall Street still targets 7,500+ year-end
If you're bearish:
- 📉 The bear put spread structure is the smart way to play it -- defined risk, asymmetric payout
- ⚠️ Don't naked short SPY into a negative gamma environment -- the snap-back rallies are vicious
- 🎯 Target the $670-$675 zone as first profit-taking area, $660 as extended target
- ⏰ Time your entry around catalysts, not just conviction
Mark your calendar -- Key dates:
- 📅 March 3 (Tomorrow) -- 0DTE $675 puts expire; watch for position adjustments
- 📅 March 4 (Tuesday) -- EU trade deal reassessment
- 📅 March 6 (Friday) -- February nonfarm payrolls
- 📅 March 11 (Tuesday) -- February CPI release (this is the BIG one for this trade)
- 📅 March 13 (Thursday) -- Bear put spread expiration day
- 📅 March 17-18 (Tue-Wed) -- FOMC meeting + decision
- 📅 March 20 (Friday) -- Triple witch quarterly OPEX
Final verdict: This is a well-structured, high-conviction bearish bet from a sophisticated player who sees the convergence of geopolitical shock (Iran), macro data risk (CPI), and policy uncertainty (tariffs/FOMC) as enough to push SPY below $675 in the next 11 days. The trade is not reckless -- it's defined risk with asymmetric upside -- but it does require multiple catalysts to align in a bearish direction. Whether you follow the whale or just use this as a signal to tighten risk management, the message is clear: March is going to be bumpy. Hedge accordingly.
Disclaimer: Options trading involves substantial risk of loss and is not suitable for all investors. This analysis is for educational purposes only and not financial advice. Past performance doesn't guarantee future results. The extremely unusual z-scores (up to 39.0) reflect the size of these specific trades relative to recent history -- they do not imply the trades will be profitable or that you should follow them. SPY options are extremely liquid but multi-leg strategies carry execution risk. Always do your own research and consider consulting a licensed financial advisor before trading.
About SPDR S&P 500 ETF Trust (SPY): SPY is the world's largest and most liquid ETF with $698.27B in AUM, tracking the S&P 500 Index. Managed by State Street Global Advisors, it provides exposure to 500 of the largest U.S. companies across all sectors.