📅 March 9, 2026 | 🔥 Extremely Unusual Activity Detected
🎯 The Quick Take
Someone just sold $141 MILLION in short puts on SPY -- all at the same second, all expiring THIS FRIDAY, all executed BELOW the bid. 🐋 Five massive trades, 358,000 contracts, targeting the $650-$675 zone while the market is in full-blown fear mode with oil above $100 and the VIX screaming near 30. This is the kind of trade that doesn't come from a Robinhood account. This is institutional conviction -- cold, calculated, and worth paying attention to.
💰 The Option Flow Breakdown
📊 What Just Happened
| Time | Symbol | Buy/Sell | Call/Put | Expiration | Strike | Volume | Premium | Order Type | Strategy | Z-Score |
|---|---|---|---|---|---|---|---|---|---|---|
| 10:06:20 | SPY | SELL | PUT | 2026-03-13 | $660 | 144,000 | $54M | STO | Short Put | 116.45 |
| 10:06:20 | SPY | SELL | PUT | 2026-03-13 | $675 | 47,000 | $34M | STO | Short Put | 18.54 |
| 10:06:20 | SPY | SELL | PUT | 2026-03-13 | $650 | 73,000 | $19M | STO | Short Put | 22.10 |
| 10:06:20 | SPY | SELL | PUT | 2026-03-13 | $660 | 33,000 | $16M | STO | Short Put | 25.96 |
| 10:06:20 | SPY | SELL | PUT | 2026-03-13 | $660 | 61,000 | $18M | STO | Short Put | 48.79 |
📅 Expiration: 2026-03-13 (4 days out -- THIS FRIDAY!)
💸 Total Premium Collected: $141,000,000
🔥 Unusualness: Z-Scores ranging from 18.54 to 116.45 -- EXTREMELY UNUSUAL across every single trade. For context, anything above 3.0 is considered unusual. The lead trade's z-score of 116.45 is off the charts.
⚡ Execution: ALL trades hit BELOW BID -- this is aggressive selling, meaning the trader was willing to accept a worse price to guarantee fills immediately. That's urgency and conviction.
🤓 What This Actually Means
Let's break this down in plain English.
When you sell a put, you're making a bet that the stock stays above your strike price by expiration. If it does, you keep all the premium you collected. If it doesn't, you're on the hook to buy shares at the strike price (minus the premium you pocketed).
So what's happening here?
🎯 The $660 Strike (238,000 contracts, $88M): Three separate fills at $660 represent the heaviest concentration. With SPY at ~$668.76, the $660 strike is about 1.3% below the current price. The trader is betting SPY does NOT fall below $660 by Friday.
🎯 The $675 Strike (47,000 contracts, $34M): This is the most aggressive leg -- $675 is only ~$6 below current price, barely out of the money. This trader is saying "SPY holds right here."
🎯 The $650 Strike (73,000 contracts, $19M): Deeper out-of-the-money, offering more cushion but lower premium per contract. This is the "safety net" level -- about 2.8% below current price.
Translation: Somebody with extremely deep pockets is collecting $141 million in premium by betting that SPY doesn't crash through the $650-$675 zone in the next 4 trading days. With only 4 days until expiration, time decay (theta) is working in their favor at maximum speed. Every hour that passes without a crash puts money in their pocket.
The all-at-once, same-second execution and the STO (Sell to Open) classification confirm these are new positions, not closing out old ones. This is fresh money being put to work with enormous conviction.
📊 SPY Overview: The World's Biggest ETF
SPY is the SPDR S&P 500 ETF Trust -- the most widely traded ETF on the planet with $679.5 billion in assets under management. It tracks the S&P 500 index of large-cap US stocks and is the single most liquid options product in the world.
Key Stats:
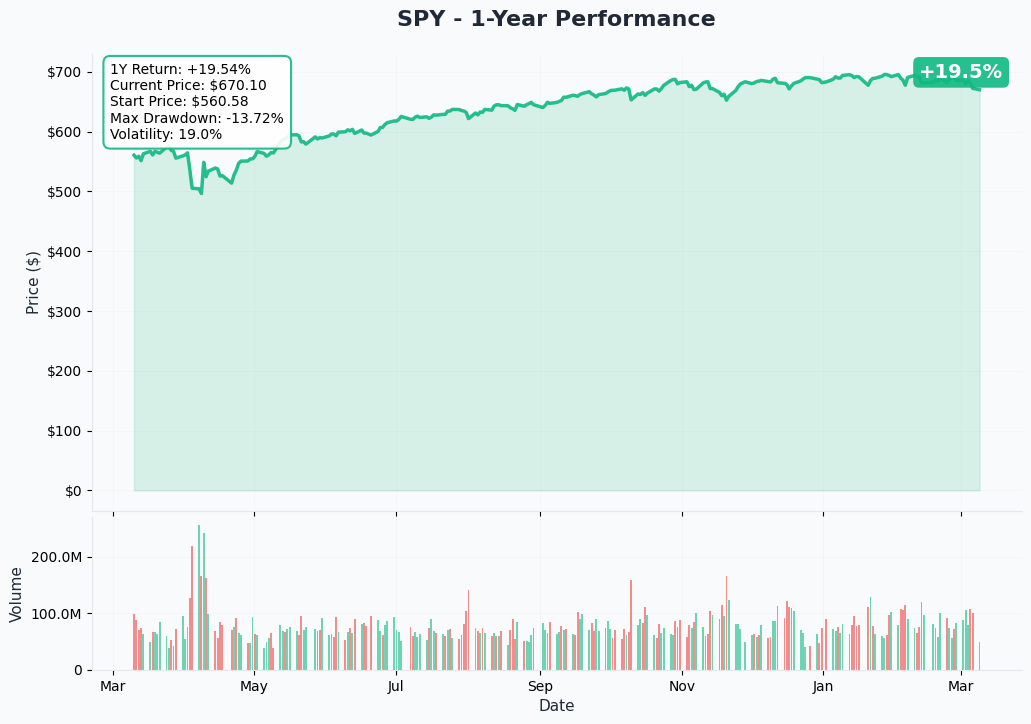
- 📊 Current Price: ~$668.76
- 🏆 All-Time High: $697.84 (January 27, 2026) -- now 4.2% below ATH
- 📈 52-Week Range: $481.80 - $697.84
- 📉 YTD Performance: Approximately flat (-0.22%)
- 📉 1-Week Performance: -2.0% (worst week since October 2025)
- 📉 1-Month Performance: -2.01%
- ⚡ VIX: ~29.48 (up 24% in 24 hours) -- approaching panic territory
The S&P 500 posted its lowest close of 2026 on March 6 after the February jobs report showed a loss of 92,000 nonfarm payrolls and the Strait of Hormuz crisis sent oil prices surging past $100/barrel.
📈 Technical Setup / Chart Check-Up
YTD Performance
SPY entered 2026 with momentum -- the S&P 500 hit all-time highs on January 27 at 7,002.28 -- but the year has turned ugly fast. The Iran conflict, the February jobs miss, and the Supreme Court IEEPA tariff ruling have combined to erase all YTD gains. The market has been below its 50-day moving average since February 27 and is now testing the critical 200-day moving average near $657.
Key Technical Levels:
| Level | S&P 500 | SPY Equivalent | Status |
|---|---|---|---|
| All-Time High | 7,002 (Jan 27) | ~$697.84 | -4.2% below |
| 50-Day MA | ~6,835 | ~$683 | Below since Feb 27 |
| 100-Day MA | ~6,835 | ~$683 | Breached March 5 |
| 200-Day MA | ~6,574 | ~$657 | Testing -- final major defense |
| Psychological | 6,600 | ~$660 | Coincides with short put strikes! |
The technical picture is ugly: 10 out of 10 moving average signals are on "Sell." But that's precisely why the put-selling trade is so interesting -- maximum fear = maximum premium.
🎯 Gamma-Based Support & Resistance Analysis
Based on current gamma exposure (GEX) from options market maker positioning:
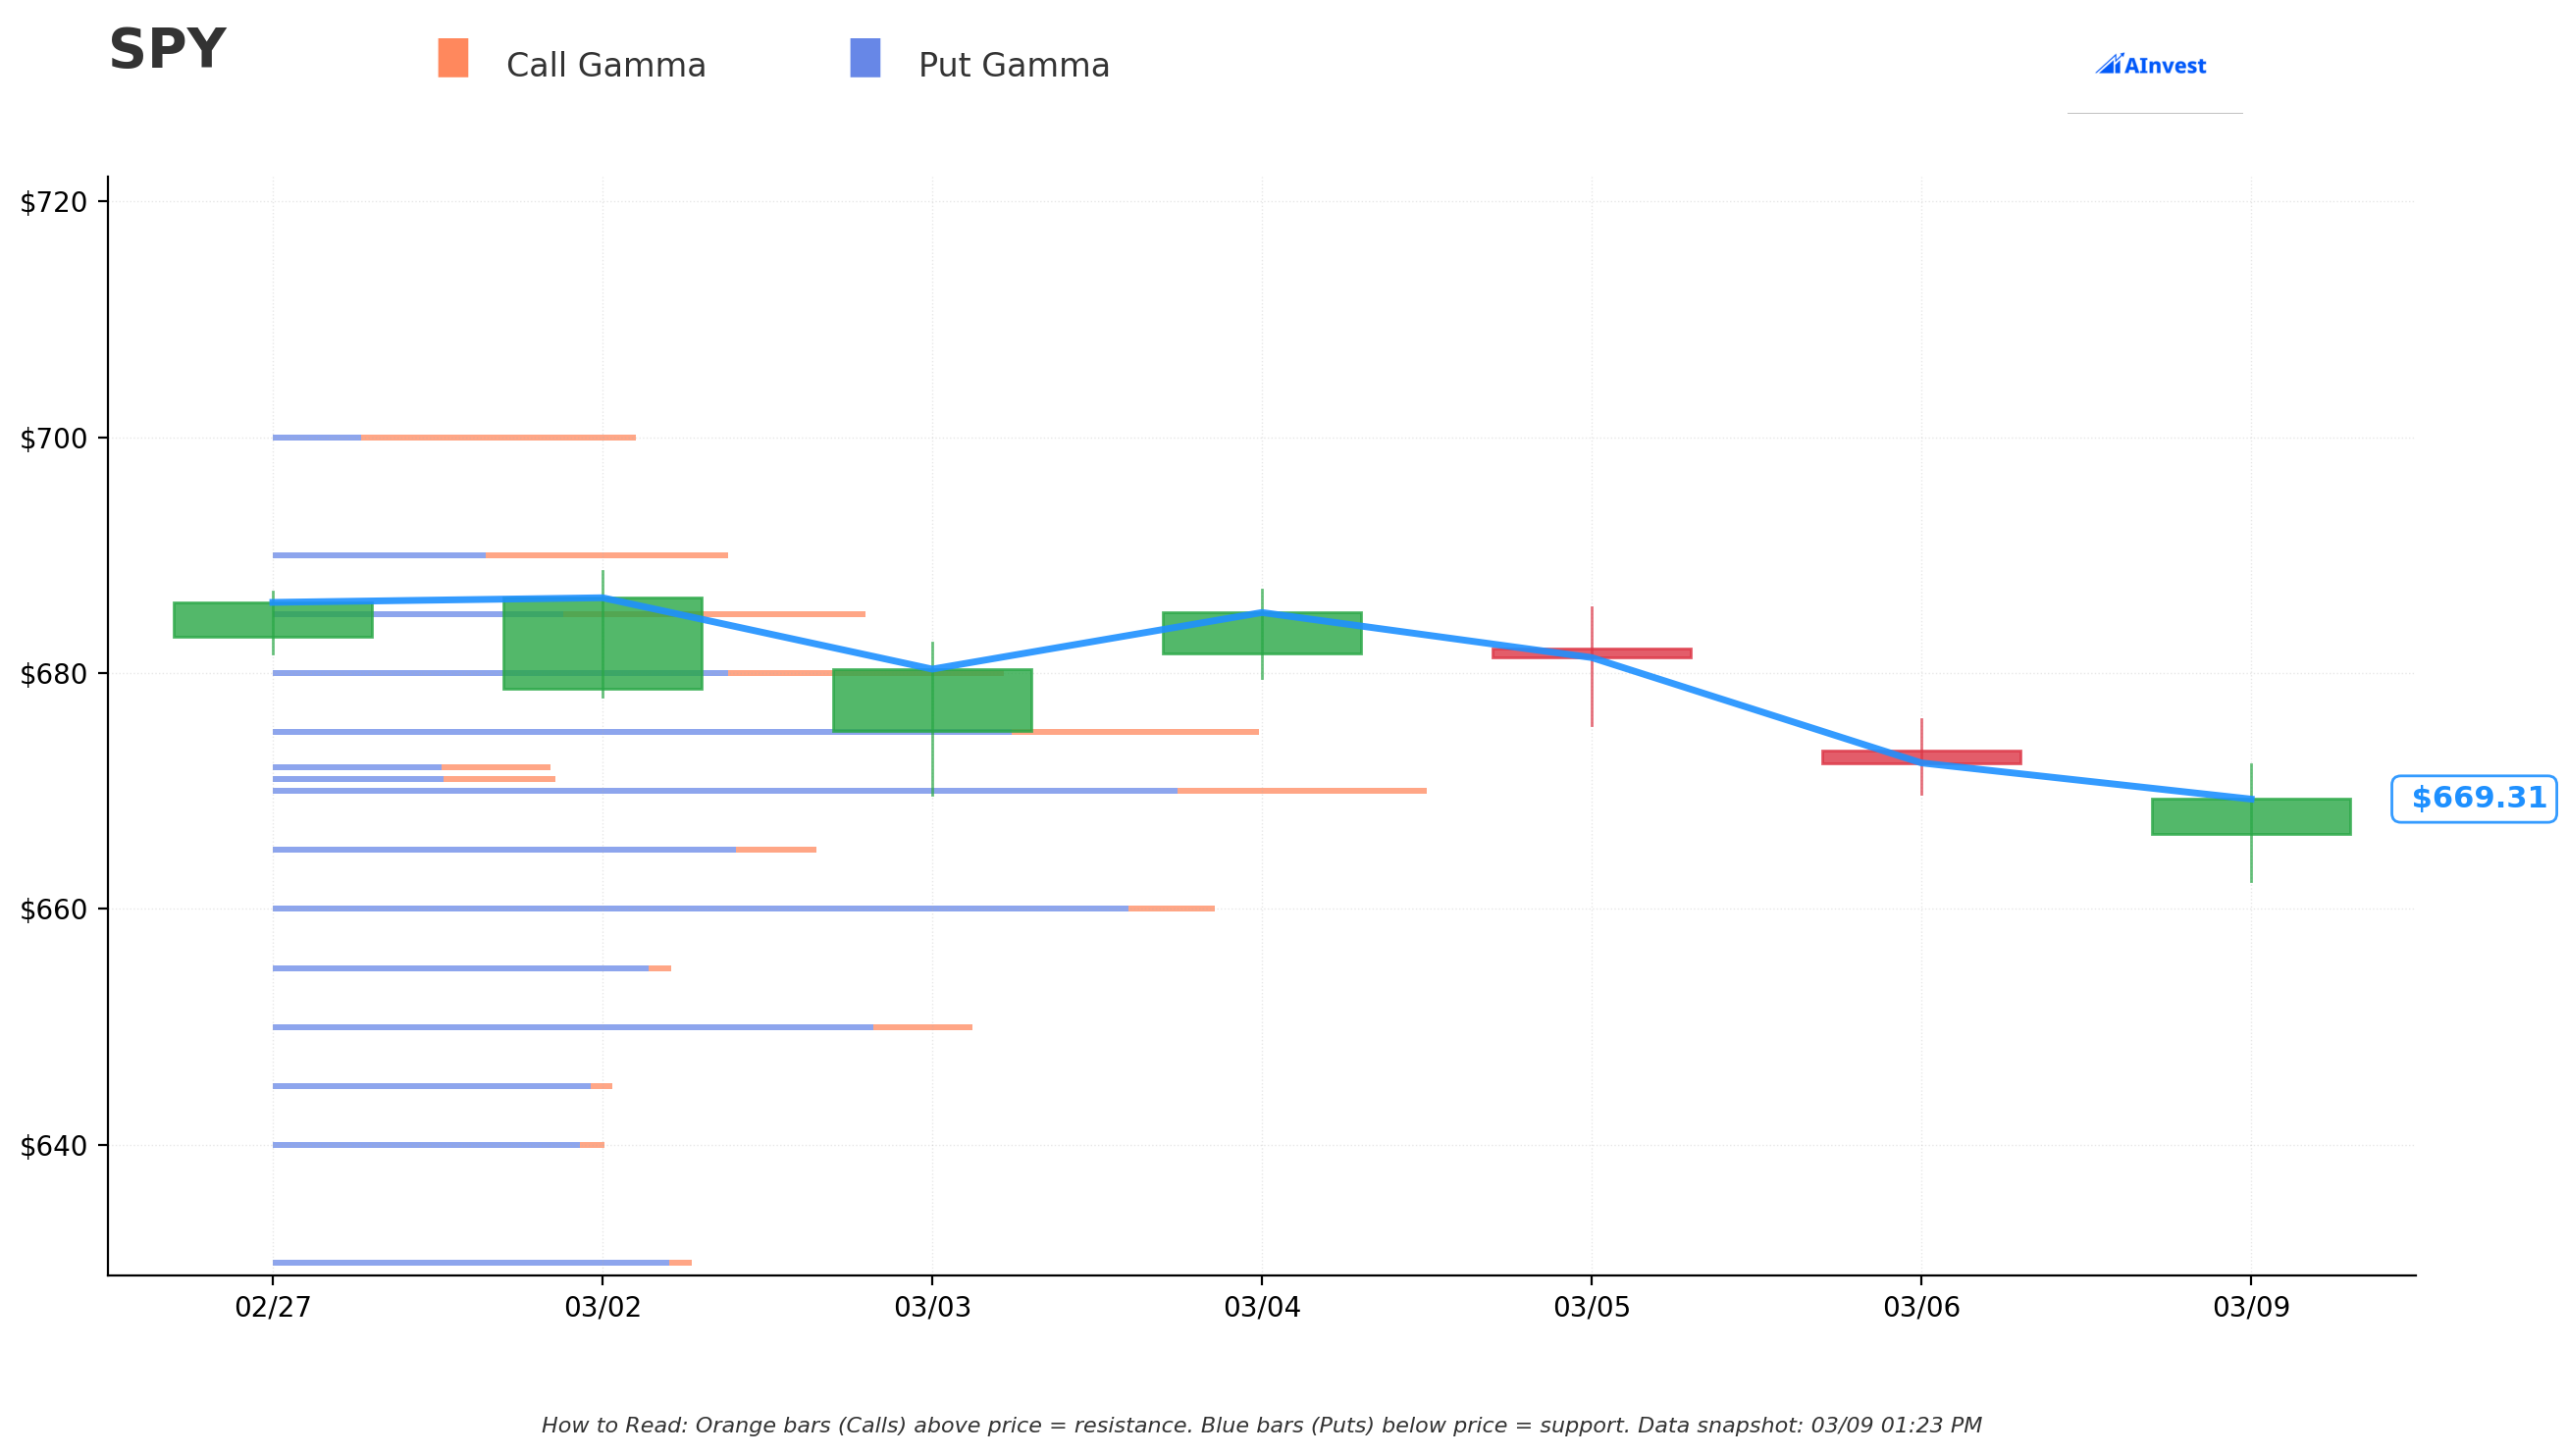
🔵 Support Levels (Where Put Gamma Creates Buying Pressure):
- $665 - Nearest support (173B total GEX, 0.56% below current price)
- $660 - MASSIVE support wall (289B total GEX, 1.3% below) -- this is our primary trade strike!
- $655 - Secondary support (122B total GEX, 2.1% below)
- $650 - Deep support (215B total GEX, 2.8% below) -- also a trade strike!
- $630 - Emergency floor (128B total GEX, 5.8% below)
🟠 Resistance Levels (Where Call Gamma Creates Selling Pressure):
- $670 - Immediate resistance (344B total GEX, largest single level!)
- $675 - Secondary resistance (290B total GEX) -- also a trade strike!
- $680 - Round number resistance (216B total GEX)
- $685 - Gamma flip zone where net GEX turns positive
- $690 - Upper resistance (135B total GEX)
📉 Net GEX Bias: Bearish -- Total put GEX ($3,554B) far exceeds call GEX ($1,573B). Market makers are net short gamma, meaning they'll amplify moves in either direction through hedging.
🐋 Why This Matters for the Trade: The massive $660 put gamma wall means market makers already have enormous short put exposure at that strike. This trade just piled on another 238,000 contracts. If SPY approaches $660, market makers will need to BUY shares aggressively to delta-hedge, creating a powerful "gravity well" that could prevent a breakdown. The put seller is essentially reinforcing the floor.
📊 Implied Move Analysis
What Options Pricing Tells Us About Expected Ranges:
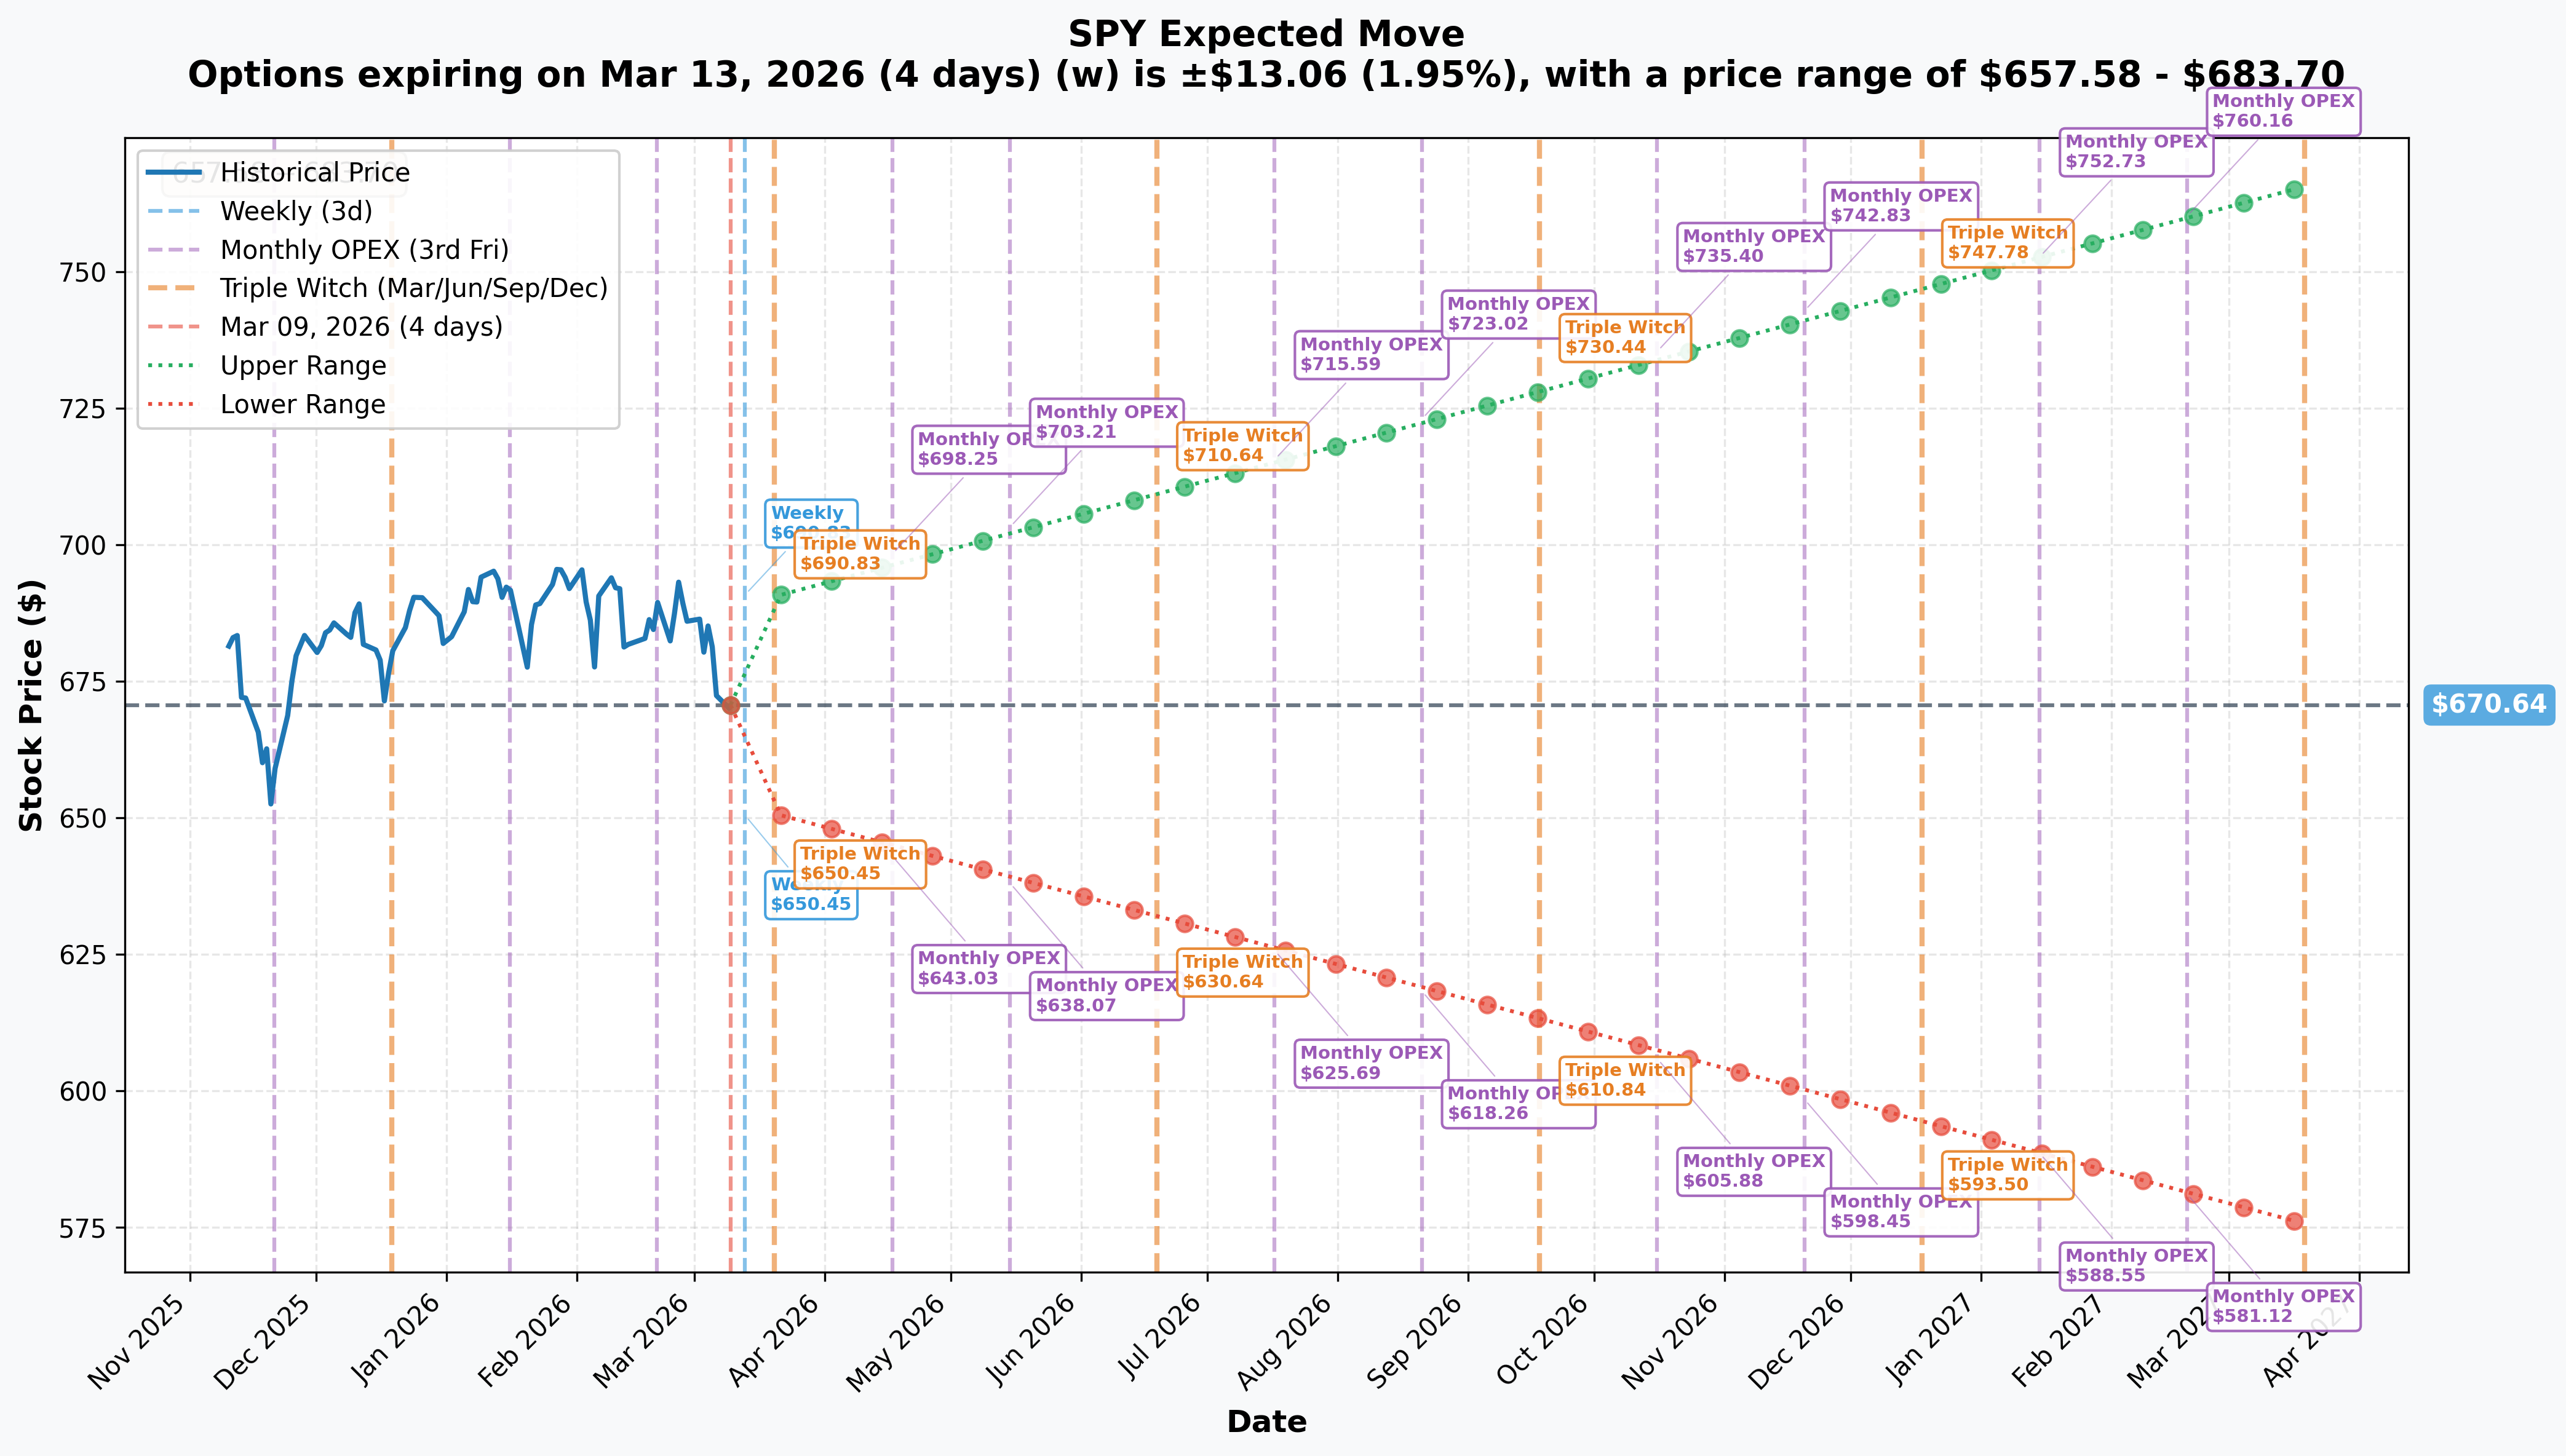
| ⏰ Timeframe | 📅 Expiry | 📈 Upper Range | 📉 Lower Range | ±% Move |
|---|---|---|---|---|
| Weekly (THIS TRADE) | 2026-03-13 | $683.70 | $657.58 | ±1.95% |
| Monthly / Triple Witch | 2026-03-20 | $690.62 | $650.66 | ±2.98% |
| April OPEX | 2026-04-17 | $698.25 | $643.03 | ~±4.1% |
| Yearly LEAPs | 2027-03-19 | $765.73 | $575.55 | ±14.18% |
🎯 Key Insight for This Trade: The weekly implied move suggests a 1-sigma range of $657.58 to $683.70 by Friday. The primary $660 strike sits RIGHT AT the lower edge of this range, and the $650 strike sits well BELOW it. The options market is saying there's roughly a 68% chance SPY stays between $657.58 and $683.70 -- meaning the $660 put seller has the odds working in their favor.
Even better: with a VIX at ~29.5, implied volatility is extremely elevated, which means the premium collected on these puts is FAT. If the market calms down even slightly, IV crush alone will make these puts worthless faster than theta decay.
🎪 Catalysts -- The Most Loaded Week of 2026
This is where it gets wild. The next 11 days contain three major catalysts stacked on top of an active geopolitical crisis. Let's map it out:
⚡ This Week (March 9-13) -- Our Trade Window
📊 February CPI Release -- Wednesday, March 11 at 8:30 AM ET
This is the single biggest binary risk event before our trade expires Friday.
- Prior (January): Headline +0.2% m/m, +2.4% y/y; Core +0.3% m/m, +2.5% y/y
- Consensus for February: Headline +0.3% m/m, +2.5% y/y; Core +0.3% m/m, +2.5% y/y
- The wildcard: February CPI likely does NOT yet reflect the full oil shock (Strait of Hormuz crisis began Feb 28), but tariff pass-through from the Section 122 surcharge (effective Feb 24) may begin showing up
- One-year inflation expectations have already spiked to 4.2%
📈 Cool CPI scenario: Relief rally, IV crush, put sellers win big 📉 Hot CPI scenario: Stagflation fears spike, but the $660 level has massive gamma support
📅 Next Week (March 16-20) -- Post-Trade but Critical Context
🏛️ FOMC Meeting -- March 17-18 (Decision: March 18 at 2:00 PM ET)
- Current Rate: 3.50%-3.75%
- Probability of Hold: ~99% -- essentially guaranteed no cut
- What matters: The updated Summary of Economic Projections and dot plot. Current median shows one 25bp cut for 2026, but markets price two cuts
- Key risk: If Powell even hints at "stagflation" or the dot plot shifts hawkish, risk assets will sell off hard. But our trade expires BEFORE this meeting!
🧙 Triple Witching -- Friday, March 20
- Simultaneous expiration of stock options, index options, and stock index futures
- Historically one of the most volatile days each year -- volume has nearly doubled on these days
- Massive open interest at round-number strikes ($650, $660, $670, $680) creates potential "gamma trap" scenarios
- Our trade expires a full week before this, avoiding the chaos entirely
🌍 The Elephant in the Room: Iran & the Strait of Hormuz
The biggest macro variable driving everything right now:
- Joint US-Israel strikes on Iran began February 28, including the killing of Iran's supreme leader
- Iran retaliated with missiles and drones on US bases and Gulf state infrastructure
- Tanker traffic through the Strait of Hormuz dropped to approximately zero
- Oil surged past $100/barrel; WTI posted its biggest weekly gain (+36%) since futures started trading in 1983
- Gas prices jumped to $3.45/gallon in a single week
Morgan Stanley identifies conflict duration as the single most critical variable for 2026 market performance. Short conflict = V-shaped recovery. Prolonged conflict = sustained pain.
✅ Recent Catalysts Already Priced In
| Event | What Happened | Market Impact |
|---|---|---|
| Feb Jobs Report (Mar 6) | -92K payrolls vs. +50K expected; unemployment 4.4% | 📉 S&P 500 worst week since Oct 2025 |
| SCOTUS IEEPA Ruling (Feb 20) | Tariffs declared unconstitutional; $175B refund exposure | 📉 Policy uncertainty spike |
| Section 122 Tariff (Feb 24) | 10% global surcharge via unprecedented legal authority | 📉 Inflation + trade fears |
| Q4 2025 Earnings | 14.2% blended growth; record 13.1% margins | 📈 Positive but fading tailwind |
| S&P 500 Rebalance (Mar 6) | VRT, LITE, COHR, SATS added; effective Mar 23 | Neutral for SPY overall |
🎲 Price Targets & Probabilities
Based on gamma levels, implied move data, catalyst timing, and the institutional flow:
📈 Bull Case: $675-$690 by Friday (35% probability)
Why it could happen:
- CPI comes in soft on Wednesday, triggering a relief rally
- Iran ceasefire headlines emerge (any de-escalation = massive risk-on)
- IV crush from VIX reversal collapses put premiums rapidly
- Gamma squeeze above $670 forces market maker buying
For the put seller: This is the dream scenario. All five puts expire worthless. Full $141M premium collected.
⚖️ Base Case: $660-$675 range by Friday (45% probability)
Why this is most likely:
- Market digests CPI without a major surprise
- Geopolitical situation remains tense but doesn't escalate further
- SPY consolidates near current levels as traders wait for FOMC
- $660 gamma wall provides strong downside floor
For the put seller: The $650 and $660 puts expire worthless or near-worthless. The $675 puts may cause some sweat but theta decay helps. Still a very profitable outcome -- $100M+ in net premium retained.
📉 Bear Case: $650-$660 zone by Friday (15% probability)
What could go wrong:
- CPI prints hot, destroying any hope of rate cuts
- Iran conflict escalates dramatically (Hormuz full blockade, direct Gulf state attacks)
- 200-DMA at $657 breaks, triggering algorithmic selling cascades
- VIX spikes above 35 into true panic territory
For the put seller: This is the pain scenario. The $675 puts are deep in the money, the $660 puts are at the money. Losses could run into the hundreds of millions. But the massive gamma wall at $660 and the depth of capital behind this trade suggest the seller has the balance sheet to absorb it.
☠️ Tail Risk: Below $650 by Friday (5% probability)
Catastrophe scenario:
- Full Strait of Hormuz closure pushes oil toward $150
- Emergency Fed response required
- Market circuit breakers tested
For the put seller: Maximum pain. But note that the options market gives this only a ~5% probability (the $650 strike sits outside the 1-sigma weekly implied move).
💡 Trading Ideas
🛡️ Conservative: "Ride the Whale's Wake"
Sell a Wider Put Spread Below the Institutional Floor
💰 Estimated Credit: ~$0.40-0.60 per spread
📈 Max Profit: Credit received if SPY stays above $645
📉 Max Loss: $5 width minus credit received (~$4.50 per spread)
Why this works: You're selling BELOW all five institutional trade strikes, using their massive gamma wall at $650-$660 as your shield. SPY would need to fall 3.5%+ in 4 days, blow through three layers of institutional put gamma, AND break the 200-DMA to hurt you. With the whale absorbing premium above you, your strikes have extra insulation.
Best for: Income-seeking traders who want defined risk and maximum cushion. High probability of profit with 4-day time horizon.
⚖️ Balanced: "The CPI Straddle Fade"
Sell the Elevated Volatility Around the CPI Print
💰 Estimated Credit: ~$4.00-6.00 per strangle
📈 Max Profit: Full credit if SPY stays between $660 and $680
📉 Max Loss: Unlimited beyond the strikes (use stop losses!)
Why this works: With VIX at ~29.5, implied volatility is juiced up. The CPI print on Wednesday will either confirm or reject the fear -- and regardless of direction, IV will likely contract after the event. You're selling the same $660 floor as the institutional whale while capping the upside at $680 resistance. The gamma analysis shows $670 is the "gravity center" right now.
Best for: Experienced options traders comfortable with naked short positions and active management. This is NOT a set-and-forget trade -- you need to manage after CPI.
⚠️ Important: This is a short strangle with undefined risk on the upside. Size appropriately and have a clear exit plan.
🚀 Aggressive: "The Capitulation Bounce Play"
Buy the Dip Into Maximum Fear
💰 Estimated Cost: ~$12-15 per contract
📈 Max Profit: Unlimited above $670 + premium paid
📉 Max Loss: Premium paid
Why this works: The contrarian case is compelling. The put/call ratio at 1.57 is extremely bearish. VIX at ~29.5 is approaching the 30-level panic threshold. Historically, markets have posted double-digit gains 3-6 months after the onset of Gulf Wars. Wall Street year-end targets remain at 7,600-7,800, implying 12-15% upside. If ceasefire headlines hit or CPI comes in cool, the snap-back could be violent.
Using the Triple Witching expiration (March 20) gives you 11 days and captures both CPI and FOMC as potential catalysts.
Best for: Traders who believe the selloff is overdone and want leveraged upside exposure to a relief rally.
🎯 Pro Tip: Consider a call debit spread ($670/$690) to reduce cost and improve breakeven: buy the $670, sell the $690 for roughly $5-7 net debit, capping max profit at $20 per spread but cutting your cost in half.
⚠️ Risk Factors
Let's be honest about what could go wrong, because there is a LOT that could go wrong right now:
🌍 Geopolitical Risk (SEVERE)
- The Strait of Hormuz crisis is an active, evolving military conflict -- this is NOT theoretical risk
- Full blockade could push oil to $150+, triggering a global economic shock
- Iranian drones attacked Qatari gas facilities on March 2, halting production -- European gas prices nearly doubled
- Conflict expansion beyond the Middle East remains a possibility
- Headlines can move markets 2-3% in minutes -- no stop loss is fast enough for gap risk
📈 Inflation / Stagflation Risk (HIGH)
- Oil shock + tariffs creating dual inflationary pressure
- One-year inflation expectations already at 4.2%
- PIIE analysis warns inflation could rise above 4% by end of 2026 from tariff pass-through
- Wages running hot at +3.8% YoY even as jobs contract -- classic stagflationary signal
- The Fed is trapped between fighting inflation and supporting a weakening labor market
📉 Labor Market Deterioration (HIGH)
- Three job losses in five months; participation rate at multi-year low
- Federal government employment cuts (-10K) likely to continue
- Consumer spending threatened by combination of job losses and higher gas prices ($3.45/gallon)
📊 Technical Risk (MODERATE-HIGH)
- 10 out of 10 moving average signals on "Sell"
- 200-DMA at ~$657 is the last major technical defense -- a breach would likely trigger algorithmic selling
- Below the 50-DMA since February 27
- Forward P/E at 21.6x vs. 5-year average of 20.0x -- elevated multiples leave little margin for error
🐋 Trade-Specific Risks
- $141M in premium collected means the counterparty risk is enormous -- if SPY drops below $650, losses could exceed the premium many times over
- All five trades expire in 4 days -- there's no time to "be right eventually"
- The $675 strike is barely OTM -- it's essentially an at-the-money bet
- A 3%+ gap down on a CPI miss or geopolitical escalation would be catastrophic
- These could be part of a larger hedged position we can't see (collar, conversion, etc.)
🎯 The Bottom Line
Here's what the smart money is telling us: In the middle of an active military conflict, with oil above $100, the VIX near 30, and the worst jobs report in months, someone dropped $141 million saying "the floor holds." That's not hope -- that's a calculated bet backed by institutional capital.
📋 Your Action Plan:
If you're bullish on SPY:
- The institutional put-selling supports the thesis that $650-$660 is a hard floor
- Consider selling put spreads below $650 to collect elevated premium
- Watch CPI on Wednesday (March 11) as your primary binary event
- Any Iran ceasefire headlines = immediate trigger for relief rally
If you're neutral/watching:
- This trade tells you where big money thinks the bottom is: $650-$660
- Don't fight the gamma wall -- respect the $660 level as a key inflection point
- Wait for CPI clarity before establishing new directional positions
- If SPY holds $660 through Friday, that's a powerful signal for the following week
If you're bearish:
- You're fighting $141M in institutional conviction AND a massive gamma wall at $660
- The 200-DMA at ~$657 is your make-or-break level -- a clean break opens $630
- Consider waiting for a catalyst (hot CPI, conflict escalation) before pressing shorts
- If you must short, use defined-risk structures (bear put spreads, not naked short delta)
📅 Key Dates to Watch:
| Date | Event | Why It Matters |
|---|---|---|
| Mar 11 (Wed) | February CPI | THE event for our 4-day trade window |
| Mar 13 (Fri) | Trade Expiration | All five puts expire -- judgment day |
| Mar 18 (Tue) | FOMC Decision + Dot Plot | Fed's inflation vs. employment balancing act |
| Mar 20 (Fri) | Triple Witching | Massive options/futures expiration, extreme volume |
| Mar 23 (Mon) | S&P 500 Rebalance Effective | Index fund forced buying/selling |
🎓 The Lesson Here:
When markets are screaming and everyone is loading up on puts (put/call ratio at 1.57), the institutional playbook is often to sell INTO that fear. Why? Because elevated fear = elevated premiums, and with only 4 days to expiration, time is the seller's best friend.
This $141M trade isn't saying "everything is fine." It's saying "the market has already priced in a LOT of bad news, and we think the floor holds through Friday." Whether you follow the whale or fade it, understanding this positioning gives you an edge.
The S&P 500 has remained above its 200-DMA since May 2025. Record corporate profit margins of 13.1% and 14.2% Q4 earnings growth remind us that beneath the geopolitical noise, the fundamental backdrop for US equities isn't broken -- it's stressed. And there's a big difference.
Stay sharp, size smart, and respect the risk. 💪
📜 Options Trading Resources
📊 View the Trades:
⚠️ Disclaimer: This analysis is for educational and informational purposes only and does not constitute financial advice. Options trading involves significant risk of loss and is not suitable for all investors. The strategies discussed may result in the complete loss of invested capital. Past performance does not guarantee future results. Always do your own research and consider consulting a licensed financial advisor before making investment decisions.
Analysis generated March 9, 2026 | Data sources: Live options flow data, Federal Reserve, BLS, FactSet, CBOE