🐻 SPY $25M Bear Put Spread - Whale Bets the S&P 500 Breaks Down by Friday!
📅 March 23, 2026 | 🔥 Unusual Activity Detected
🎯 The Quick Take
Someone just deployed $25.4 MILLION in a perfectly constructed bear put spread on SPY this morning, betting the S&P 500 rolls over by this Friday's close. The trade structured a buy of $660 puts against a sale of $655 puts, both expiring March 27 - just 4 days away - right as SPY was trading near $660.89. Translation: A massive institutional player is paying $1.69 per share for a leveraged bet that SPY drops at least $2.58 from where they put the trade on.
📊 ETF Overview
SPDR S&P 500 ETF Trust (SPY) is the world's most actively traded ETF, designed to track the S&P 500 index with near-perfect correlation:
- What it is: A basket of all 500 S&P 500 companies weighted by market cap - you buy one share of SPY, you own a slice of every major U.S. company
- AUM: Approximately $550B+ in assets - the single largest ETF on the planet
- Daily volume: Routinely trades 70-100 million shares per day; options volume is among the highest of any security on Earth
- Current price: ~$655.60 (March 23, 2026 close)
- YTD performance: +0.66% (roughly flat after a wild year involving Iran conflict, tariff rulings, and Fed pivots)
- 52-week range: $481.80 - $697.84
💰 The Option Flow Breakdown
📊 The Tape (March 23, 2026 @ 10:34:45 - 10:34:47)
| Time | Symbol | Side | Buy/Sell | Type | Expiration | Strike | Size | Premium | Vol | OI | Spot | Option Price |
|---|---|---|---|---|---|---|---|---|---|---|---|---|
| 10:34:45 | SPY | BID | SELL | PUT $655 | 2026-03-27 | $655 | 13,972 | $6.4M | 39K | 21K | $660.90 | $4.58 |
| 10:34:47 | SPY | MID | SELL | PUT $655 | 2026-03-27 | $655 | 13,972 | $6.4M | 53K | 21K | $660.88 | $4.60 |
| 10:34:45 | SPY | MID | BUY | PUT $660 | 2026-03-27 | $660 | 10,978 | $6.3M | 23K | 29K | $660.90 | $6.27 |
| 10:34:47 | SPY | MID | BUY | PUT $660 | 2026-03-27 | $660 | 9,980 | $6.3M | 38K | 29K | $660.88 | $6.29 |
Strategy: COMPLEX MULTI-LEG (Bear Put Spread) (Buy $660 Puts / Sell $655 Puts, expires 2026-03-27)
🤓 What This Actually Means
This is a textbook bear put spread executed in two rapid-fire fills on each leg within a 2-second window. Here's the anatomy:
- 📉 Leg 1 (Long): Bought approximately 20,958 total $660 put contracts at an average of ~$6.28
- 📈 Leg 2 (Short): Sold approximately 27,944 total $655 put contracts at an average of ~$4.59
- 💸 Net debit paid: ~$1.69 per share ($6.28 - $4.59), which means they paid roughly $3.5M net after the sold puts offset the cost of the bought puts
- 🎯 Total gross premium deployed: ~$25.4M across all four legs
- ⏰ Time to expiration: Just 4 days. This isn't a "set it and forget it" hedge - this is an urgent, high-conviction directional bet for the end of this week
What's really happening here:
The trader bought the $660 puts to profit if SPY drops, then sold the $655 puts to reduce the cost. The spread pays out maximum if SPY closes at $655 or below by Friday. They need SPY to drop just $2.58 from the trade entry price to start making money, and they pocket the maximum $3.31 per share if the S&P 500 falls another ~$5.89 from where they entered.
With SPY having rallied 2.2% TODAY on Trump's "productive Iran talks" claim (which Iran immediately denied), this trader is betting that rally is fake news and the selloff resumes.
Unusualness Score: EXTREME 🔥
All four legs registered as EXTREMELY_UNUSUAL with z-scores of 113, 34, 154, and 56 respectively. For context, the $655 put second fill had a z-score of 154 - meaning this trade was 154 standard deviations above the average trade size. You might see a trade this large a handful of times in a year for a single expiration strike, not multiple in one session. The volume-to-open-interest ratios of 0.79x to 2.52x confirm fresh positioning, not a closing transaction.
📈 Technical Setup / Chart Check-Up
YTD Performance Chart
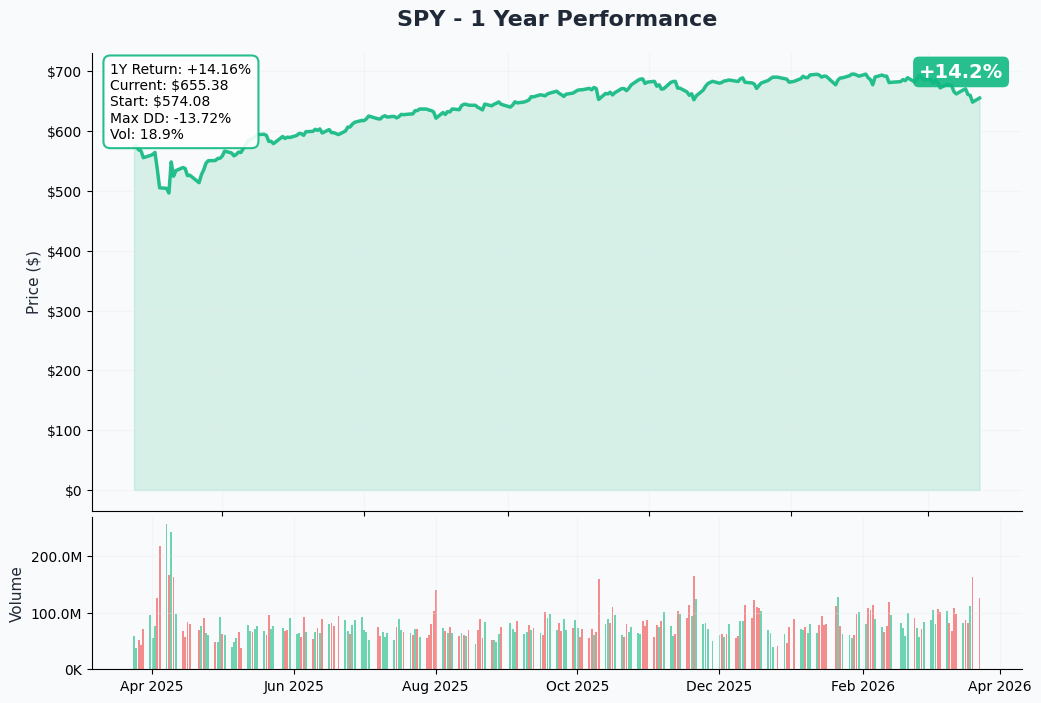
SPY has had a rollercoaster year. Starting 2026 near all-time highs, the index got hit with a double whammy of U.S.-Iran military conflict beginning March 2 and Supreme Court IEEPA tariff rulings in February. The index currently sits roughly 6.8% below its January 27 all-time high of $697.84, essentially flat YTD at +0.66%.
Key observations:
- 📉 Geopolitical shock: The Iran conflict triggered a violent selloff from the January highs, with the VIX spiking above 30 in early March
- 🔄 Sector rotation underway: Energy (XLE) up 25%+ YTD while technology is down ~19.6% - a massive divergence inside the S&P 500
- 📊 Today's bounce: SPY rallied 2.2% on March 23 on Trump's Iran "productive talks" claim, but Iran immediately denied contact through Fars News Agency
- ⚠️ Fragile recovery: With GDP slowing to 0.7% in Q4 2025 and oil near $113/barrel, any continuation of this rally requires real geopolitical progress, not just headlines
Gamma-Based Support & Resistance Analysis
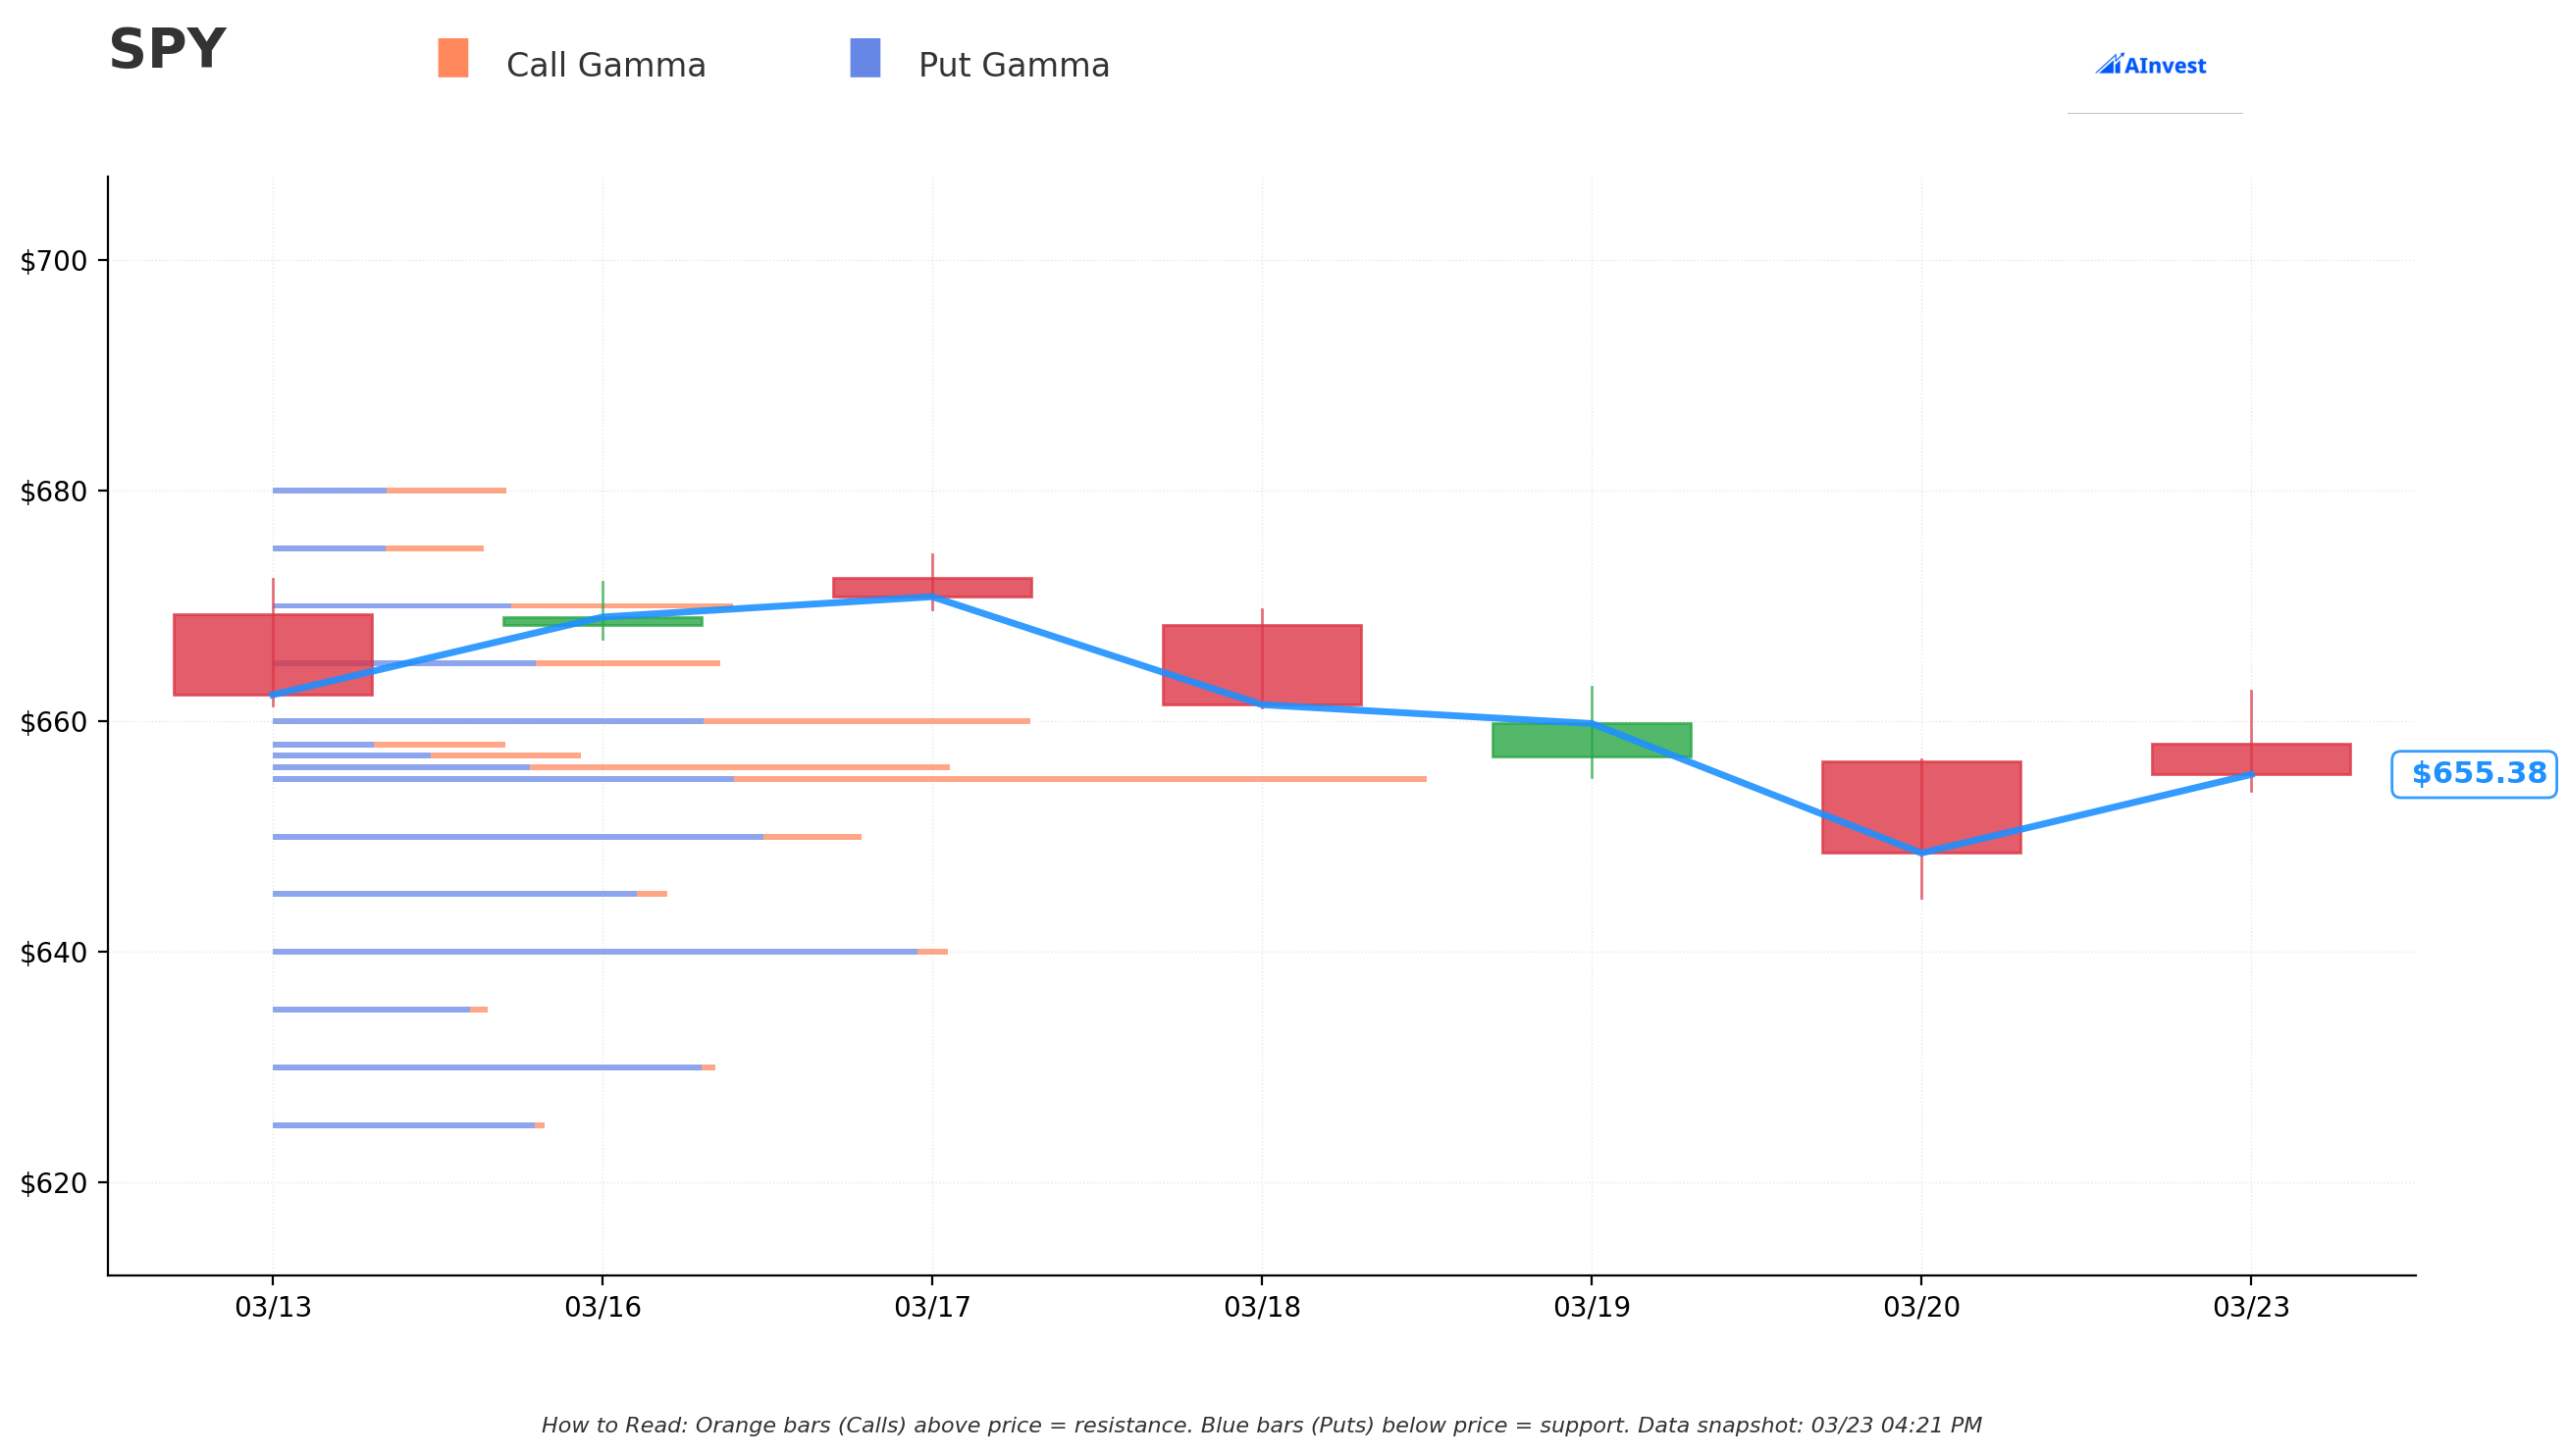
Current Price: $655.60 (end of day)
The gamma exposure map shows a tight battleground right around current price levels, with the options market creating significant "gravity" near the strikes where this bear put spread was placed.
🔵 Support Levels (Put Gamma Below Price):
- $655 - Strongest nearby support with $481M total gamma exposure (this is exactly where the short put leg is struck - not coincidental!)
- $650 - Secondary support with $244M gamma; net GEX flips negative (put gamma dominates) suggesting dealers ADD selling pressure below this level
- $645 - Extended support zone at $163M gamma; break here opens room to $640
- $640 - Deeper floor at $280M gamma (heavy put concentration); critical structural level
- $630 - Disaster floor with $184M gamma; represents ~4% further decline from current
🟠 Resistance Levels (Call Gamma Above Price):
- $656 - Immediate overhead resistance just 40 cents above close - with $279M total gamma, price is already pressing against this wall
- $657 - Light secondary resistance at $127M gamma; thin zone
- $660 - Major resistance at $313M total gamma (the long put strike!). This level has both call AND put gamma concentration - it acts as a magnet. Getting BACK above $660 is the hurdle this spread needs SPY to fail at
- $665 - Extended resistance at $185M gamma
- $670 - Upper resistance at $191M gamma
Net GEX Bias: Bearish (Total put gamma $3.22B vs call gamma $1.98B)
Real talk: The overall gamma backdrop supports the bear thesis here. Put gamma exceeds call gamma by a 1.6:1 ratio across the entire options surface - dealers are net short delta and will amplify downside moves. The $660 strike - exactly where the long put leg sits - has a massive $313M total gamma concentration. That means a lot of options interest at exactly $660, and if SPY can't reclaim and hold $660, the gravitational pull is toward $655 and below.
Implied Move Analysis
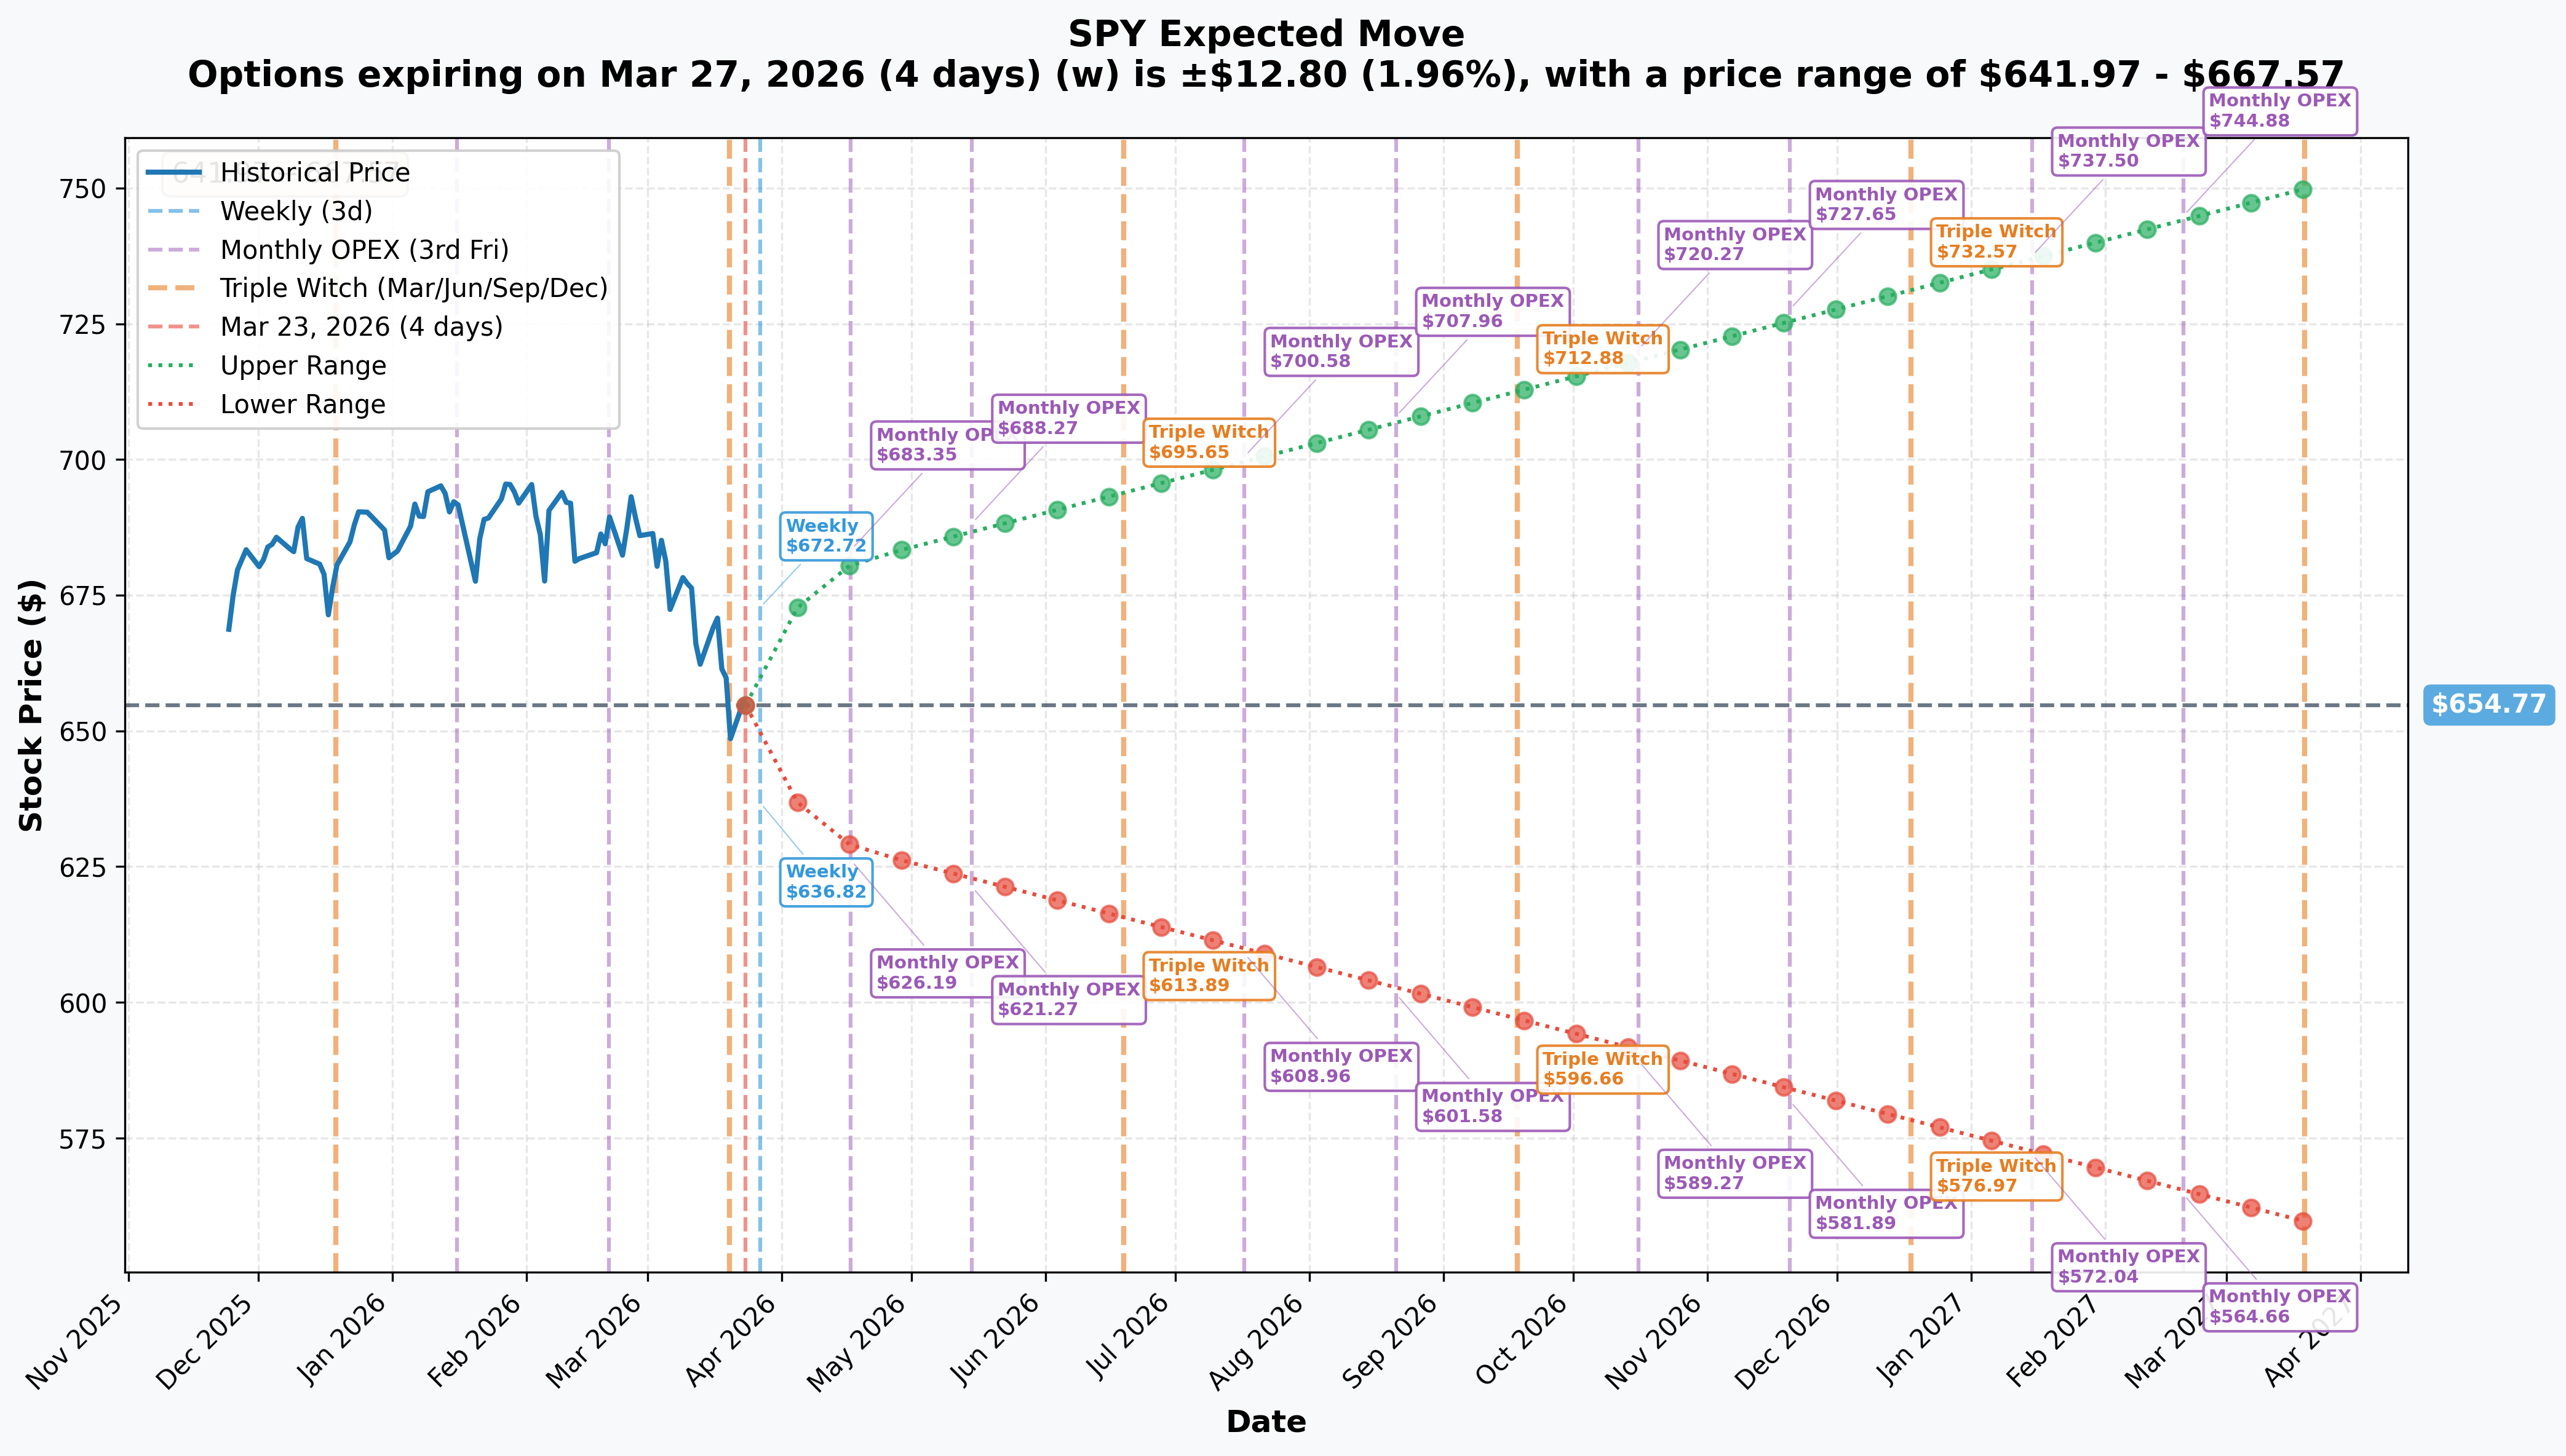
Options market pricing for upcoming expirations:
- 📅 Weekly (2026-03-27 - 4 days, THIS TRADE!): ±1.96% / ±$12.80 → Expected range: $641.97 - $667.57
- 📅 Monthly OPEX (2026-04-17 - 25 days): ±4.02% / ±$26.32 → Range: $628.45 - $681.09
- 📅 LEAPS (2027-03-19 - 361 days): ±14.55% / ±$95.24 → Range: $559.53 - $750.01
Translation for regular folks:
The options market is pricing in a $12.80 swing in either direction by Friday. The bear put spread profits anywhere from $658.31 (breakeven) down to $655 (max profit). That's a $3.31 range within the lower half of the weekly implied move window.
Notice the weekly implied range: $641.97 to $667.57. The maximum profit zone at $655 sits comfortably within what the market itself considers a plausible Friday outcome. The trader is not betting on a black swan - they're betting on the lower half of normal weekly volatility.
🎪 Catalysts
🔥 Immediate Catalysts - This Week (March 23-27)
Iran Peace Talks - Real or Fake? (TODAY's Catalyst)
Trump claimed "productive talks" with Iran today, sparking the 2.2% rally that lifted SPY toward $660. But Iran's Fars News Agency immediately denied any contact. If Iran's denial is accurate, today's rally was built on a false headline and could unwind sharply before Friday. The bear put spread trader appears to be betting on exactly this scenario.
Oil at $113/barrel - Brent crude remains near $113 as the Strait of Hormuz disruption risk persists. Every dollar oil rises is a drag on the S&P 500's non-energy components and a tailwind for inflation fears.
VIX at 24 - Volatility has pulled back from its early March spike above 30, but remains elevated at 24.06. This still-elevated VIX means options are priced to capture large moves - favorable conditions for a spread that benefits from actual downside.
📅 Near-Term Catalysts (Next 30 Days)
March CPI - April 10, 2026 - This will be the first CPI report to fully capture surging gasoline prices from the Iran conflict oil surge. February CPI was tame at 2.4% YoY, but March CPI is expected to show a meaningful jump as $113 oil filters into pump prices. A hot print could rattle the Fed.
March Jobs Report - April 4, 2026 - Labor market has been resilient with jobless claims dropping to 205,000 the week of March 14, but unemployment has edged up to 4.4%. Any crack in employment data could accelerate the growth slowdown narrative.
FOMC Meeting - April 28-29, 2026 - Market pricing roughly 15% probability of a rate cut at this meeting. The Fed held at 3.50%-3.75% at its March 18 meeting with only one cut projected for all of 2026 - a hawkish surprise given slowing growth.
Q1 2026 Earnings Season Begins - Mid-April 2026 - Consensus estimates call for +12.5% EPS growth YoY, but tariff impacts on margins and forward guidance uncertainty create elevated miss risk. JPMorgan estimates businesses will shift from absorbing 80% of tariff costs to just 20%, meaning Q1 guidance could see margin compression warnings.
✅ Already Happened (Recent Past)
- February 20, 2026: Supreme Court struck down IEEPA tariffs (6-3) - positive, but Trump immediately replaced them with Section 122 tariffs at 10-15%
- March 2, 2026: U.S.-Israel military operations against Iran began; markets sold off sharply
- March 8-9, 2026: Brent oil surpassed $100/barrel for the first time since 2022, eventually nearing $126
- March 13, 2026: Q4 2025 GDP revised down to 0.7% annualized from 1.4% advance estimate - significant growth slowdown signal
- March 18, 2026: Fed held rates steady at 3.50%-3.75%, only one cut projected for 2026 - restrictive stance with slow economy
🎲 Price Targets & Probabilities
Using Gamma Levels + Implied Move for Price Targets:
Based on the gamma structure and the weekly implied move of ±$12.80:
| Scenario | SPY Target | Probability | What Happens |
|---|---|---|---|
| 🐻 Bear Case (spread wins max) | ≤ $655 | ~30% | Iran denial confirmed, today's rally fully reverses. Max profit: $3.31/share |
| 🎯 Base Case (spread profits) | $655 - $658 | ~25% | Partial pullback, spread profitable but not at max |
| 😐 At Breakeven | $658.31 | ~15% | Spread at breakeven, neutral outcome |
| 📈 Bull Case (spread expires worthless) | > $660 | ~30% | Iran talks produce real progress, rally holds above $660 |
Key price levels to watch this week:
- 🎯 $660 - The critical line in the sand. This is the long put strike AND a major gamma resistance level with $313M total gamma. SPY needs to stay below here for this spread to be profitable at all
- 🎯 $658.31 - Breakeven point. SPY was trading at $660.89 when the trade was put on - that's only a $2.58 move needed for this trade to make money
- 🎯 $656 - Immediate gamma resistance (now support/resistance flip). The end-of-day price at $655.60 is already pressing against the $656 gamma wall from below
- 🎯 $655 - Maximum profit zone. The short put strike AND the strongest gamma support nearby. This is where the trade makes its full $3.31/share
- 🎯 $650 - Key next support if $655 breaks. Net gamma flips strongly negative here, meaning price moves could accelerate (market maker hedging amplifies moves)
The math on this trade:
- Net debit paid: ~$1.69/share
- Max loss: $1.69/share (if SPY stays above $660 by Friday - spread expires worthless)
- Max profit: $3.31/share (if SPY is at $655 or below by Friday)
- Breakeven: $658.31 (= $660 - $1.69)
- Risk/reward: 1.96:1 (risk $1.69 to make $3.31)
Translation: For every dollar risked, this trade can make almost two dollars back. That's a favorable risk/reward that explains why a sophisticated trader used a spread rather than outright puts.
💡 Trading Ideas
🛡️ Conservative - "The Cautious Bear" (Only if you have existing long exposure to hedge)
Idea: Buy the same bear put spread (Buy 2026-03-27 $660 put / Sell 2026-03-27 $655 put) as a cheap hedge against existing SPY or S&P 500 long positions.
- Cost: ~$1.69 net debit per share ($169 per spread)
- Why this works: With SPY currently at ~$655-$656, this spread is nearly ATM. If SPY drops back toward $655 by Friday, you profit. If the Iran peace rally continues, you only lose the $1.69 premium - a defined, small cost for protection into a binary geopolitical headline
- Best for: Anyone holding SPY, QQQ, or index fund positions who wants cheap short-term protection before the Friday close
- Probability consideration: You need just a modest pullback from $655.60 to $655.00 for max profit - that's less than 0.1%
⚠️ Note: These contracts expire Friday, March 27 - this is a very short-dated position with extreme time decay. Theta (time decay) will eat into this spread rapidly with only 4 days left.
⚖️ Balanced - "The Directional Spread Player"
Idea: Replicate the whale's spread in smaller size for a near-term bearish directional bet, using the April 17 expiration instead for more time.
- Strategy: Buy APR-17 $655 put / Sell APR-17 $645 put
- Why this works: The April expiration (25 days out) gives you time for the macro bear thesis to play out - Iran denials confirmed, March CPI hot on April 10, or earnings guidance disappointments in mid-April. The $10 wide spread gives more room to work.
- Cost estimate: ~$3-4 net debit based on current implied move pricing
- Key catalyst to watch: March CPI on April 10 - a hot print could be the trigger that restarts the selloff
- Max profit: If S&P 500 continues lower to 5,600 (SPY ~$645), this spread pays out in full
🚀 Aggressive - "The Front-Week Momentum Rider"
Idea: Directional bet alongside the whale - buy the March 27 $660/$655 bear put spread outright if SPY pops back toward $658-$660 on any Iran "progress" headlines.
- Entry target: Buy the spread if SPY bounces back to $658-$660 range (getting closer to ATM again)
- Why this works: Today's trade was placed when SPY was at $660.89. If SPY rallies on more Iran talk headlines and approaches $660 again, you'd be entering the spread at near-identical conditions the whale used
- Risk: 100% of premium paid if SPY stays above $660. This expires in 4 days - there is NO safety net
- Key watch: Iran news flow over the next 48 hours. Any confirmation that Trump's "productive talks" claim was fabricated = catalyst for the bear case
- ⚠️ This is a high-risk, short-duration bet appropriate only for traders who can afford to lose the entire premium and who actively monitor positions
⚠️ Risk Factors
What could blow up the bear spread thesis:
❗ Iran peace talks prove real - If any genuine de-escalation occurs over the next 4 days, oil could drop sharply toward $80-90 and equities would rally hard. The $660 puts would expire worthless and the entire $1.69 net debit is lost. Today's [SPY] move of +2.2% shows how quickly the market reprices on Iran headlines.
❗ Fed pivot signal - Any unexpected dovish signal from a Fed official before Friday could ignite a risk-on rally. Fed Chair Powell has been careful but a surprise could trigger short covering.
❗ Gamma squeeze upward - With SPY at $655.60, it's sitting right at the strongest gamma support ($655). A squeeze through $655 upward (short covering, stop-loss triggers for bears) could see SPY rip back to $660-$665 quickly given the gamma concentration at those levels.
❗ Theta decay is brutal - With 4 days to expiration, time decay accelerates dramatically. Every day SPY doesn't move lower, the spread loses intrinsic and extrinsic value rapidly. By Wednesday, if SPY is stuck near $656-$658, the spread is melting.
❗ Execution slippage risk - The whale used sophisticated two-fill execution to minimize market impact. Retail traders executing this spread will face wider bid-ask spreads at current volatility levels. SPY options are liquid, but even a $0.10 wide spread on each leg means paying an extra $0.20 in transaction costs on a $1.69 net debit.
❗ The whale could be wrong - Whoever placed this trade is smart and big, but institutional traders are not infallible. The Goldman Sachs and JPMorgan 40-45% recession probability estimate means the bear case is credible - but it's not a certainty. Wall Street year-end S&P 500 targets range from 7,100 to 8,100, all well above current levels.
🎯 The Bottom Line
Real talk: A well-resourced trader just structured a nearly-perfect bear put spread on the S&P 500 for $25.4M gross premium deployed, targeting a Friday expiration. The trade is already partially in the money as SPY closed at $655.60 - essentially right at the max profit zone of $655.
The backdrop is genuinely compelling for the bear thesis:
✅ Today's 2.2% SPY rally was based on a Trump claim Iran denied almost immediately ✅ Oil is near $113/barrel with the Strait of Hormuz risk unresolved ✅ GDP slowing to 0.7%, VIX still at 24, Fed on hold with only one cut projected for the year ✅ The entire gamma surface has a bearish bias (put gamma $3.2B vs call gamma $2.0B) ✅ SPY is pressing against immediate overhead resistance at $656 with the $660 strike acting as a ceiling
The risks are real too - 4 days is a short window, time decay is brutal, and any genuine Iran de-escalation would send oil plunging and stocks surging.
If you're watching this play out:
- 📉 Bear scenario: Watch for Iran to issue further denials or military developments this week. If oil stays above $110 and today's Iran rally fades, the path to $655 or below is open
- 📊 Neutral scenario: SPY consolidates $652-$658 into Friday - spread profitable but not at max
- 📈 Bull scenario: Real Iran talks confirmed, oil drops sharply, SPY rallies back through $660 - bear spread expires worthless
Mark your calendar for: March 27 (Friday) close - that's the moment of truth. And April 10 for the March CPI print, which will be the first data to capture the full oil price impact - a potentially major catalyst for the next leg of this macro story regardless of what happens this week.
⚠️ Disclaimer
This analysis is for informational and educational purposes only and does not constitute financial advice. Options trading involves substantial risk and may not be suitable for all investors. You can lose the entire amount invested in options positions. Past unusual activity does not guarantee future price moves. The institutional trade analyzed here reflects one participant's view and may be hedged against positions we cannot observe. Always do your own research and consult a qualified financial advisor before trading. Never risk money you cannot afford to lose.
Generated: March 23, 2026 | Option Symbols: SPY20260327P655 | SPY20260327P660