☀️ TAN: Someone Just Dropped Nearly $1M Betting Solar Bounces Back!
📅 March 4, 2026 | 🔥 Unusual Activity Detected
🎯 The Quick Take
A trader just loaded up on 4,636 call contracts on the Invesco Solar ETF (TAN), spending nearly $974K in premium on May $60 calls -- while TAN sits at just $54.70. Volume came in at 5.6x open interest, which screams brand-new position. This is someone making a bold bet that solar gets its groove back after a rough 10.7% pullback from the 52-week high.
💰 The Option Flow Breakdown
📊 What Just Happened
Here's the tape:
| Detail | Value |
|---|---|
| 🕐 Time | 11:36 AM ET |
| 📌 Ticker | TAN |
| 📈 Direction | BUY Call |
| 💵 Strike | $60 (May 15, 2026) |
| 📦 Size | 4,636 contracts |
| 💰 Premium | ~$974K (~$2.10/contract) |
| 🔢 Volume vs OI | 6,200 vs 1,100 (5.6x ratio) |
| 🎯 Z-Score | 39.28 -- EXTREMELY UNUSUAL |
| 🏷️ Strategy | Long Call (new position, standalone) |
| 💼 Notional Exposure | ~$25.4M |
🤓 What This Actually Means
Let me break this down. Someone walked in and bought over 4,600 May $60 calls on TAN -- at $2.10 a pop -- for roughly a million dollars. The volume was 5.6x the existing open interest, which tells us this is almost certainly a brand-new position, not someone adding to an old one. You don't see z-scores of 39.28 very often -- this kind of activity shows up maybe a handful of times a year on any given name.
Here's why this matters: TAN is trading at $54.70 right now. The $60 strike is about 9.7% out of the money. For this trade to break even, TAN needs to hit $62.10 by May 15 -- that's a 13.5% move higher in 72 days. That's aggressive, but it's not crazy when you consider TAN was just at $61.03 two weeks ago.
The trader is controlling $25.4M in notional exposure for under a million bucks. That's the power of options leverage -- and it tells you this person (or fund) has serious conviction that the solar pullback is overdone.
📈 Technical Setup / Chart Check-Up
TAN has been on a rollercoaster. The ETF ran all the way up to a 52-week high of $61.03 on February 18 after the Supreme Court struck down IEEPA tariffs, which was a huge structural win for solar imports. But then reality hit -- First Solar's weak 2026 guidance dropped the stock 14%, dragging TAN down with it. The ETF is now sitting at ~$54.70, down 10.7% from the peak.
The good news? TAN is still trading well above its 200-day moving average (~$47.36), so the long-term uptrend is intact. And we're right at accumulated volume support around $54, which is where this buyer appears to be stepping in.
YTD Chart
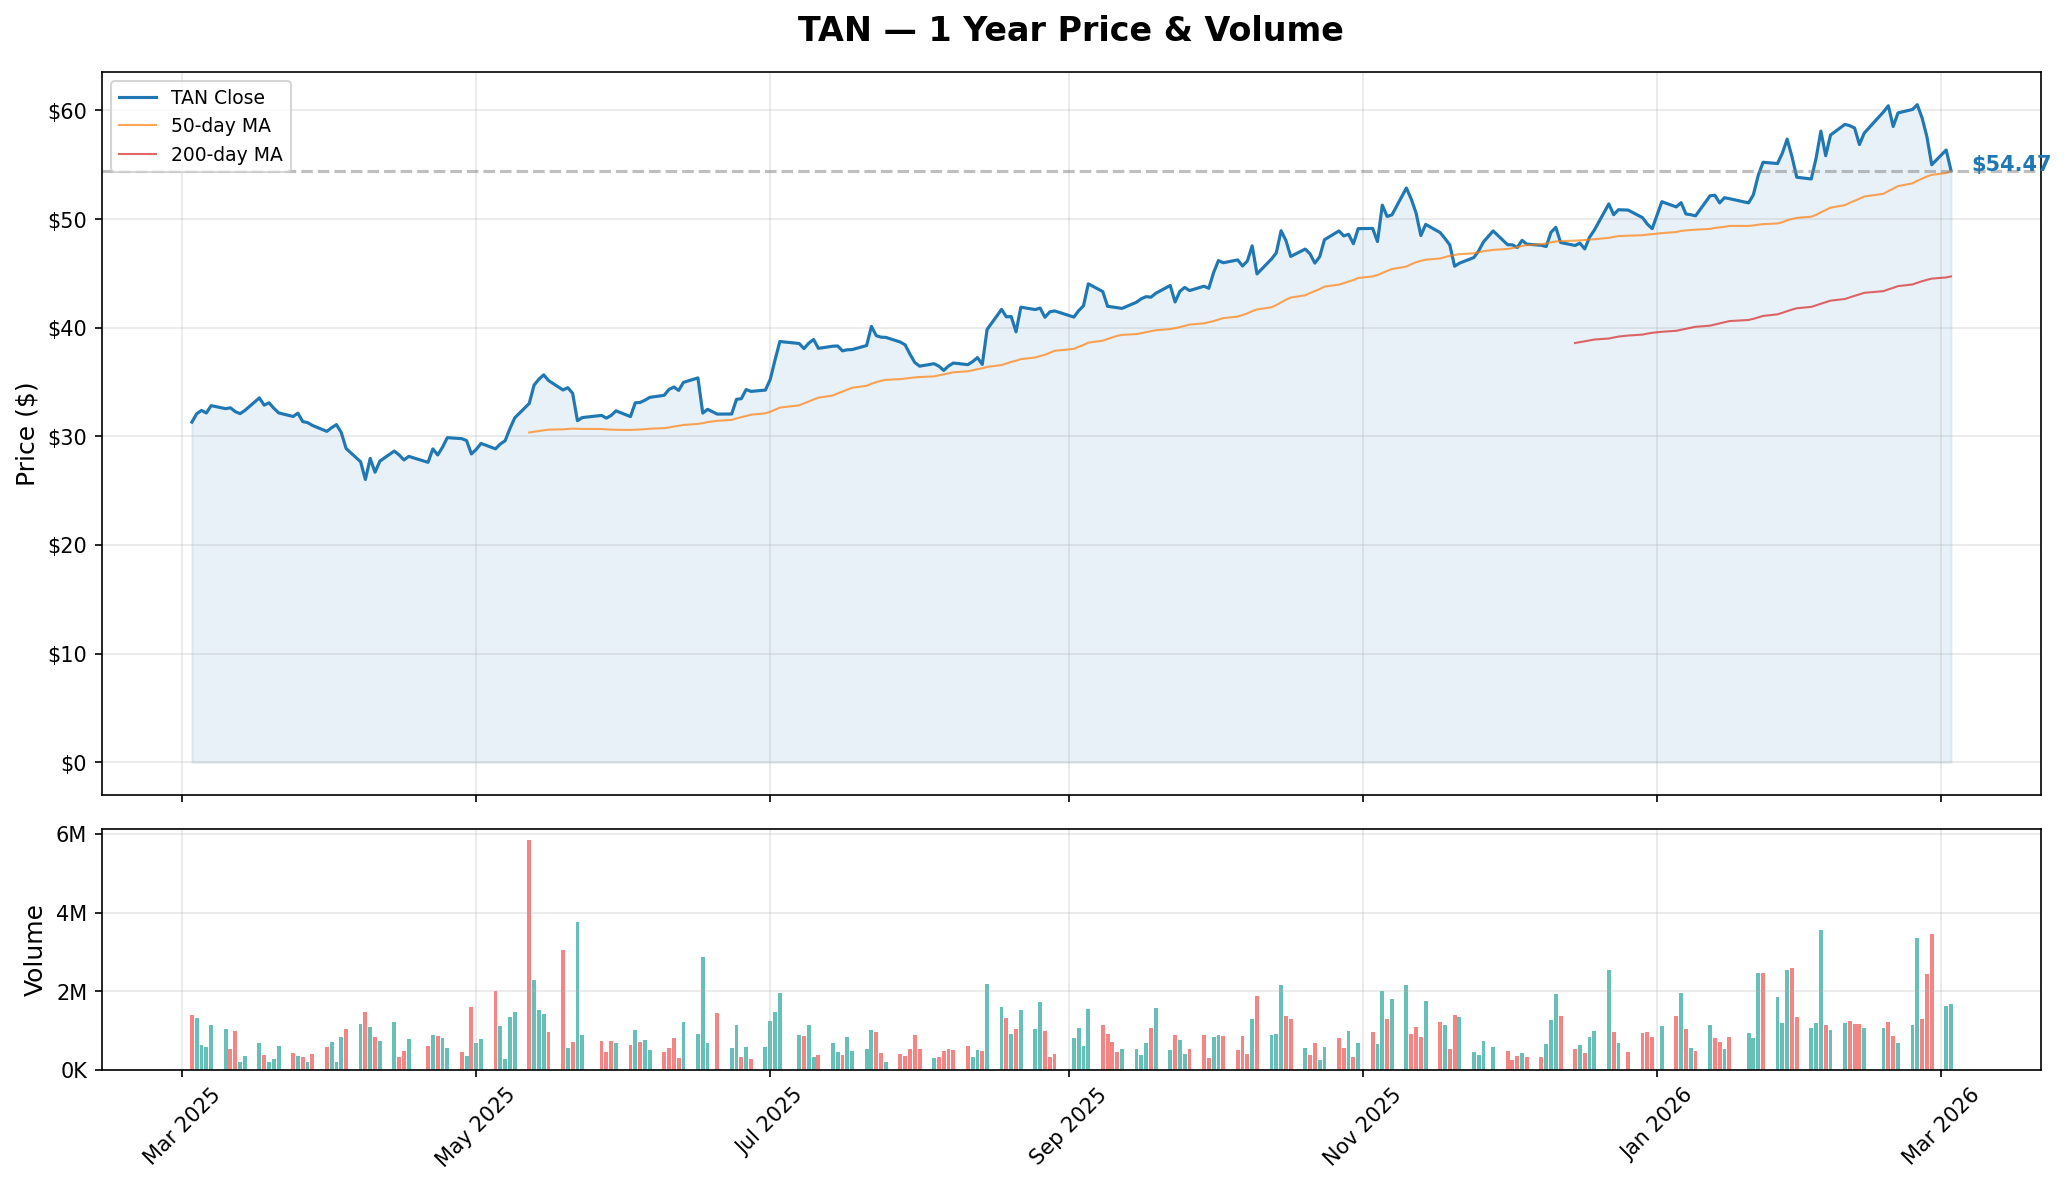
TAN surged from the low-$40s in early January to the $61 high in mid-February -- more than a 40% run-up -- fueled by the SCOTUS tariff ruling and Section 201 expiration. The current pullback is testing support, and this $974K call bet suggests at least one big player thinks the dip is a buying opportunity.
🔵🟠 Gamma-Based Support & Resistance
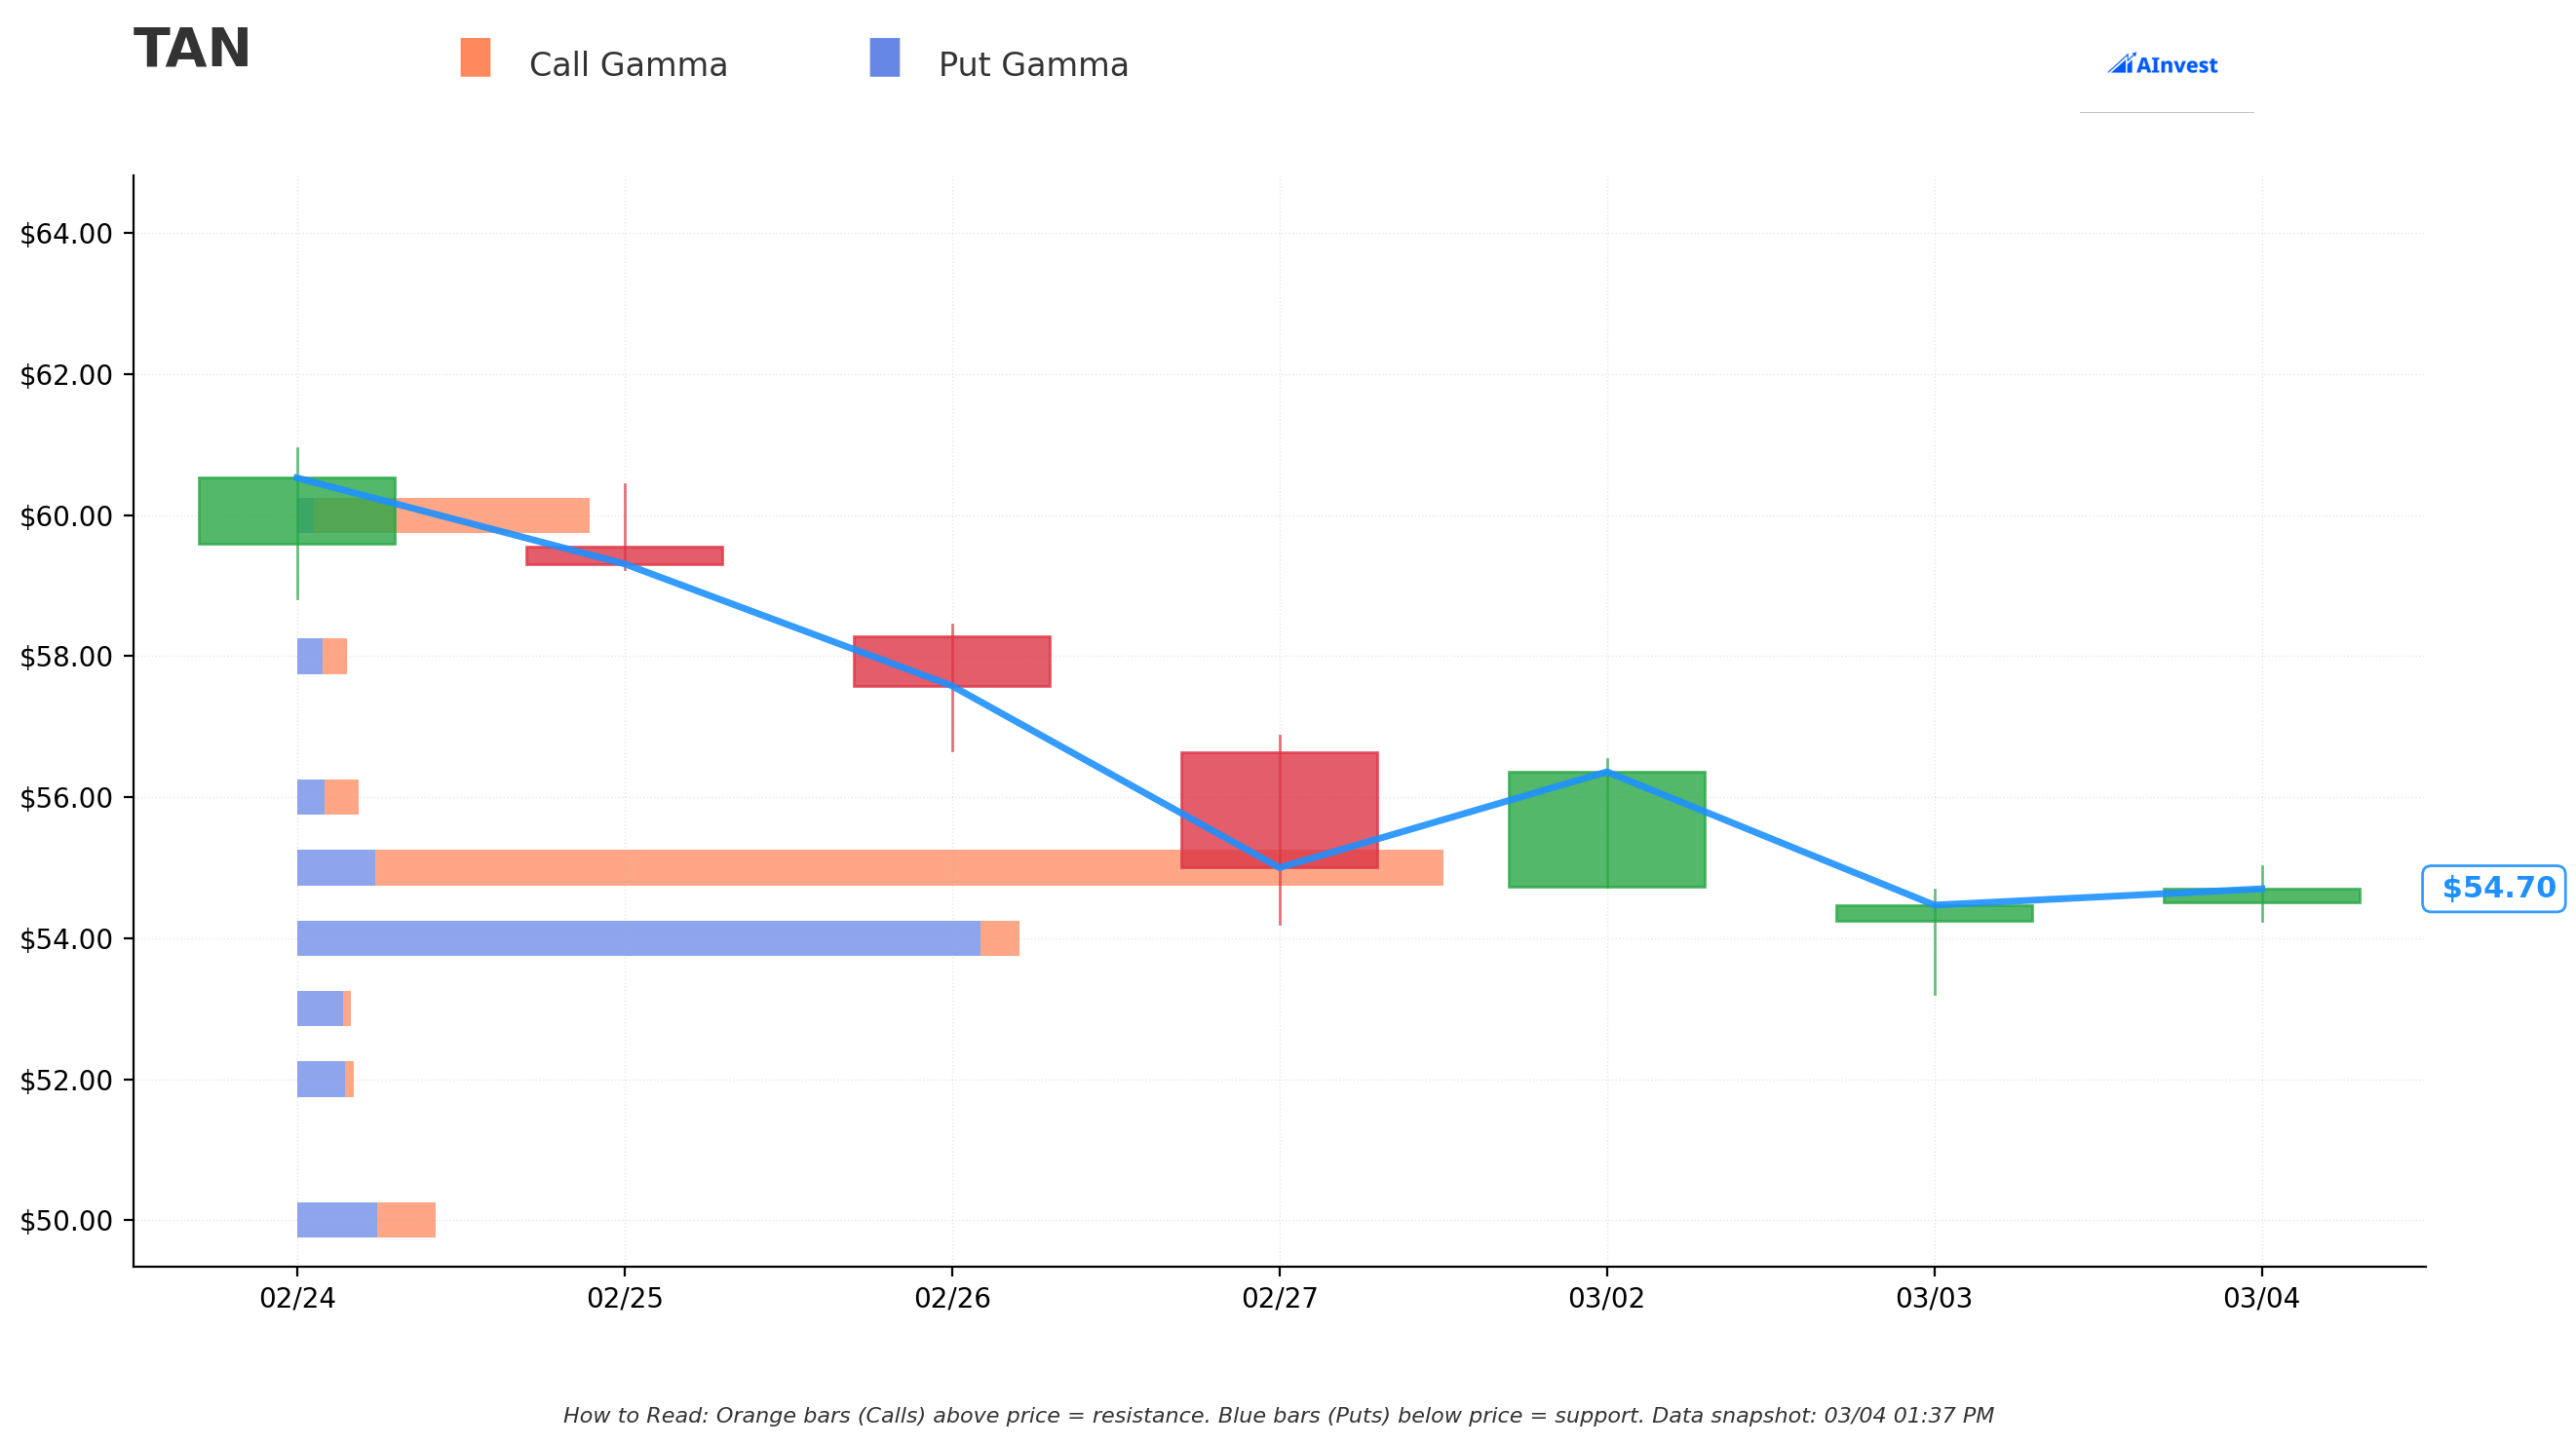
Key Gamma Levels:
The gamma exposure (GEX) profile for TAN shows open interest concentrated at several key strikes:
| Strike | Significance |
|---|---|
| 🟠 $60 | Major resistance / target -- and exactly where our whale is betting |
| 🟠 $65 | Upper resistance -- the aggressive bull case |
| 🔵 $55 | Near-term overhead -- needs to clear this first |
| 🔵 $50 | Strong support if $54 breaks |
| 🔵 $49 | Secondary support floor |
| 🔵 $44 | Max gamma strike -- deep support |
Think of these gamma levels as magnets. The $60 strike is where options activity is heavily concentrated, and it lines up perfectly with TAN's recent 52-week high zone. If the ETF can reclaim $55-$56, momentum could carry it back toward that $60 level -- which is exactly what this caller needs.
📊 Implied Move Analysis
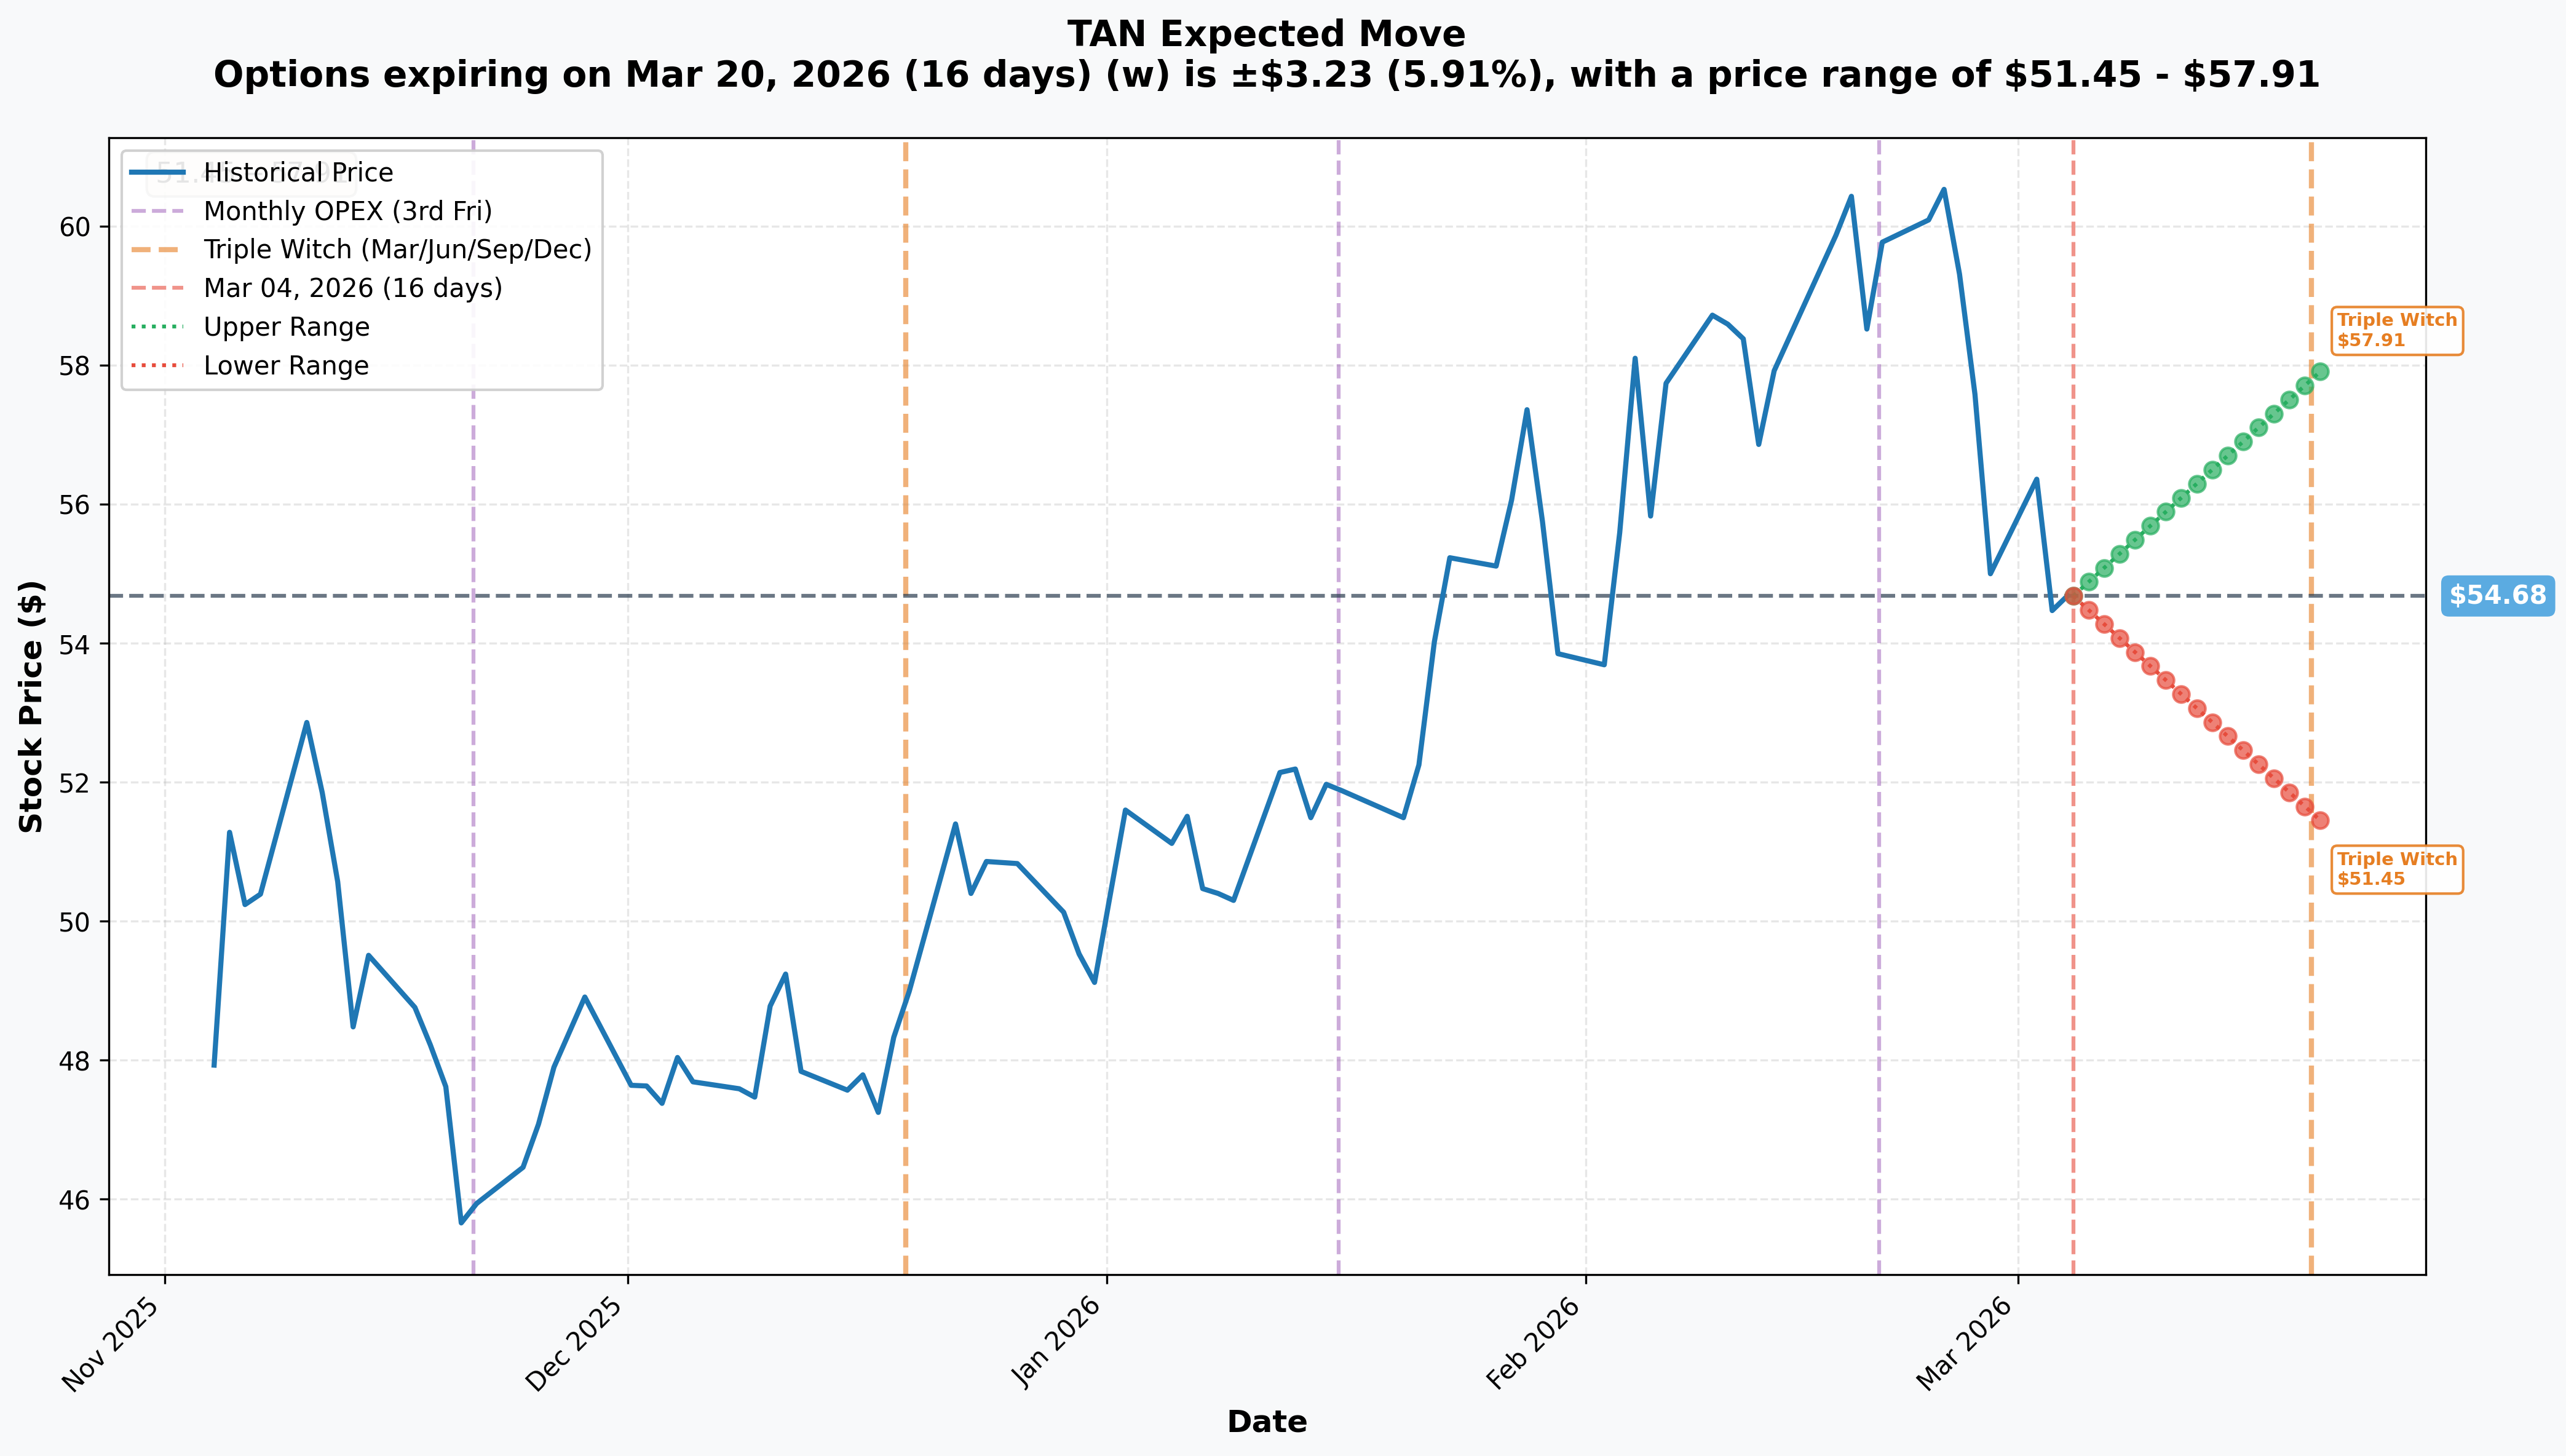
The market is currently pricing in a +/-5.9% move by March 20 (monthly OPEX / Triple Witch):
| Scenario | Price Level |
|---|---|
| 📈 Upper Range | $57.91 |
| 📉 Lower Range | $51.45 |
| 📅 Days to March OPEX | 16 |
This tells us the market expects TAN to stay in a roughly $51.45 to $57.91 range through March OPEX. The May $60 call buyer is looking beyond this near-term range -- betting that over the next 72 days, TAN breaks out of the upper implied range and retests the highs.
🎪 Catalysts
✅ What Already Happened (Setting the Stage)
📌 SCOTUS IEEPA Ruling (February 20) -- The Supreme Court struck down Trump's IEEPA tariffs in a 6-3 decision. This was a massive win for solar, removing the most punitive tariff layer on imported components. FSLR jumped 5.1% that day. The EIA projects 17% solar generation growth in 2026, and cheaper imports make that expansion more affordable.
📌 Section 201 Tariffs Expired (February 6) -- For the first time in eight years, imported solar panels aren't subject to Section 201 tariffs. These started at 30% back in 2018 and had declined to 14%. Now gone.
📌 First Solar Q4 Earnings Miss (February 24) -- FSLR delivered a $4.84 EPS miss ($5.19 expected) and guided 2026 revenue 17% below Street consensus. Stock cratered 14%. Multiple analysts downgraded to Hold. This is a big reason TAN pulled back.
📌 Sunrun Blowout Q4 (February 26) -- RUN crushed it with $1.16B revenue (+124% YoY), beating EPS estimates by 1,186%. Storage attachment rate hit 71%. Proof that the lease/PPA model for residential solar is thriving even without the 25D tax credit.
📌 SolarEdge Q4 (February 18) -- SEDG posted $335.4M revenue (+70% YoY) and beat EPS estimates, though the company remains in financial distress with an Altman Z-Score of -1.28.
📌 Nextracker Q3 FY2026 (January 27) -- NXT beat estimates and raised full-year guidance -- revenue up 34% YoY, authorized a $500M buyback, and achieved investment-grade credit rating. As TAN's largest holding at 10.14%, this matters.
📅 What's Coming (Mark Your Calendar)
| Date | Event | Why It Matters |
|---|---|---|
| 📌 March 12 | Canadian Solar (CSIQ) Q4 Earnings | ~3% of TAN; module shipment guidance sets tone for panel manufacturers |
| 📌 ~Late April | Enphase (ENPH) Q1 2026 Earnings | 7.3% of TAN; first full quarter without 25D residential tax credit -- THE demand litmus test |
| 📌 ~May 5 | SolarEdge (SEDG) Q1 2026 Earnings | 4.8% of TAN; bankruptcy watch -- cash burn is the metric |
| 📌 ~Late May | Nextracker (NXT) Q4 FY2026 Earnings | 10.14% of TAN; can they validate the raised guidance? |
| ⚖️ July 4 | OBBBA 48E/45Y Construction Deadline | Utility-scale projects must begin construction by this date -- creates a rush dynamic |
| ⚖️ ~Late July | Section 122 Tariff Expiration | 10% global tariff expires after 150 days unless Congress extends -- binary event |
Notice something? The May $60 calls expire right before the SolarEdge and Nextracker earnings and well after Enphase reports. This buyer is positioned to capture the Canadian Solar catalyst (March 12), any positive developments from the OBBBA construction rush, and the critical Enphase Q1 results that will reveal residential solar demand without the tax credit.
🎲 Price Targets & Probabilities
Based on the gamma levels, implied move ranges, and catalyst calendar:
🐻 Bear Case: $50-$51 (20% probability)
If TAN breaks below $54 support, the next downside target is the $50-$51 area, near the $49-$50 gamma cluster. This could happen if Canadian Solar's guidance disappoints, the federal lands permitting freeze worsens, or if broader market weakness drags solar down further. In this scenario, the May $60 calls expire worthless and the trader loses the ~$974K premium.
⚖️ Base Case: $55-$58 (50% probability)
TAN holds the $54 support, bounces back through $55, and grinds higher toward $57-$58 as the pullback stabilizes. The implied move upper range of $57.91 by March 20 supports this. The Enphase earnings in late April could be the catalyst to push toward $58. In this scenario, the May $60 calls are still slightly OTM but retain time value -- the trader could exit with a partial loss or small gain depending on timing and IV expansion.
🚀 Bull Case: $60-$62 (30% probability)
Multiple catalysts fire: Canadian Solar guides strong, Enphase shows resilient residential demand, and sentiment shifts bullish on solar heading into the Section 122 tariff expiration. TAN retests the February high of $61.03. This is the sweet spot for the trade -- at $62, those May $60 calls are worth $2 intrinsic, roughly breakeven. Above $62.10, it's pure profit. And remember, TAN was at $61 just two weeks ago.
💡 Trading Ideas
🛡️ Conservative: "The Solar Rebound Spread"
Strategy: Bull Call Spread on TAN
📌 Buy May 2026-05-15 $55 Call 📌 Sell May 2026-05-15 $60 Call 💰 Estimated Net Debit: ~$2.00-$2.50 🎯 Max Profit: ~$2.50-$3.00 (if TAN closes above $60 at expiration) 📉 Max Loss: Premium paid
Why this works: You're defining your risk upfront. If TAN bounces back to $58-$60 (which is where it was just two weeks ago), this spread captures most of the move. The short $60 call brings your cost down, making the breakeven much more achievable -- around $57-$57.50 instead of $62.10. Great for folks who believe in the solar rebound but want to keep risk tight.
⚖️ Balanced: "Follow the Whale"
Strategy: Long Call on TAN (mirroring the flow)
📌 Buy May 2026-05-15 $57.50 Call 💰 Estimated Cost: ~$2.50-$3.00/contract 🎯 Breakeven: ~$60.00-$60.50 📉 Max Loss: Premium paid
Why this works: Instead of going straight to the $60 strike like the whale, pick a strike closer to the money at $57.50. You get more delta exposure (higher probability of profit), and your breakeven is roughly the same as the whale's target. If TAN retests $61, you're looking at $3.50+ in intrinsic value on a $2.50-$3.00 investment. Wait for a close above $55 to confirm the bounce before entering.
🚀 Aggressive: "Solar's Second Wind"
Strategy: Long Call matching the whale's bet
📌 Buy May 2026-05-15 $60 Call (same as the flow) 💰 Cost: ~$2.10/contract 🎯 Breakeven: $62.10 📉 Max Loss: Premium paid
Why this works: This is the high-conviction play. You're riding alongside a trader who just put ~$974K on this exact position. If the Section 122 tariff narrative shifts, or if Enphase delivers a strong Q1, TAN could retest and break through the $61 high. The reward/risk is attractive if you believe multiple catalysts will stack -- $2.10 to make potentially $5-$8+ if TAN runs to $65-$68. But be honest with yourself: you need a 13.5% move to break even. Size accordingly -- this should be a small percentage of your portfolio.
⚠️ Risk Factors
👀 Policy Whiplash -- The Trump administration already replaced IEEPA tariffs with a 10% Section 122 tariff. If Congress extends it or finds new tariff authority, solar imports get hit again.
👀 Residential Demand Cliff -- The 25D residential solar tax credit expired at the end of 2025. Industry forecasts project a 13-25% drop in residential installations in 2026. Enphase's Q1 report will be the first real data point.
👀 SolarEdge Bankruptcy Risk -- SEDG carries a 4.8% weight in TAN and has an Altman Z-Score of -1.28 (distress zone). A bankruptcy filing would directly drag TAN lower.
👀 Federal Lands Freeze -- 18+ GW of solar projects are stalled on federal lands. Interior Secretary Burgum requires personal approval for all renewable energy decisions. This bottleneck isn't going away soon.
👀 First Solar Insider Selling -- FSLR CTO Jason Dymbort sold shares on March 3. Combined with the weak 2026 guidance, this doesn't inspire confidence from the largest domestic solar manufacturer.
👀 Breakeven is Steep -- The trade needs TAN at $62.10 to break even -- that's 13.5% higher. Even if you agree with the directional thesis, the risk/reward at the $60 strike is demanding.
🎯 The Bottom Line
Here's the deal: someone just placed a nearly $1M bet that TAN recovers from its 10.7% pullback and retests the $60+ level by mid-May. The trade is aggressive -- 9.7% out of the money with a 13.5% breakeven -- but the fundamental backdrop isn't bad. The SCOTUS IEEPA ruling is a structural positive, Sunrun's blowout earnings prove residential solar via the lease model can thrive, and Nextracker is firing on all cylinders.
If you're bullish: The bull call spread ($55/$60) is the smartest way to play the rebound thesis without needing a 13.5% move. It profits if TAN just gets back to the mid-to-upper $50s.
If you're watching: Keep an eye on Canadian Solar earnings March 12 and the $54 support level. A break below $54 changes the picture. A bounce and close above $55 is your green light.
If you're bearish: The permitting freeze, residential demand cliff, and SolarEdge bankruptcy risk are real headwinds. But with put/call ratio at 0.60 (bullish skew) and the ETF still well above its 200-day MA, the bears need a catalyst to break $54.
📅 Mark your calendar: Canadian Solar earnings March 12, Enphase late April, and the Section 122 tariff expiration in late July. These are the three events that will decide whether this $974K bet pays off.
⚠️ Disclaimer: This analysis is for informational purposes only and does not constitute financial advice. Options trading involves substantial risk of loss and is not suitable for all investors. Always do your own research and consult with a qualified financial advisor before making any investment decisions. Past performance does not guarantee future results.