🔋 TLN: $102M Nuclear Power Short Call Position - Covered Call or Profit Lock?
📅 December 19, 2024 | 🐋 MASSIVE Institutional Activity Detected
🎯 The Quick Take
Someone just sold $102 MILLION in TLN call options at the $370 strike (Dec 2026), and here's the kicker - the stock is already trading ABOVE that at $373! This is one of the largest option positions we've tracked, with z-scores ranging from 1,935 to 5,355 (several times per year level of unusual activity). This is either a massive covered call position selling upside on existing shares, or a calculated bet that nuclear power stocks won't exceed $370 over the next year despite the AI datacenter boom.
🏢 Company Overview
Talen Energy Corporation (TLN) is an independent power producer and energy infrastructure company with a market cap of $17 billion. Operating 10.7 gigawatts of power generation capacity across the Mid-Atlantic and Montana regions, TLN sits at the intersection of nuclear power and the explosive AI datacenter demand story. The company owns the Susquehanna nuclear facility and has a landmark $18 billion power purchase agreement with Amazon AWS to supply up to 1,920 MW of carbon-free nuclear electricity to data centers.
Industry: Electric Services | Market Cap: $16.98B | Stock Performance: Up 100%+ YTD despite November regulatory setback
💰 The Option Flow Breakdown
📊 What Just Happened
| Time | Symbol | Side | Type | Expiration | Strike | Premium | Volume | Z-Score | Option Chart |
|---|---|---|---|---|---|---|---|---|---|
| 12:37:11 | TLN | 🔴 SELL | CALL | 2026-12-18 | $370 | $35M | 4,700 | 1,935 | View Chart |
| 12:42:09 | TLN | 🔴 SELL | CALL | 2026-12-18 | $370 | $35M | 8,900 | 3,657 | View Chart |
| 12:45:13 | TLN | 🔴 SELL | CALL | 2026-12-18 | $370 | $32M | 13,000 | 5,355 | View Chart |
📊 Total Position:
- Total Volume: 26,600 contracts (2.66 MILLION shares)
- Total Premium Collected: $102 MILLION
- All Same Strike: $370
- Current Stock Price: $373.10 (already $3.10 ITM!)
🤓 What This Actually Means
Real talk: This is NOT a bearish bet - this is either a massive covered call strategy or profit protection. Here's why:
Scenario 1: Covered Call (Most Likely) Someone owns 2.66 million shares of TLN (worth ~$990M at current price) and just sold calls against their entire position to collect $102M in premium. This is classic institutional income generation - they're willing to cap their upside at $370 in exchange for $102M in immediate cash. Even if called away at $370, they still make money on shares bought below that level PLUS keep the premium.
Scenario 2: Position Lock-In After TLN's 100%+ run this year (from ~$150 to $373), this could be a long shareholder saying "I'm good with $370 max price" and collecting massive premium to offset any downside. If TLN stays below $370 by Dec 2026, they keep shares AND the $102M. If it goes higher, they sell at $370 (still a great exit) and keep the premium.
Why this ISN'T a naked short call:
- Too risky: Unlimited loss potential if TLN explodes higher
- Margin requirements would be astronomical
- The consistency (same strike, same expiration, sequential trades) suggests portfolio management, not speculation
The $370 Strike is KEY:
- Current resistance appears to be psychological at this level
- Stock is RIGHT AT the strike ($373.10)
- This creates a "pin zone" where market makers may work to keep price near $370
- If this is covered, the seller is essentially saying: "I don't think we go meaningfully above $370 in the next year"
📈 Technical Setup & Chart Analysis
📊 YTD Performance
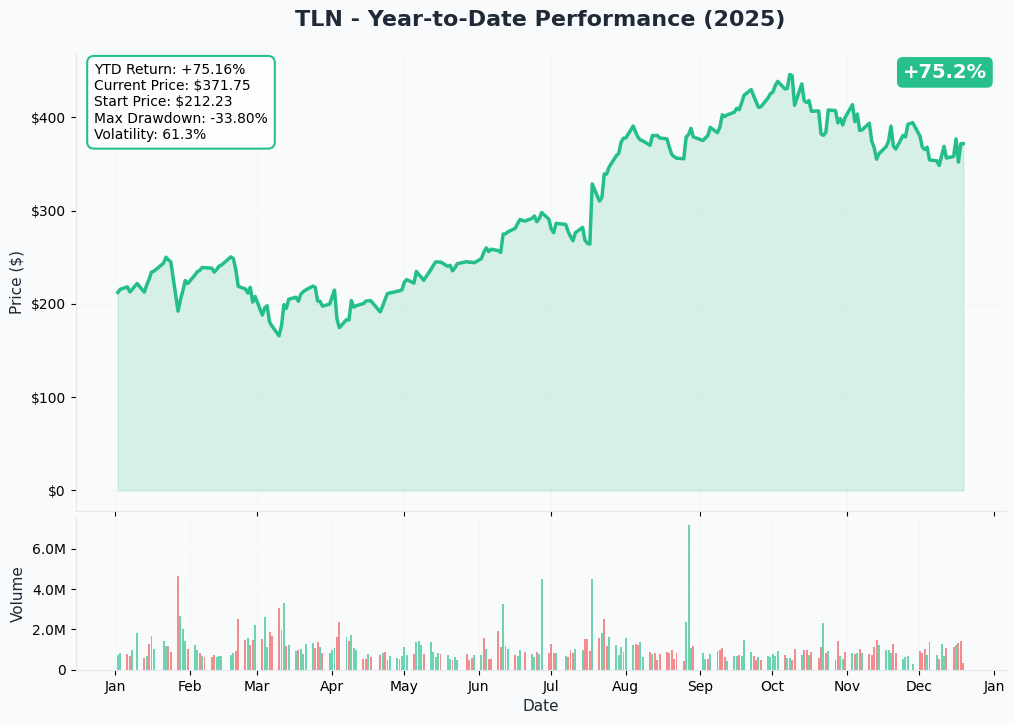
TLN has been on a rocket ship trajectory in 2024, surging over 100% year-to-date. The stock climbed from around $150 at the start of the year to current levels near $373, driven by the Amazon AWS nuclear power deal, record-high PJM capacity auction prices ($805M annual revenue for 2026/2027), and explosive AI datacenter power demand. However, November brought a significant pullback after FERC rejected the original behind-the-meter arrangement with Amazon - the stock tumbled ~25% before stabilizing. The recent restructure to a "front-of-the-meter" $18B PPA in June 2025 resolved regulatory concerns, but the chart shows the stock is still consolidating around $370-$390 levels.
Key Observations:
- 📈 Strong uptrend throughout 2024 with multiple breakouts
- 💔 Sharp November selloff on FERC news created overhead resistance
- 🎯 Current consolidation zone: $360-$390
- 📊 Volume has been elevated post-correction, indicating institutional repositioning
- ⚠️ Stock is near YTD highs but facing resistance at the $370 strike (where $102M in calls were sold)
⚡ Gamma-Based Support & Resistance Analysis
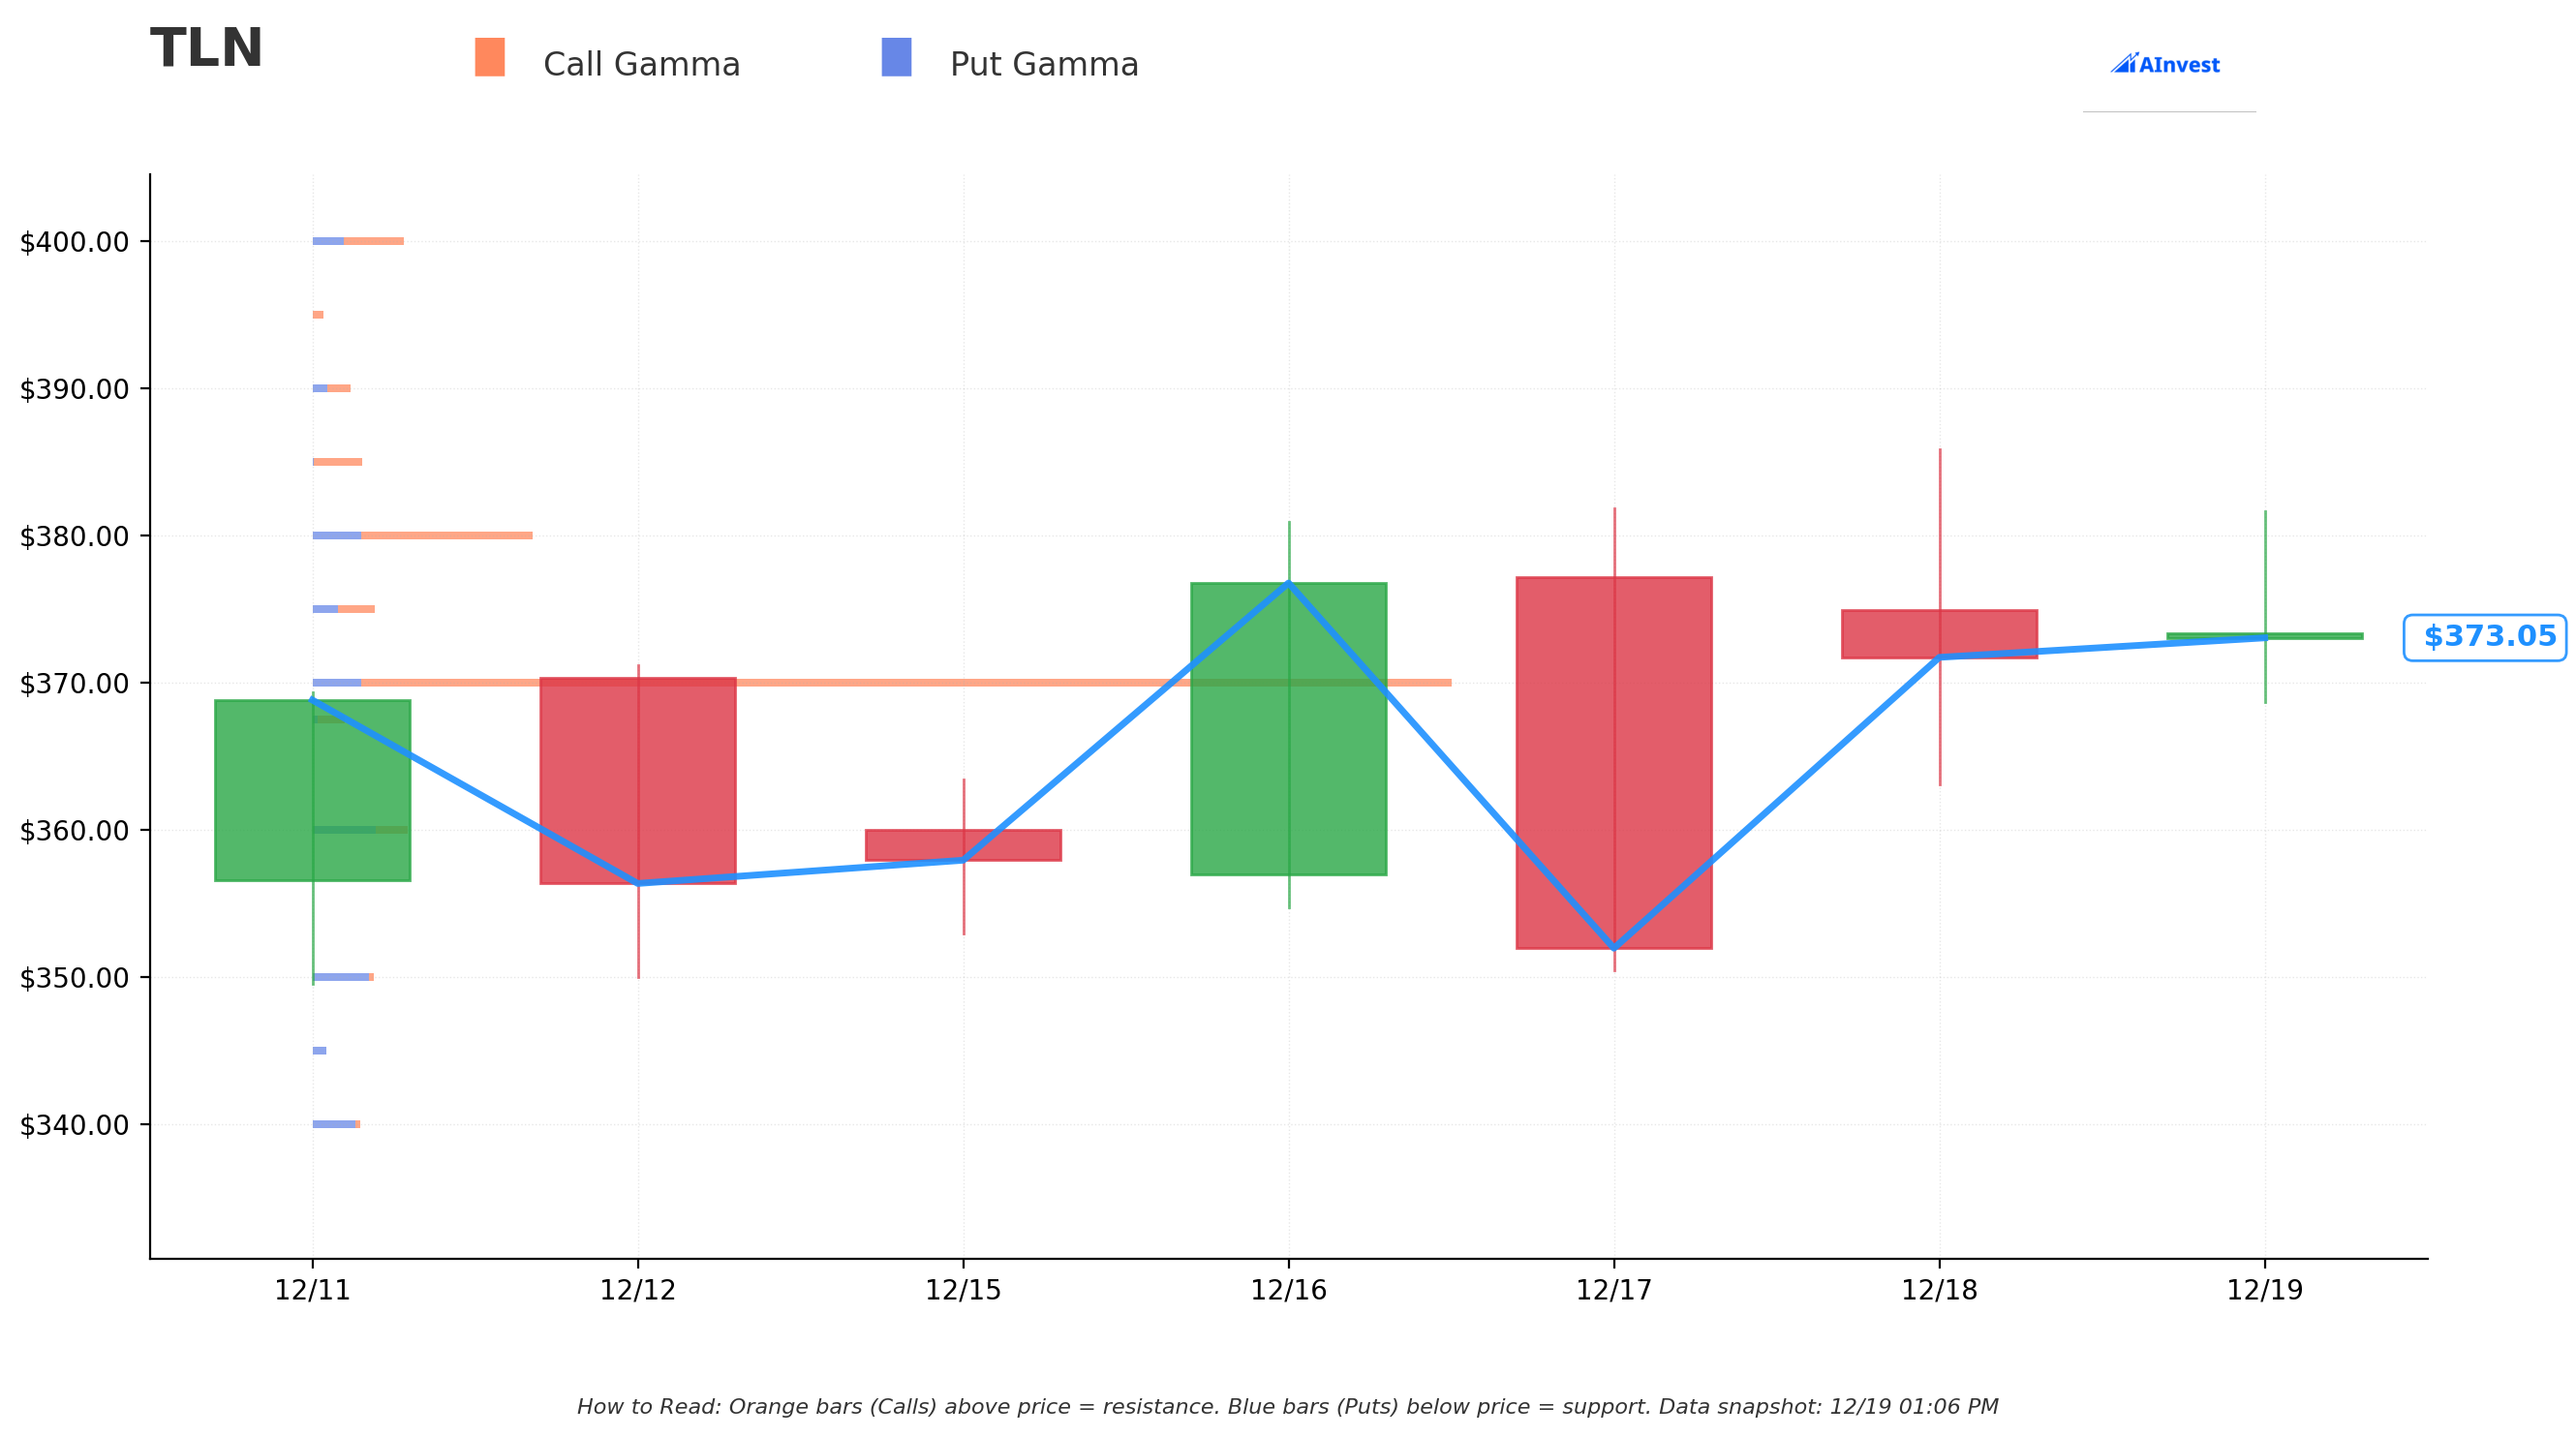
Current Price: $373.10
Support Levels (Put Gamma - Blue Bars):
- 🛡️ $370.00 - VERY STRONG SUPPORT (Net GEX: 9.67B)
- This is THE critical level - massive put gamma concentration
- The same strike where $102M in calls were sold (creates two-way pin)
- This level should act as a major magnet for price action
- If we break below, next support is significantly lower
Resistance Levels (Call Gamma - Orange Bars):
- Currently NONE identified above price
- This is unusual and suggests upside is relatively open from a gamma perspective
- The short call position at $370 may CREATE artificial resistance as dealers hedge
- Market makers who bought those 26,600 calls will sell stock as price rises above $370 (negative gamma hedging)
What This Means for Traders: The gamma profile is heavily concentrated at $370, creating a "gravitational pull" toward this strike. Think of it like a black hole - price wants to orbit around $370 into expiration. The massive short call position REINFORCES this effect because:
- Dealers who are long those calls will hedge by shorting stock above $370
- Put buyers at $370 create additional dealer buying support below
- This creates a "pin zone" where $370 becomes both floor and ceiling short-term
🎢 Implied Move Analysis
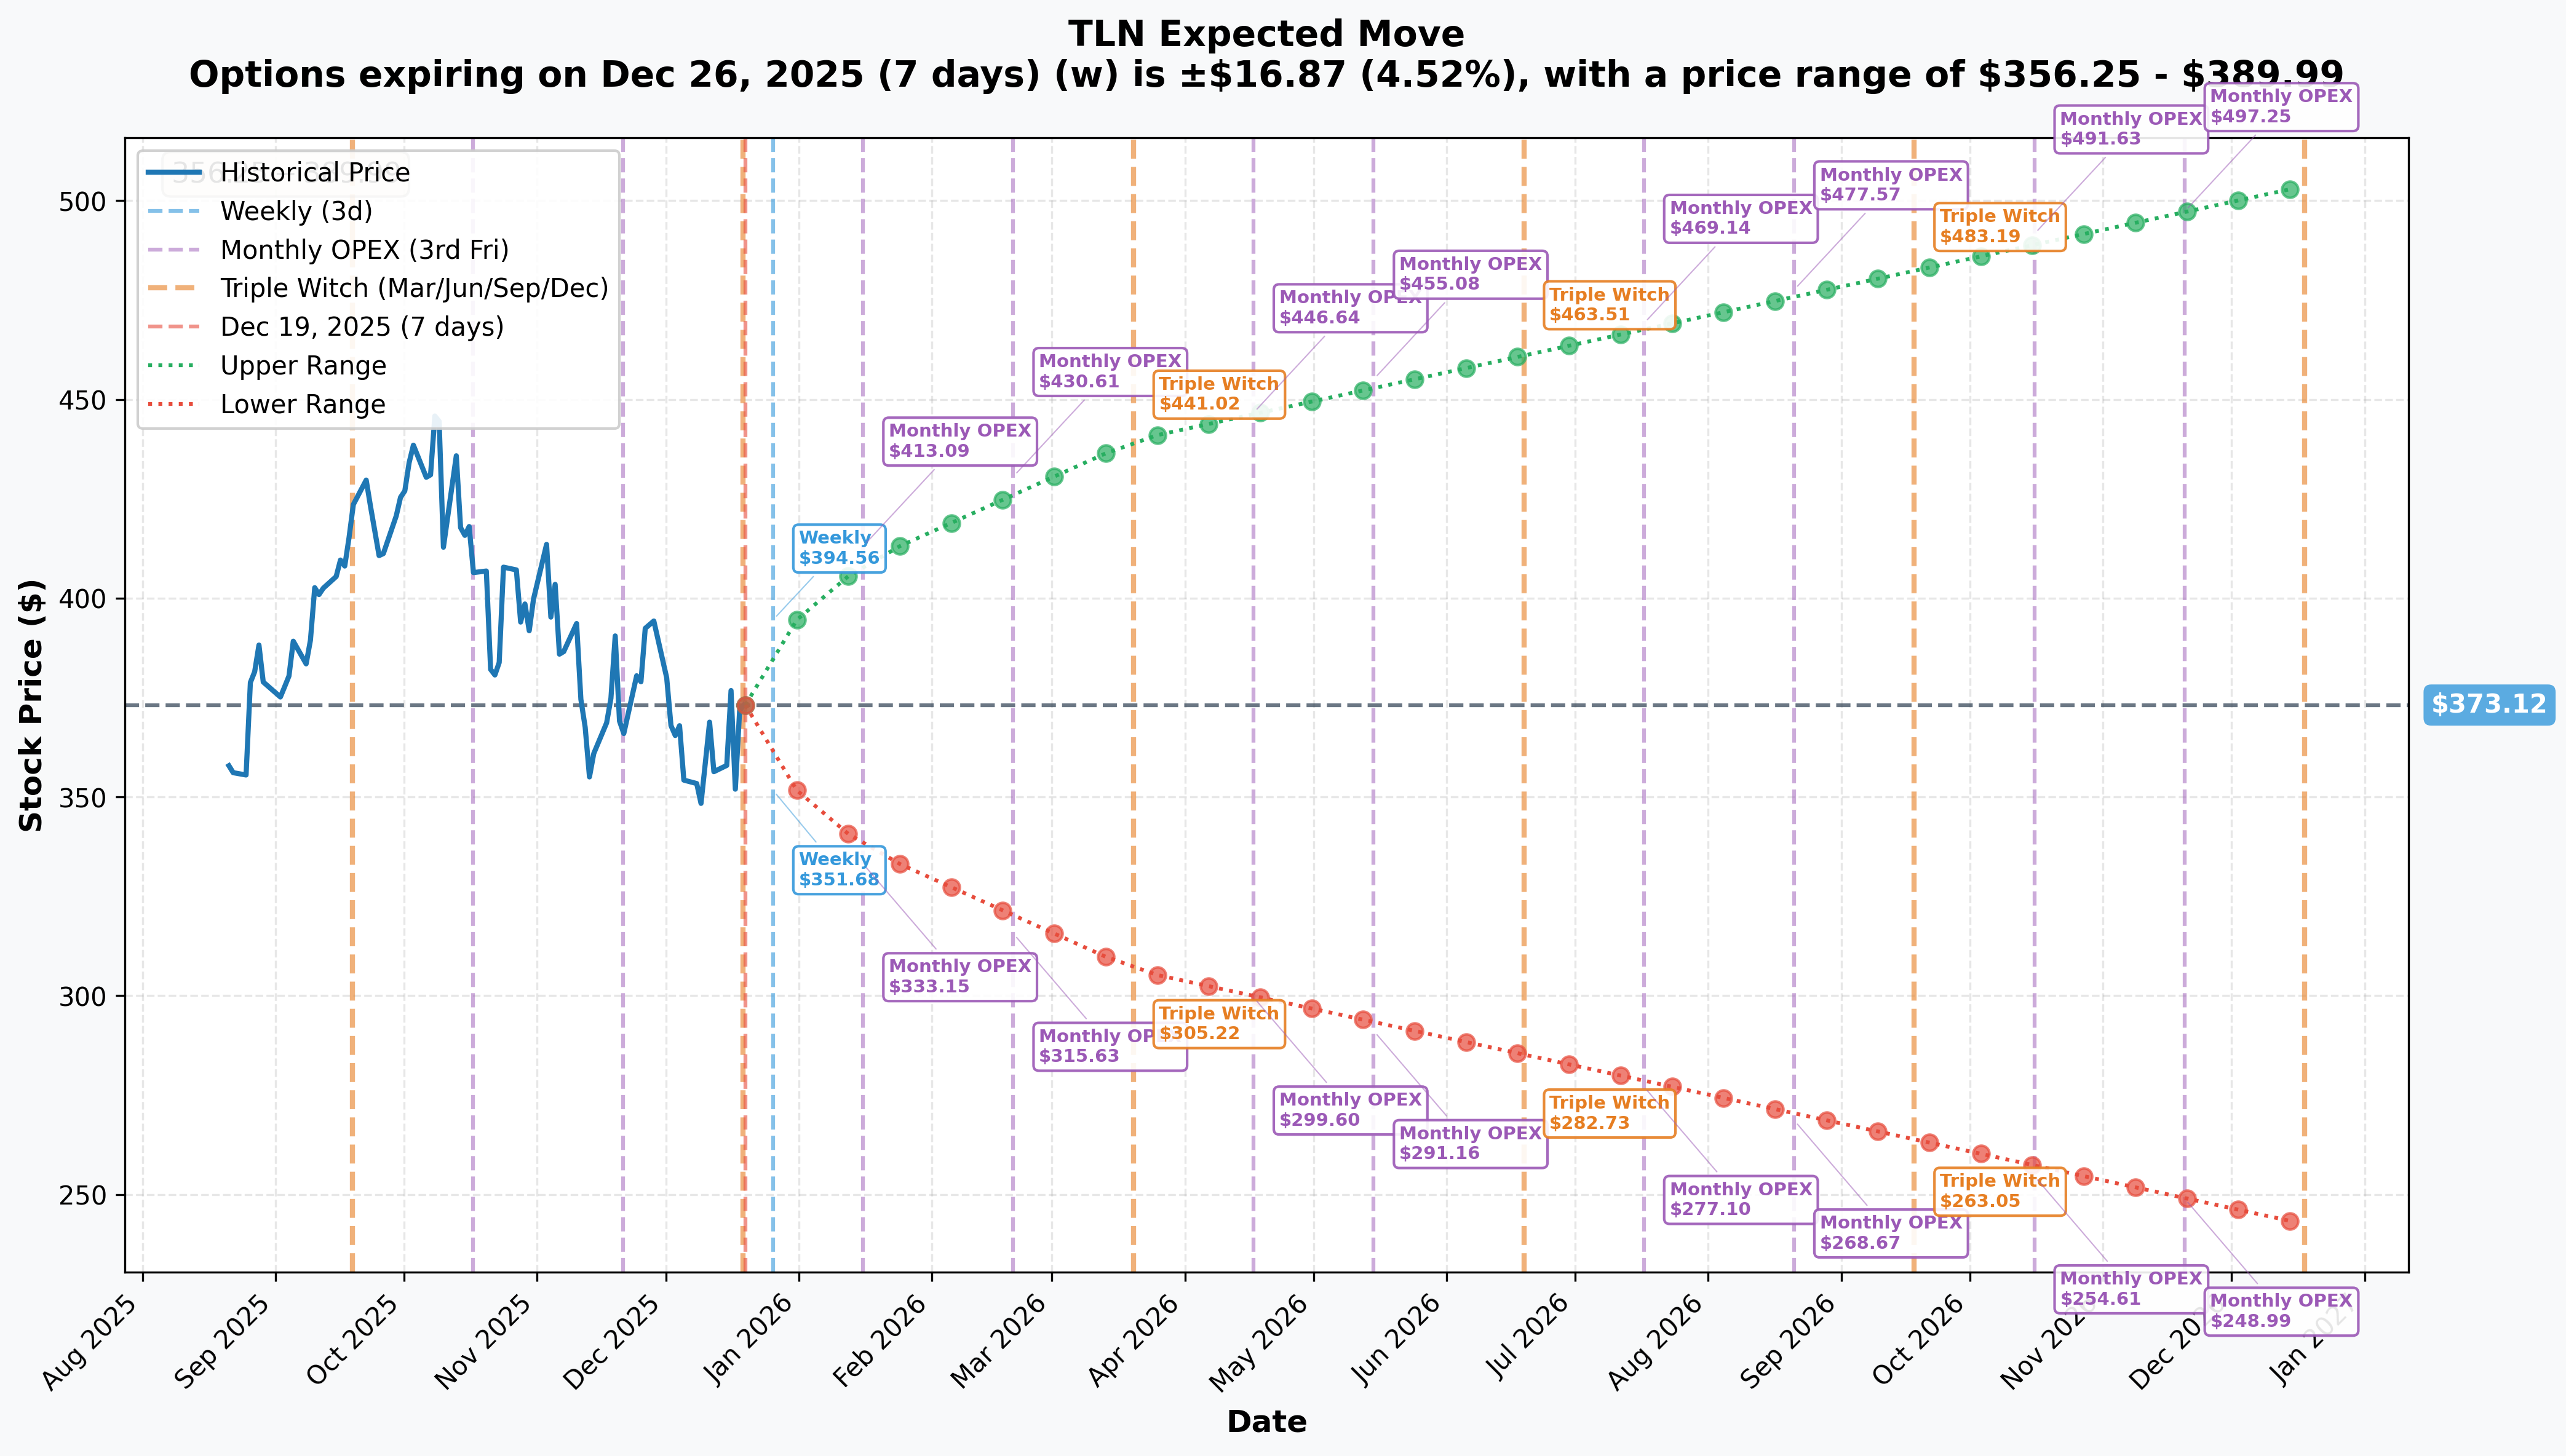
The options market is pricing in SIGNIFICANT volatility across all timeframes:
Weekly Move (Dec 26, 2024):
- Expected Range: $356.25 - $389.99 (±4.52%)
- Translation: Market expects $17 swing in the next week
- Current price ($373) is dead center of this range
Monthly OPEX (Jan 16, 2026):
- Expected Range: $337.04 - $409.20 (±9.67%)
- Translation: Market sees potential for $72 range over next month
- This is HIGH volatility for a $17B market cap company
Quarterly Triple Witch (March 20, 2026):
- Expected Range: $306.39 - $439.85 (±17.88%)
- Upper bound of $440 well above the $370 short call strike
- Suggests market doesn't agree with the $370 cap thesis
Yearly LEAPS (Dec 18, 2026 - THE EXPIRATION):
- Expected Range: $242.43 - $503.81 (±35.03%)
- Translation: Options market sees TLN potentially anywhere from $242 to $504 by expiration
- Upper range at $504 is 36% ABOVE the $370 short call strike
- This is where things get interesting...
Critical Insight: The Dec 2026 implied move suggests a 35% volatility expectation, with the upper range ($504) significantly exceeding the $370 strike where $102M in calls were sold. This means:
- If the market is right, those short calls will finish in-the-money
- The seller is either comfortable capping gains at $370 OR expects volatility to decrease substantially
- The premium collected ($102M) provides ~10% downside cushion on the position
🎪 Catalysts & Events
🗓️ Upcoming Catalysts (What's Ahead)
Q4 2024 & Full Year Earnings - February 27, 2025 📊
- Date: Thursday, February 27, 2025, after market close
- Earnings Call: 4:30 PM EST
- Consensus EPS: $0.77 (413% YoY increase!)
- Why It Matters: First look at full-year 2024 results and 2025 guidance reaffirmation. Management expected to provide updates on:
- Full year Adjusted EBITDA (guidance: $750-780M)
- 2025 outlook (Adjusted EBITDA: $925M-$1.175B)
- AWS power delivery progress and timeline
- Natural gas acquisition integration status
- Commentary on record $805M capacity revenues for 2026
- Stock Impact: High - earnings have been major catalysts historically
- Source: Nasdaq Earnings Calendar
AWS Data Center Power Ramp Begins - Q1 2025 ⚡
- Timeline: Initial 120 MW power delivery to AWS starts Q1 2025
- Ramp Schedule: 240 MW by 2026, scaling to 1,920 MW "no later than 2032"
- Revenue Impact: Premium payments expected to add ~$70M annually from initial phases
- Why It Matters: This is the PROOF that the $18B Amazon deal is real and generating cash
- Stock Impact: Very High - validates the entire nuclear-to-datacenter thesis
- Source: Talen Investor Relations
Brandon Shores & H.A. Wagner RMR Revenue Start - June 1, 2025 💰
- Annual Revenue: $180 million in fixed Reliability Must-Run payments
- Duration: Through May 31, 2029
- Why It Matters: Highly predictable cash flow stream starting in 6 months
- Assets: Brandon Shores (1,370 MW coal) + H.A. Wagner (774 MW oil)
- Stock Impact: Medium - already announced but revenue start will boost cash flow metrics
- Source: Talen Settlement Agreement
Natural Gas Plant Integration - H2 2025 🏭
- Assets: Moxie Freedom (PA) and Ohio natural gas facilities
- Capacity: 3 GW of combined cycle gas turbines
- Impact: 50% increase in annual generation (40 TWh → 60 TWh)
- FCF Growth: Projected 40%+ boost to free cash flow per share in 2026
- Why It Matters: $3.5B acquisition needs to deliver on promised economics
- Stock Impact: High - integration success critical to maintaining valuation
- Source: Citizens Voice
Small Modular Reactor (SMR) Development - 2025-2026 🔬
- Partnership: AWS committed to exploring SMR development "within Talen's Pennsylvania footprint"
- Potential Capacity: 300-600 MW of new nuclear by 2030-2032
- Timeline: Site selection, permitting, and technology partner announcements expected
- Why It Matters: SMRs represent the next generation of nuclear power for datacenters
- Stock Impact: Very High if deal announced - but execution risk is significant
- Probability: 40-50% chance of operational SMR by 2032 (long-term, unproven tech)
- Source: Talen AWS Partnership Expansion
Additional Data Center Partnerships - Ongoing 🖥️
- Potential Partners: Microsoft, Google, Meta all seeking nuclear-backed datacenter power
- Why It Matters: Each hyperscaler deal could add $1-3B in contracted revenue
- Talen's Advantage: Front-of-the-meter structure avoids FERC co-location hurdles
- Stock Impact: Extreme - would validate repeatable business model
- Source: Utility Dive Analysis
📅 Recent Catalysts (Already Happened)
Amazon AWS Nuclear Power Agreement Restructure - June 11, 2025 ✅
- Deal Size: Finalized 17-year, $18 billion power purchase agreement
- Structure Shift: Changed from rejected "behind-the-meter" to "front-of-the-meter" grid-connected model
- Capacity: Up to 1,920 MW of carbon-free nuclear power
- Key Innovation: Bypasses FERC jurisdiction that killed original deal
- Timeline: Spring 2026 transition following transmission upgrades
- Stock Reaction: Major positive - removed regulatory overhang
- Source: Power Magazine
PJM Capacity Auction Results - July 22, 2025 ✅
- 2026/2027 Planning Year Results:
- Capacity Cleared: 6,702 MW
- Clearing Price: $329.17/MW-day (22% increase, hitting PJM price cap!)
- Expected Annual Revenue: ~$805 million
- Context: This represents a 10x increase from 2024/25 prices ($28.92/MW-day)
- Driver: Data center demand and reduced reserve margins in PJM
- Stock Reaction: Significant positive - validates revenue growth story
- Source: Talen PJM Auction Results
Q3 2024 Earnings Beat - November 14, 2024 ✅
- Q3 Revenue: $650M (beat estimates by 35%)
- Adjusted EBITDA: $230M for Q3
- Guidance Raised: 2024 EBITDA to $750-780M (from $720-780M)
- Free Cash Flow: Raised to $265-285M
- Stock Reaction: Positive initially, but overshadowed by FERC rejection days later
- Source: Talen Q3 Results
Share Repurchase Program Expansion - September 5, 2024 ✅
- Program Size: Upsized to $1.25 billion through Q4 2026
- 2024 Execution: Repurchased 13 million shares (22% of outstanding)
- Cumulative Impact: Reduced share count from ~59M to 45.96M
- Remaining Authorization: $1.08 billion capacity through 2026
- Why It Matters: Demonstrates confidence in cash generation and commitment to shareholder returns
- Source: Stock Titan
FERC Rejection of Original Amazon Deal - November 1, 2024 ❌
- What Happened: FERC rejected behind-the-meter co-location arrangement
- Stock Impact: TLN tumbled ~25% from November highs
- Resolution: June 2025 restructure to front-of-the-meter model solved the issue
- Current Status: Appeal pending in Fifth Circuit Court, but new structure bypasses need for FERC approval
- Source: CNBC
Natural Gas Acquisition - July 2024 ✅
- Assets Acquired: Moxie Freedom (PA) and Ohio natural gas facilities
- Deal Size: $3.5 billion
- Capacity Addition: 3 GW of combined cycle gas turbines
- Strategic Rationale: Diversifies beyond nuclear, adds dispatchable power for datacenters
- Stock Reaction: Positive - viewed as complementary to nuclear strategy
- Source: Nasdaq Bull Analysis
Index Additions - Q3/Q4 2024 ✅
- Nasdaq Global Select Uplisting: July 10, 2024
- Index Additions: S&P Total Market, S&P Completion, CRSP Total Market, CRSP Small Cap
- MSCI USA Small Cap: Added November 25, 2024
- Impact: Passive index funds acquired 6M+ shares in Q3-Q4 2024
- Institutional Ownership: Increased 45.65% in Q4 2024 alone
- Source: Fintel Analysis
🎲 Price Targets & Probabilities
Using the gamma levels, implied move data, and catalyst analysis, here's what the market is telling us:
🐂 Bull Case: $410-$440 (30% probability by Feb 2025, 45% by Dec 2026)
Price Target: $410 - $440 range
How We Get There:
- ✅ AWS power delivery starts on schedule (Q1 2025) and ramps successfully
- ✅ Q4 earnings beat consensus $0.77 EPS and 2025 guidance is raised
- ✅ Natural gas acquisition integration proceeds smoothly
- ✅ Additional datacenter partnership announced (Microsoft/Google/Meta)
- ✅ SMR development progress announced
- ✅ PJM capacity prices remain elevated in future auctions
Key Levels:
- $390 - Breaks out of current consolidation, triggers momentum buying
- $410 - Monthly OPEX implied move upper range (Jan 2026)
- $440 - Quarterly implied move target (March 2026)
Catalyst Drivers:
- February 27 earnings beat with strong 2025 guidance
- AWS power ramp success validates $18B PPA economics
- June 1 start of $180M annual RMR revenues provides cash flow boost
- Sector momentum from nuclear power demand (Constellation, Vistra comps)
Why This Matters: If TLN reaches $440, those 26,600 short calls at $370 are $70 in-the-money, representing a $185M loss to the seller (but they collected $102M premium, so net loss would be $83M). More likely scenario: if this is a covered call, the seller gets called away at $370 and misses the additional upside.
📊 Base Case: $350-$390 (50% probability through Dec 2026)
Price Target: $370 becomes the gravitational center
Most Likely Scenario: The massive $370 gamma concentration AND the $102M short call position create a "pin zone" where price oscillates around $370-$390 for the next several months. Think of this like a rubber band - price can stretch up to $390 or down to $350, but it keeps getting pulled back toward $370.
Supporting Factors:
- Strong support at $370 from put gamma (9.67B net GEX)
- Dealer hedging of the short calls creates selling pressure above $370
- Stock is already at $373 - right in the middle of the pin
- Implied moves suggest high volatility but centered on current price
- Consolidation pattern after 100% YTD run suggests digestion phase
Key Levels:
- $370 - Major support AND resistance (the "pin")
- $360 - Secondary support if we break the pin
- $390 - Upper bound of trading range
Catalyst Drivers:
- Steady execution of existing plans (no major surprises)
- AWS deal proceeds as announced
- Earnings meet but don't beat expectations
- No new datacenter partnerships announced
- General market conditions remain stable
What This Means for Option Sellers: If price stays in this range, the $370 short calls expire worthless or slightly ITM, and the seller keeps most/all of the $102M premium. This is the scenario they're betting on - stable to modest price action with premium decay working in their favor.
🐻 Bear Case: $300-$350 (20% probability)
Price Target: $320 - $350 range
How We Get There:
- ❌ AWS power delivery delayed or volumes lower than expected
- ❌ Earnings miss and/or 2025 guidance cut
- ❌ Natural gas acquisition integration issues
- ❌ Regulatory challenges resurface (FERC appeals, environmental opposition)
- ❌ Broader market correction impacts high-beta energy stocks
- ❌ Data center power demand moderates (AI investment slowdown)
- ❌ Susquehanna nuclear facility extended outage
Key Levels:
- $360 - Breakdown level from current consolidation
- $337 - Monthly implied move lower range
- $320 - Psychological support at prior resistance
- $306 - Quarterly implied move lower bound
Catalyst Risks:
- February 27 earnings disappoint
- AWS deal execution delays announced
- FERC appeal results in unfavorable precedent
- Environmental groups successfully challenge Brandon Shores/Wagner RMR extension
- Vistra or Constellation announce competing deals that pressure TLN's valuation premium
Why This Matters for the Short Calls: If TLN falls to $320, those $370 calls expire worthless and the seller pockets the full $102M premium. This provides substantial downside protection - the seller can afford a ~15% decline from current levels and still come out ahead thanks to the premium collected.
💡 Trading Ideas
🛡️ Conservative: The "Sleep Well at Night" Strategy
For: Risk-averse traders who want exposure but can't handle big swings
The Trade:
- Wait for a pullback to $360-$365 range
- Sell cash-secured puts at $350 strike (Jan 2026 monthly OPEX)
- Collect ~$15-20 per contract in premium
- Total capital required: $35,000 per contract
Why This Works:
- You're getting paid to potentially buy TLN at $350 (6% below current price)
- $350 is above the quarterly implied move lower range ($337)
- Strong gamma support at $370 makes $350 break unlikely
- If assigned, you own shares at effective cost of $330-$335 (after premium)
- If not assigned, you keep premium (~5% return in 1 month)
Risk Management:
- Only commit capital you'd be happy deploying in TLN shares
- Set aside cash reserves in case of assignment
- Max loss: If TLN goes to zero (theoretical), you lose $33,000/contract
- More realistic max loss: If TLN drops to $300, you're down ~$2,000/contract
Probability of Success: 70-75% (based on implied volatility and gamma support)
⚖️ Balanced: The "Follow the Whale" Play
For: Moderate risk tolerance, directional but hedged
The Trade:
- Buy shares at current price ($373)
- Sell the December 2026 $370 calls (SAME trade as the $102M flow!)
- Collect ~$38-42 per share in premium
- Net cost basis: $331-335 per share
Why This Works:
- You're literally copying a $102M institutional position
- Premium collected provides 10% downside protection
- If called away at $370, you still profit $35-39/share (10-12% return)
- If stock stays below $370, you keep shares AND premium (beat and hold)
- Max profit potential: $35-39/share + dividends over 12 months
Example:
- Buy 100 shares at $373 = $37,300 cost
- Sell 1 contract Dec 2026 $370 call = collect $4,000 premium
- Net investment: $33,300
- If called away at $370: Profit = $3,700 + $4,000 = $7,700 (23% return)
- If not called away: Keep shares at $333 cost basis + $4,000 premium
Risk Management:
- You cap upside at $370 (miss gains above that)
- If TLN tanks to $300, you're still down despite premium (loss = $3,300)
- Can roll the short call higher if stock breaks out above $390
Probability of Success: 60-65% (based on base case scenario)
🚀 Aggressive: The "Breakout or Bust" Speculation
For: High risk tolerance, willing to lose it all for asymmetric upside
The Trade:
- Buy March 2026 $390 calls (quarterly expiry)
- Cost: ~$25-30 per contract
- Position size: 10-20 contracts ($2,500 - $6,000 total risk)
Why This Could Work:
- Quarterly implied move upper range is $440 (well above $390 strike)
- AWS power delivery news (Q1 2025) could be massive catalyst
- February earnings could blow out expectations
- SMR announcement would send stock parabolic
- Sector momentum if Constellation/Vistra continue running
- Only need TLN to hit $415-420 to double your money
The Math:
- Breakeven: ~$415-420 by March 20, 2026
- 2x profit: TLN at $440+
- 5x profit: TLN at $500+ (top of yearly implied move range)
- Max loss: 100% of premium paid ($2,500 - $6,000)
Risk Management:
- ONLY use money you can afford to lose completely
- This is a lottery ticket, not an investment
- Set profit targets: Take 50% off at 2x, let rest ride
- Cut losses if TLN breaks below $360 support
- Don't hold to expiration - theta decay kills these fast
Probability of Success: 35-40% (making ANY profit), 15-20% (making 2x+)
Catalyst Timeline:
- February 27: Earnings - immediate volatility event
- Q1 2025: AWS power delivery starts
- March 20: Expiration date
⚠️ Risk Factors
🔴 Execution Risks
AWS Power Delivery Timeline ⚠️ The transition to the front-of-the-meter structure requires completion of transmission infrastructure by spring 2026. Any delays in transmission upgrades could push back the revenue ramp and disappoint investors expecting immediate cash flow. Additionally, the ramp to full 1,920 MW capacity "no later than 2032" is a LONG timeline with significant execution uncertainty. The market is pricing in success - delays will be punished.
Natural Gas Integration Challenges ⚠️ The $3.5B Moxie Freedom and Ohio acquisition must deliver the promised 40-50% FCF growth. Integration of large power generation assets is complex, and any operational issues, cost overruns, or lower-than-expected generation volumes could impact the bull thesis. Gas price volatility also introduces margin risk for the fossil fleet.
SMR Development Uncertainty ⚠️ Small modular reactor technology is largely unproven at commercial scale in the U.S. The regulatory approval timeline is highly uncertain (5-10 years minimum), and capital requirements could exceed $1-2B per 300 MW SMR. Probability of an operational SMR by 2032 is only 40-50%. If the SMR development fails or gets significantly delayed, it won't derail the core business but would remove a major growth catalyst.
🔴 Regulatory & Legal Risks
FERC Appeals Process ⚠️ Despite the June 2025 restructure, the original November 1, 2024 FERC rejection is under appeal in the Fifth Circuit Court. While the new front-of-the-meter structure bypasses FERC jurisdiction, an unfavorable precedent could limit future co-location opportunities and create regulatory headwinds for the broader nuclear-to-datacenter model.
Environmental Opposition ⚠️ The Brandon Shores and H.A. Wagner RMR extension through 2029 faces opposition from environmental groups like the Sierra Club. These are coal and oil-fired plants, and stricter emissions requirements or political pressure could force early retirement, eliminating the $180M annual revenue stream. Additionally, nuclear decommissioning costs and spent fuel storage remain long-term liabilities.
Evolving Co-location Regulation ⚠️ FERC Commissioner Mark Christie has warned that co-location could have huge ramifications for grid reliability and consumer costs. Future regulatory changes by FERC or state-level public utility commissions could restrict direct datacenter-power plant arrangements, even under front-of-the-meter structures. PJM grid operators may also impose new interconnection requirements that increase costs or complexity.
🔴 Competition & Market Risks
Larger Competitors with More Resources ⚠️ Vistra Corp (VST) and Constellation Energy (CEG) are much larger players with more diverse nuclear portfolios. Vistra's market cap is $68B (4x TLN) and Constellation is ~$80B (5x TLN). Both have announced competing datacenter partnerships and have the scale advantages to offer better pricing, more capacity, and greater geographic diversity. TLN's single nuclear site (Susquehanna) creates concentration risk - an extended outage could materially impact earnings.
Data Center Demand Could Moderate ⚠️ The bull case depends on explosive growth in AI datacenter power demand. However, if AI investment returns disappoint, hyperscaler capital discipline could reduce power demand growth. Alternative computing architectures (more efficient chips, liquid cooling, etc.) could also reduce power intensity per compute unit. According to the Department of Energy, projections range from 50 GW to 100 GW of new datacenter load by 2030 - that's a wide range reflecting significant uncertainty.
PJM Capacity Price Volatility ⚠️ While the 2026/27 auction cleared at the $329.17/MW-day price cap, future auctions could see prices decline if new generation comes online or demand growth slows. Regulatory changes to capacity market rules could also pressure prices. TLN's valuation assumes sustained high capacity revenues - a return to historical norms ($28/MW-day) would devastate earnings.
🔴 Financial & Operational Risks
Concentration Risk - Single Nuclear Facility ⚠️ Susquehanna represents 2.2 GW of TLN's 10.7 GW total capacity - roughly 20% of generation. An extended outage (refueling typically takes 30-40 days, but unplanned outages can last months) would materially impact earnings. The company already faced an extended Susquehanna outage in Q2 2025 that pressured results. Nuclear operational risks include safety incidents, equipment failures, and terrorism/security concerns.
Leverage & Liquidity Constraints ⚠️ TLN increased its Term Loan B facility from $600M to $850M to fund share buybacks. While net leverage of 2.1x is manageable, the aggressive $1.25B share repurchase program could constrain financial flexibility if power prices or AWS volumes disappoint. Rising interest rates increase debt service costs, and refinancing risk exists for 2025-2026 maturities.
The $102M Short Call Position Itself ⚠️ While we believe this is a covered call, if it's NOT fully covered (unlikely but possible), the seller faces unlimited loss potential above $370. Even if covered, the position creates a psychological ceiling - large institutional holders won't want to see their exit price threatened. This could create selling pressure on any rally above $380-390 as the position unwinds or rolls.
🎯 The Bottom Line
Real talk: This $102M short call position is one of the most fascinating institutional option trades we've tracked all year. Here's what it tells us:
What We Know:
- Someone is VERY confident TLN stays below $370 through December 2026 - confident enough to risk $990M in stock (if covered) or unlimited losses (if naked)
- The $370 strike is now THE critical level - it's both strong gamma support AND the strike where massive premium was sold. This creates a "pin zone" where price gravitates toward $370
- The trade structure suggests institutional sophistication - same strike, same expiration, sequential execution within 8 minutes. This is portfolio management, not speculation
- Premium collected ($102M) provides ~10% downside cushion - if this is covered, the seller can handle a drop to $335 and still break even
What This Means for You:
If you're BULLISH on TLN:
- Wait for weakness toward $360-365 before buying
- Expect resistance at $370-390 due to the short call overhang
- Major catalysts (Feb 27 earnings, Q1 2025 AWS power start, SMR announcements) could break the pin
- Targets: $410 (monthly move), $440 (quarterly move), $500+ (yearly move) if catalysts deliver
- Risk: You're fighting against $102M in short calls and dealers hedging those positions
If you're BEARISH on TLN:
- The $370 gamma support is extremely strong - hard to break below
- Selling call spreads above $390 makes sense (cap the upside others are capping anyway)
- Major risks: AWS deal success, additional datacenter partnerships, sector momentum
- Key levels to watch: Break of $360 opens up $337-350 range
If you're NEUTRAL/INCOME-FOCUSED:
- The "follow the whale" covered call strategy is attractive
- Selling puts at $350-360 strikes also makes sense given strong support
- Premium levels are elevated due to high implied volatility (35% annually)
- The base case is consolidation around $370 - perfect for option sellers
Mark Your Calendar: 📅
- February 27, 2025: Q4 earnings - expect fireworks
- Q1 2025: AWS power delivery begins - proof of concept
- June 1, 2025: $180M annual RMR revenue starts flowing
- December 18, 2026: The $102M short call position expires - will be interesting to watch!
My Take: The nuclear-to-datacenter thesis is real - the $18B AWS partnership, record PJM capacity prices, and explosive datacenter power demand are all confirmed. However, TLN has already run 100%+ this year, and someone with $102M to deploy thinks we've seen the top at $370 for the next 12 months. They might be wrong - quarterly implied moves suggest potential for $440+ - but they're putting SERIOUS money behind their conviction.
The smart play? Wait for consolidation, let the February earnings provide clarity, and then decide if you're with or against the $102M whale. In the meantime, income strategies around the $370 pin make a lot of sense. 💰
🔗 Related Resources
TLN Stock Page: https://www.ainvest.com/stock/TLN/
TLN Options Chain (Dec 2026 $370 Call): https://www.ainvest.com/options/TLN/?expiration=2026-12-18&type=call&strike=370
⚠️ Disclaimer
This analysis is for educational and informational purposes only and should not be considered financial advice. Options trading involves substantial risk of loss and is not suitable for all investors. The unusual option flow described may represent hedging activity, portfolio adjustments, or other institutional strategies that differ from directional speculation. Past performance is not indicative of future results. Always conduct your own due diligence and consider consulting with a licensed financial advisor before making investment decisions.
The analysis presented here is based on publicly available information and option flow data as of December 19, 2024. Market conditions, company fundamentals, and regulatory environments can change rapidly. Gamma levels, implied moves, and support/resistance levels are dynamic and subject to change throughout each trading day.
Options Greeks Disclaimer: Gamma-based support and resistance levels represent concentrations of dealer hedging activity and are not guaranteed price levels. These levels can shift dramatically based on option positioning changes, and should be used as one input among many in your trading decisions, not as standalone signals.
Analysis Date: December 19, 2024 Option Flow Detection: Z-Scores ranging from 1,935 to 5,355 Classification: EXTREMELY_UNUSUAL (several times per year activity level)