Tesla (TSLA) Options Analysis - September 26, 2025 📊
Quick Take 🎯
Hey traders! TSLA just lit up our unusual options scanner with some serious institutional activity. We're talking $238 MILLION in premium flowing through ultra-deep ITM LEAP calls - that's not your average retail trade, folks. Let's break down what the smart money is doing and how you can position yourself.
Company Overview 🚗⚡
Tesla, Inc. (TSLA)
- Market Cap: $1.40 trillion (yes, with a T!)
- Sector: Electric Vehicles & Clean Energy
- Current Price: $439.84
- YTD Performance: +16.0% (after being down -48% at the lows!)
- Employees: 125,665
- HQ: Austin, Texas
Tesla isn't just your electric car company anymore - they're a vertically integrated battery electric vehicle automaker, autonomous driving software developer, energy storage provider, and soon-to-be robotaxi operator. With 1.8 million vehicles delivered in 2024, they're the undisputed EV leader.
Today's Unusual Options Activity 🔥
The Big Money Moves
Check out what just came across the tape (all trades from 11:14:01):
| Time | Symbol | Buy/Sell | Type | Expiration | Premium | Strike | Volume | OI | Size | Spot | Option Price | Option Symbol |
|---|---|---|---|---|---|---|---|---|---|---|---|---|
| 11:14:01 | TSLA | BUY | CALL | 2027-12-17 | $121M | $30 | 3K | 1.8K | 3,000 | $427.92 | $404 | TSLA20271217C30 |
| 11:14:01 | TSLA | BUY | CALL | 2027-12-17 | $102M | $5 | 3.1K | 20K | 2,400 | $427.92 | $426.15 | TSLA20271217C5 |
| 11:14:01 | TSLA | BUY | CALL | 2027-12-17 | $26M | $5 | 661 | 20K | 600 | $427.92 | $426.15 | TSLA20271217C5 |
What This Means 💡
Unusual Score: 273x normal (based on $121M premium vs typical $442K daily average)
Someone just dropped a quarter-billion dollars betting TSLA goes higher over the next 2+ years. These aren't lottery tickets - these are deep in-the-money LEAP calls that act like synthetic stock positions with leverage. When you see strikes at $5 and $30 on a $440 stock, that's institutional money positioning for the long haul.
Technical Analysis 📈
Price Action & Trend
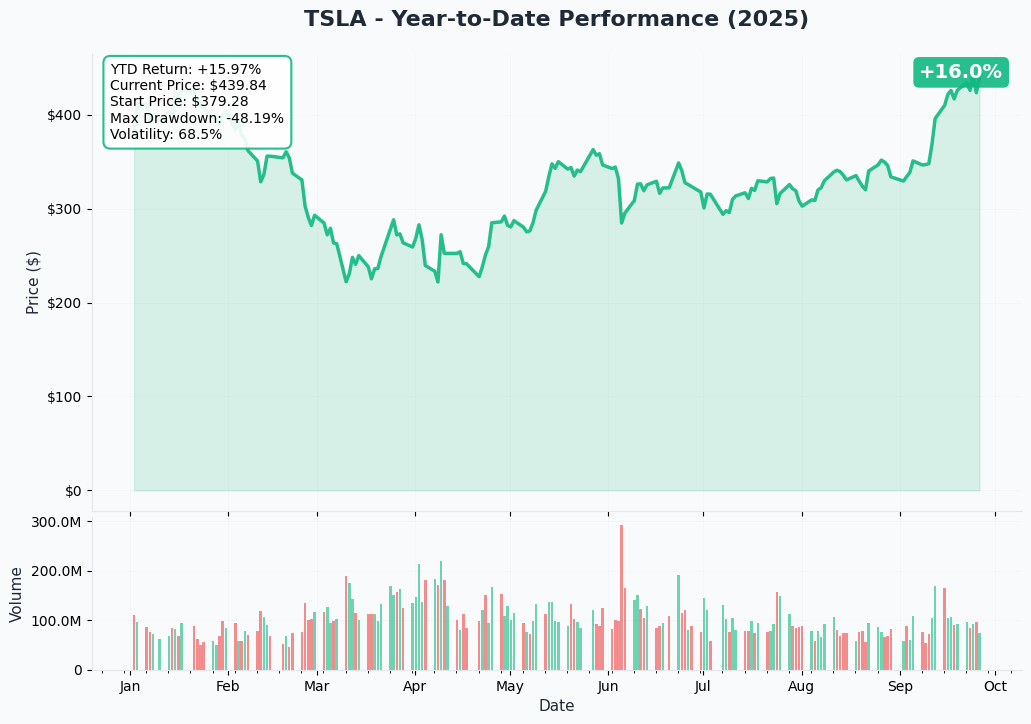
Looking at the YTD chart, TSLA has staged an incredible comeback:
- Low: $379.28 (March bottom)
- Current: $439.84
- Recovery: +16% from the depths
- Volume: Healthy daily volume averaging 100M shares
- Volatility: 68.5% (elevated but not extreme for TSLA)
The stock broke above its 200-day moving average in late August and hasn't looked back. We're seeing higher highs and higher lows - classic uptrend behavior.
Gamma Levels (Support & Resistance) 🎯
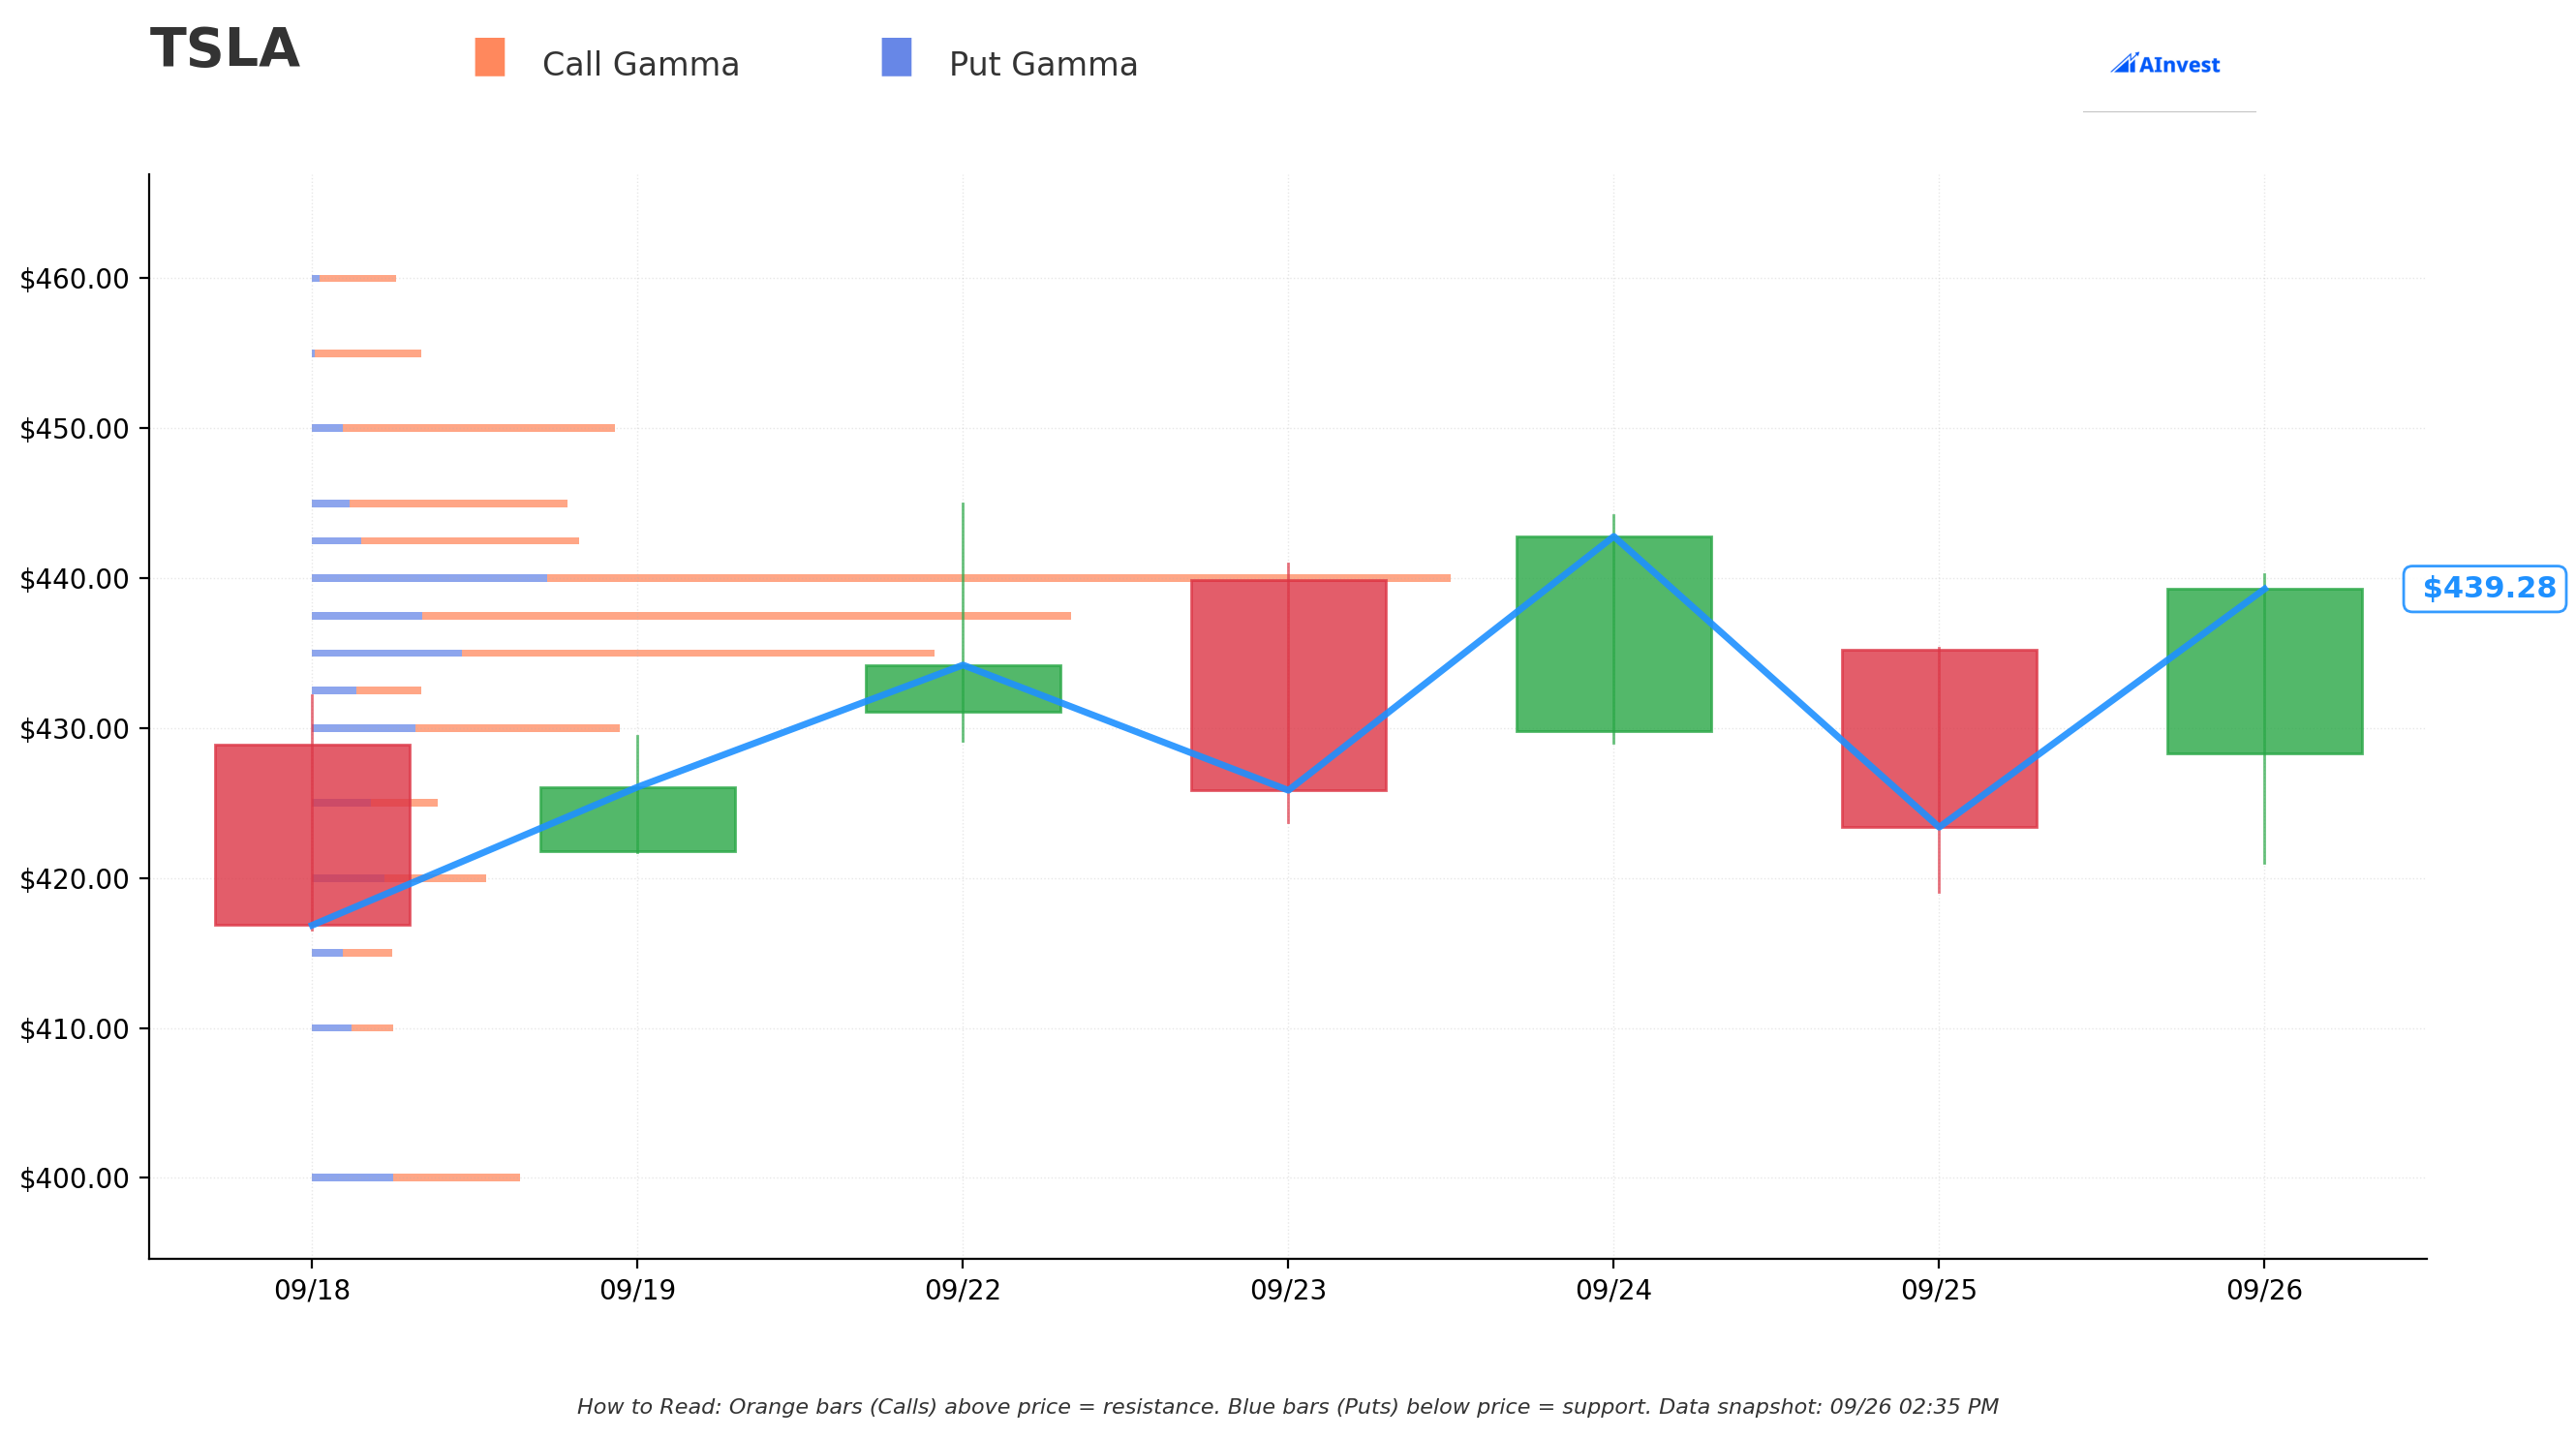
Based on options positioning, here's where the big money has placed their bets:
Key Support Levels 📉
- $437.50: Strongest support (86.6 total GEX) - Just below current price
- $435: Secondary support (69.8 total GEX)
- $430: Major floor (33.3 total GEX)
Key Resistance Levels 📈
- $440: MASSIVE resistance wall (138.5 total GEX) - We're right here!
- $442.50: Next hurdle (34.0 total GEX)
- $445: Round number resistance (32.6 total GEX)
- $450: Psychological level (36.8 total GEX)
Translation for Normal Humans: The stock is sitting right at a major resistance level ($440). If it breaks through with volume, we could see a quick pop to $445-450. If it fails, expect support at $435-437.50.
Upcoming Catalysts 🚀
Confirmed Events ✅
-
Q3 2025 Earnings - October 22, 2025
- Analyst estimates: 465K-475K deliveries (could hit 510K+!)
- EPS expectations: $0.55-0.60 vs consensus $0.49
- Source
-
FSD v14 Rollout - Late September/October 2025
- Described as making cars feel "almost sentient"
- v14.0: Early access now
- v14.2: "Sentient" version by Christmas
- Source
-
Robotaxi Expansion - Q4 2025
- Already operating in Austin & Bay Area
- Los Angeles & Florida launches by year-end
- Source
Already Happened ✓
- $7,500 EV Tax Credit Expiration - September 30, 2025 (creating rush demand)
- Model Y Juniper Refresh - Launched early 2025 with 353-mile range
- Energy Business Growth - Now Tesla's most profitable division (30%+ margins!)
Price Targets 🎯
Based on gamma levels and analyst sentiment:
Bull Case 🚀 (30% probability)
Target: $500
- Q3 beats massively (510K+ deliveries)
- FSD v14 exceeds expectations
- Robotaxi expansion accelerates
- Energy business continues 30%+ growth
Base Case 📊 (50% probability)
Target: $450
- Q3 meets raised expectations
- Steady FSD progress
- Gradual robotaxi rollout
- Maintains current momentum
Bear Case 🐻 (20% probability)
Target: $400
- Q3 disappoints on margins
- Post-tax credit demand falls off
- Competition intensifies
- Regulatory delays on autonomy
Trading Ideas 💰
Conservative Play 🛡️
Bull Put Spread (for income with protection)
- Sell Oct 18 $420 Put @ $3.20
- Buy Oct 18 $410 Put @ $1.85
- Max Gain: $135 per spread
- Max Loss: $865 per spread
- Breakeven: $418.65
- Win Rate: 72% (stock stays above $420)
Balanced Play ⚖️
Call Debit Spread (bullish but defined risk)
- Buy Nov 15 $445 Call @ $18.50
- Sell Nov 15 $460 Call @ $11.20
- Max Gain: $730 per spread
- Max Loss: $730 per spread
- Breakeven: $452.30
- Risk/Reward: 1:1
Aggressive Play 🚀
Naked Long Calls (maximum upside, higher risk)
- Buy Jan 2026 $450 Calls @ $42.50
- Breakeven: $492.50
- Upside: Unlimited above breakeven
- Risk: Entire premium if below $450 at expiry
- Why this strike: Captures Q4 catalysts + holiday sales
Risk Management ⚠️
Position Sizing Guidelines
- Conservative: 1-2% of portfolio per trade
- Balanced: 2-3% of portfolio per trade
- Aggressive: Never more than 5% on a single position
Key Risks to Monitor
- Gamma Wall at $440: We're literally sitting on massive resistance
- Post-Tax Credit Demand: Unknown how Q4 sales hold up
- Volatility: 68.5% IV means options are expensive
- Competition: Chinese EVs gaining market share in Europe
- Execution Risk: Optimus production way behind targets
Stop Loss Suggestions
- Stock Position: Stop at $420 (key support break)
- Options: Cut losses at 30-40% on directional trades
- Spreads: Let them expire if risk is defined
The Bottom Line 📝
Look, someone just bet a quarter-billion dollars that TSLA continues higher. That's not chump change - that's conviction. The setup is intriguing:
✅ Bullish Factors:
- Massive institutional call buying
- Strong technical uptrend
- Multiple catalysts in Q4
- Energy business crushing it
- FSD improvements coming fast
⚠️ Concerns:
- Sitting right at major resistance ($440)
- Options are pricey (high IV)
- Tax credit headwind coming
- Europe sales struggling
My Take: The smart money is positioning for something big in 2026-2027 (hence the LEAP calls). For shorter-term traders, wait for a clean break above $440 with volume before going long. If we reject here, look to buy the dip around $430-435.
For options traders, selling puts on pullbacks or using spreads makes more sense than buying naked calls at these IV levels. The institutional LEAP buying suggests longer-term confidence, but near-term could be choppy around resistance.
Remember: This isn't financial advice - it's just one trader sharing what they see. Always do your own research and never risk more than you can afford to lose!
Analysis Date: September 26, 2025 Current Price: $439.84 Data Sources: Options tape, Polygon API, Company filings
Disclaimer: This analysis is for educational purposes only. Options trading involves substantial risk and isn't suitable for all investors. Past performance doesn't guarantee future results. Always consult with a financial advisor before making investment decisions.