🚀 TSLA Massive Call Bets - Institutions Loading $111M Before Q3 Deliveries! 💰
📅 September 29, 2025 | 🔥 Unusual Activity Detected
🎯 The Quick Take
Someone just dropped $111M on TSLA calls this morning - including a massive $73M bet on January 2026 $300 calls! With Q3 delivery numbers dropping in 3 days (October 2nd) and the stock already up 32% in September, institutional money is positioning for continuation of this explosive rally. Translation: Big players are betting TSLA keeps ripping higher through earnings and beyond!
📊 Company Overview
Tesla, Inc. (TSLA) is a vertically integrated battery electric vehicle automaker and developer of autonomous driving software with:
- Market Cap: $1.46 Trillion
- Industry: Motor Vehicles & Passenger Car Bodies
- Primary Business: EVs, energy storage, solar panels, and autonomous driving software
💰 The Option Flow Breakdown
📊 What Just Happened
The Tape (September 29, 2025):
| Time | Symbol | Side | Buy/Sell | Type | Expiration | Premium | Strike | Volume | OI | Size | Spot | Option Price |
|---|---|---|---|---|---|---|---|---|---|---|---|---|
| 11:14:18 | TSLA | MID | BUY | CALL | 2026-01-16 | $73M | $300 | 5.2K | 20K | 4,734 | $442.72 | $154.35 |
| 11:14:18 | TSLA | MID | BUY | CALL | 2026-01-16 | $38M | $400 | 5.5K | 1.7K | 4,734 | $442.72 | $80.35 |
| 09:52:24 | TSLA | ASK | BUY | PUT | 2027-12-17 | $8.4M | $220 | 3.2K | 14K | 3,200 | $443.6 | $26.25 |
| 09:52:24 | TSLA | MID | SELL | PUT | 2027-12-17 | $21M | $450 | 1.6K | 434 | 1,600 | $443.6 | $130.6 |
🤓 What This Actually Means
Real talk: This is EXTREME bullish positioning ahead of major catalysts! Let me break it down:
- $111M in January 2026 calls - Someone's betting TSLA explodes higher over the next 3.5 months
- The $300 strike calls are already deep in-the-money (stock at $442) - this is like buying stock with leverage
- The $400 calls give additional upside exposure if TSLA continues its moon mission
- The December 2027 put activity looks like portfolio hedging - standard risk management
Unusual Score: This $38M single trade scores 10,458x average size - absolutely unprecedented activity! 🔥
📈 Technical Setup / Chart Check-Up
YTD Performance
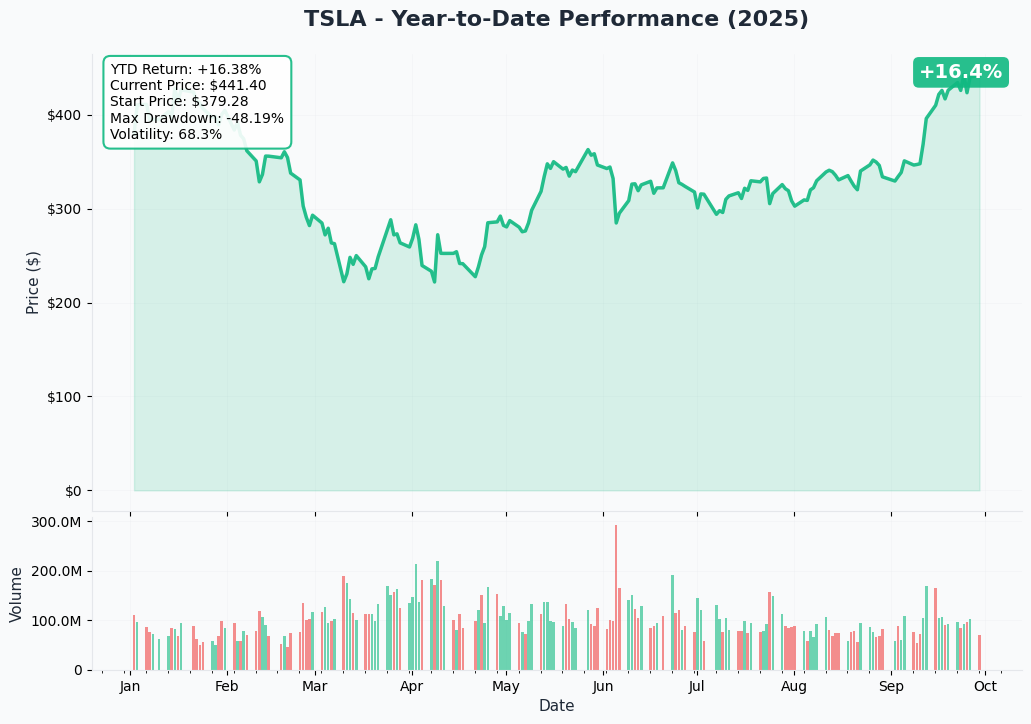
TSLA's been on an absolute tear! Check out this chart:
- YTD Return: +16.4% with recent September explosion
- Current Price: $441.40 (near 52-week highs)
- Max Drawdown: -48.19% (massive recovery from early year lows)
- Volatility: 68.3% - buckle up for wild swings!
The September rally has been nothing short of spectacular - up 32% this month alone! Volume's been picking up too, suggesting institutional accumulation.
Gamma-Based Support & Resistance Analysis
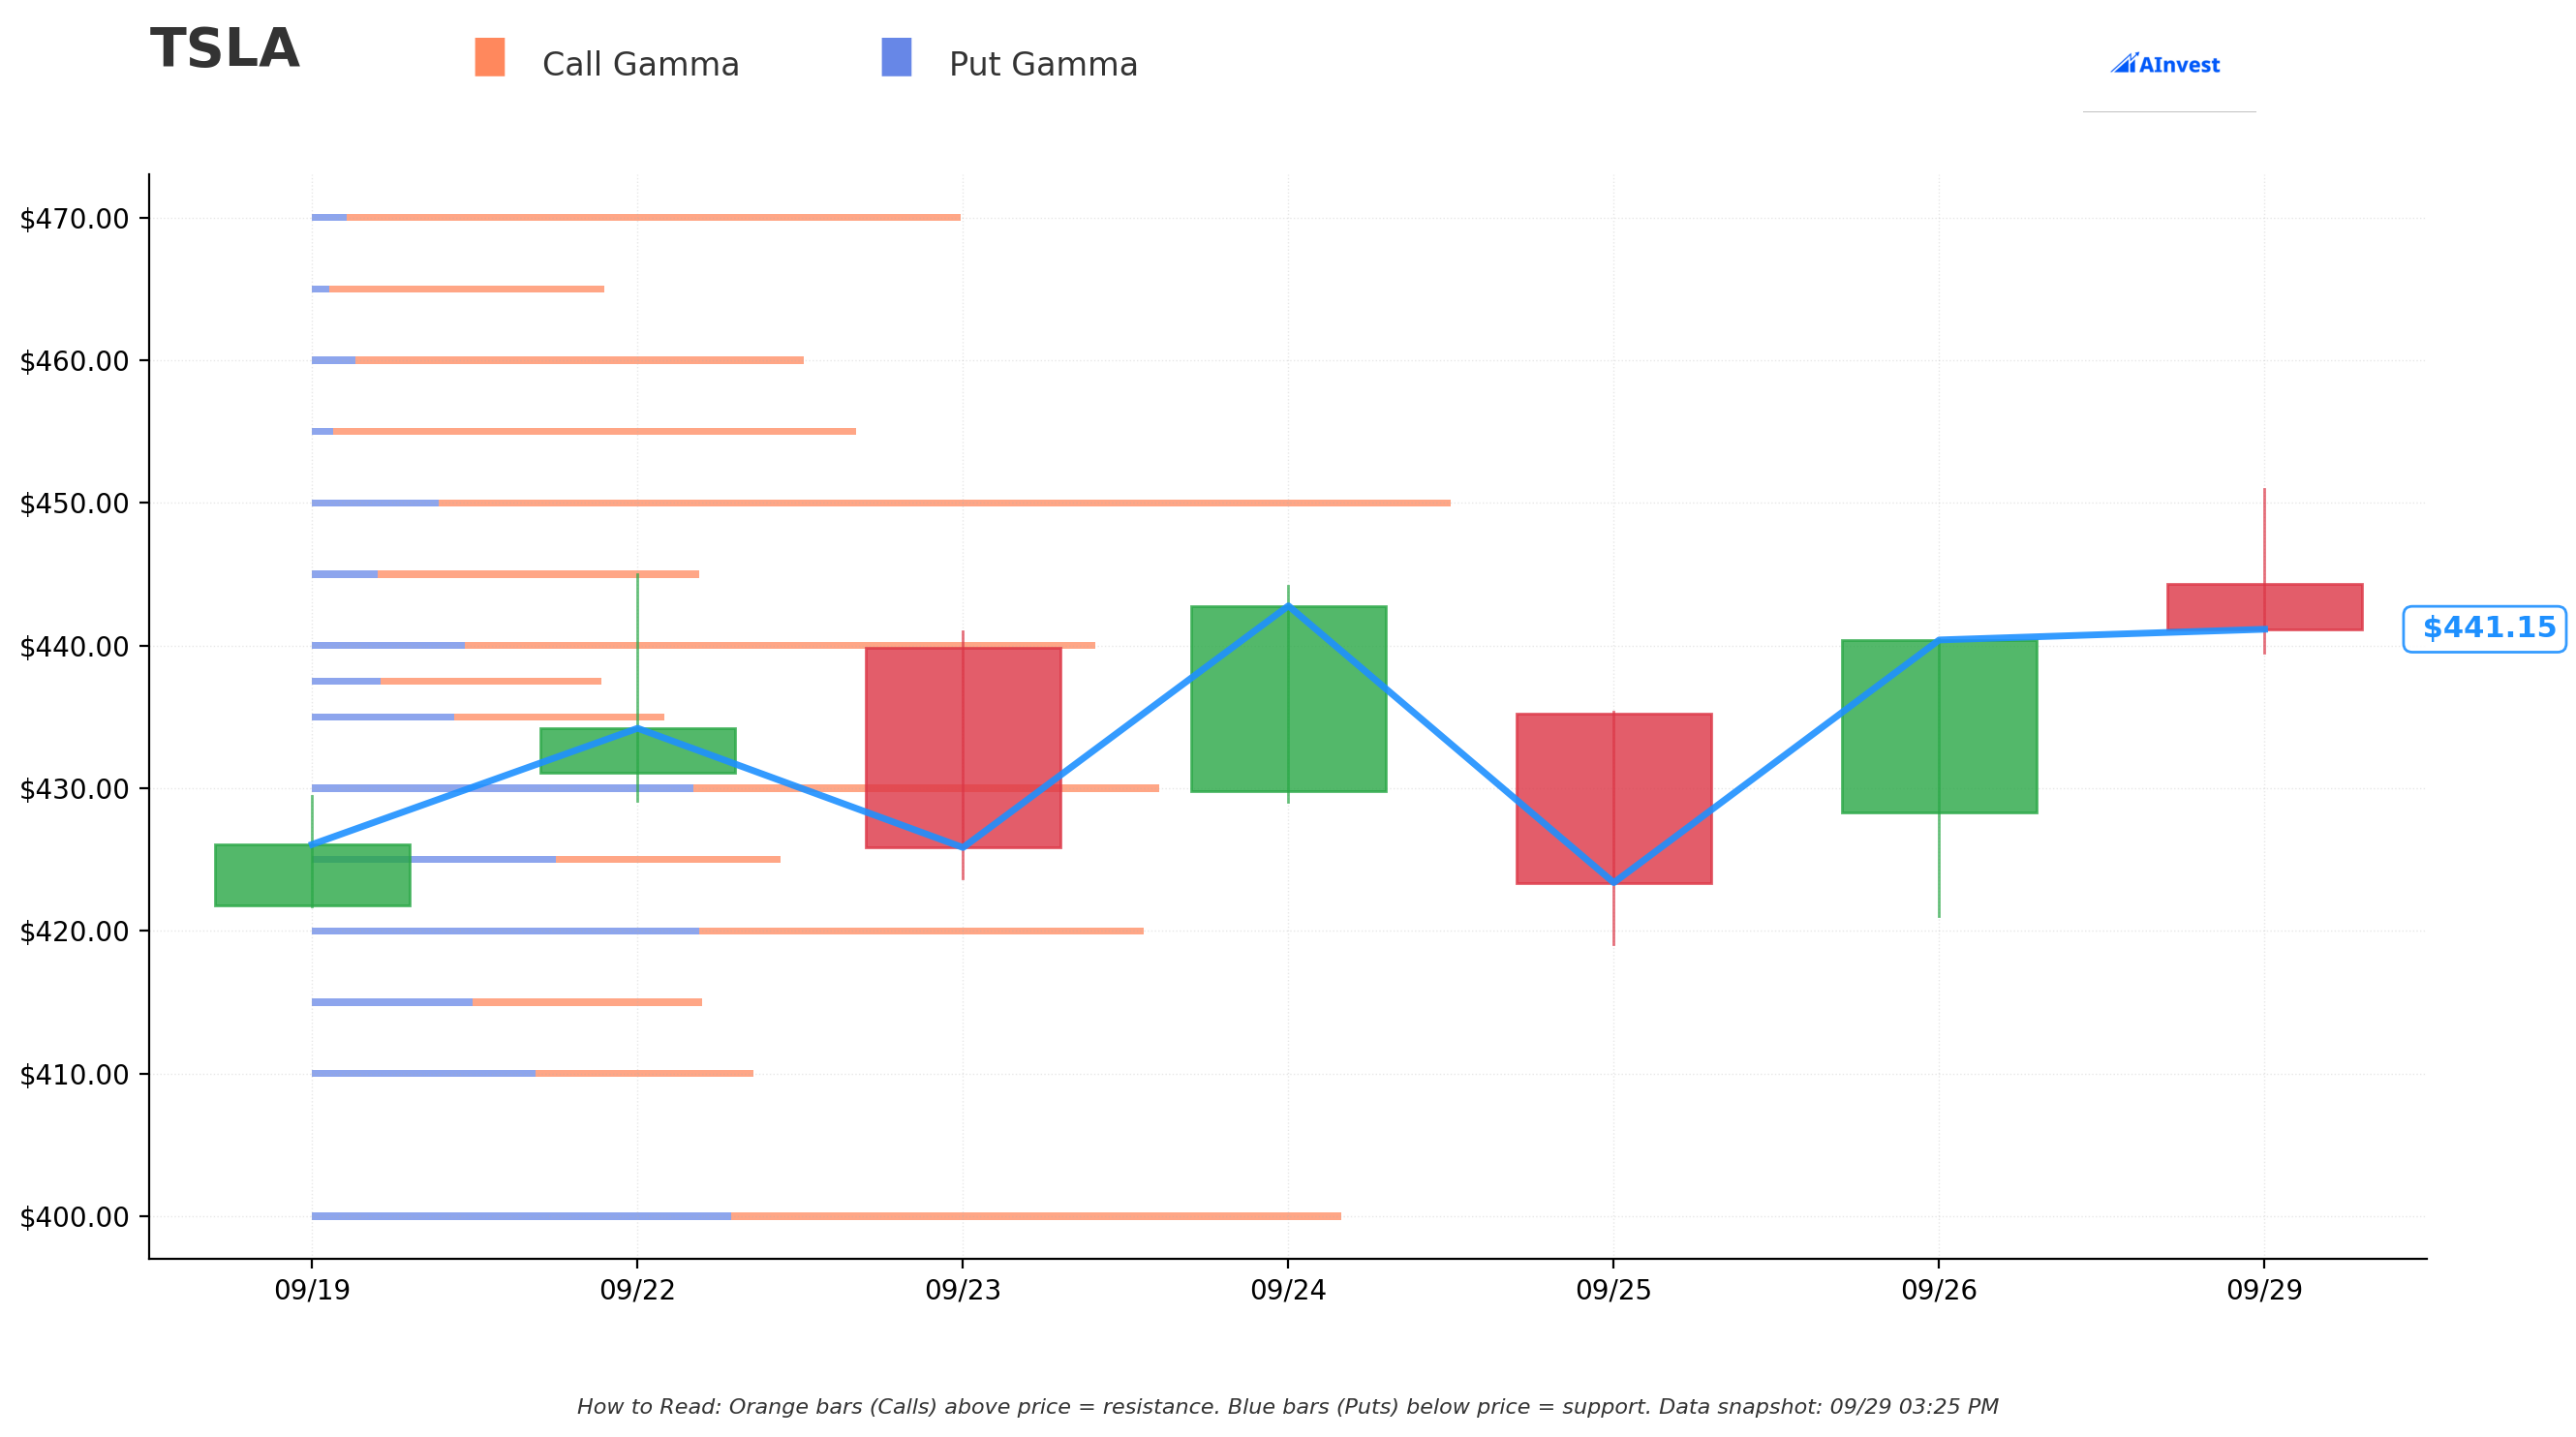
Current Price: $441.15
Looking at the gamma levels (where options activity is concentrated):
🔵 Support Levels (Blue bars below price):
- $440 - Strongest support (0.3% below) - massive put gamma wall here
- $430 - Secondary support (2.6% below)
- $420 - Deep support (4.8% below)
- $400 - Major floor (9.4% below)
🟠 Resistance Levels (Orange bars above price):
- $450 - Immediate resistance (2% above) - huge call gamma concentration
- $455 - Next level (3.1% above)
- $460 - Strong ceiling (4.2% above)
- $470 - Major resistance (6.5% above)
- $500 - Moonshot level (13.3% above) - largest gamma wall
Translation: The stock's sitting right at a critical inflection point. Heavy support at $440 should hold any dips, while $450 is the first major hurdle to clear.
🎪 Catalysts
Upcoming Events 🚀
Q3 2025 Delivery Report - October 2, 2025 (3 DAYS AWAY!)
- Wall Street expects around 447,000 vehicles delivered
- Some analysts project stronger results up to 470,000 units
- Buyers rushing to get $7,500 federal EV tax credit before expiration
Q3 Earnings - October 22, 2025
- Analysts expect EPS between $0.55-$0.60
- Deutsche Bank forecasts over 461,000 vehicles
- Energy storage business could be the dark horse surprise
FSD Version 14 Launch - Early October 2025
- Musk calls it the "second biggest update ever"
- Version 14.2 coming around Christmas will make cars "feel almost sentient"
Annual Shareholder Meeting - November 6, 2025
- Musk says "This will be special"
- Master Plan Part IV announcement expected
- Major AI/robotics vision updates likely
Recently Completed ✅
September Rally
- Stock up 32% this month on renewed Musk focus
- Robotaxi service now operational in Austin and San Francisco
- Energy division showing 154% YoY growth
🎲 Price Targets & Probabilities
Based on gamma levels and upcoming catalysts:
🚀 Bull Case (35% chance)
Target: $470-$500
If Q3 deliveries beat big (470K+) and FSD V14 impresses, we could see:
- Break above $450 gamma resistance with volume
- Test $470 level before earnings
- Potential squeeze to $500 if shorts cover
This is what those January $400 calls are betting on!
😐 Base Case (45% chance)
Target: $440-$460 range
Most likely scenario - consolidation around current levels:
- Q3 deliveries meet expectations (450K range)
- Stock bounces between $440 support and $450 resistance
- Sets up for bigger move post-earnings
😰 Bear Case (20% chance)
Target: $400-$420
If deliveries disappoint or market corrects:
- Test gamma support at $420
- Deep support at $400 should hold (massive put walls)
- Would create excellent entry for earnings play
💡 Trading Ideas
🛡️ Conservative: Sell Puts at Support
Play: Sell October 18th $420 puts
Collect premium while having support at major gamma level. If assigned, you're buying TSLA at a 5% discount with strong technical floor.
Risk: Own TSLA at $420 if drops Reward: Keep premium if stays above $420
⚖️ Balanced: Call Spread for Earnings
Play: Buy November $450 calls, sell $480 calls
Captures upside through earnings with defined risk. Profits if TSLA breaks resistance.
Max Risk: Premium paid (~$15 per spread) Max Reward: $30 per spread if above $480
🚀 Aggressive: Follow the Whales
Play: Buy January 2026 $450 calls
Ride the same wave as today's institutional buyers. Gives time through multiple catalysts.
Risk: Premium paid Reward: Unlimited upside if TSLA continues rally
⚠️ Risk Factors
Let's keep it real - here's what could go wrong:
- Valuation concerns: Trading at 180x 2026 PE multiple - frothy territory
- Delivery risk: Any miss on October 2nd numbers could trigger selling
- Competition: Budget EVs eating into market share globally
- Regulatory delays: FSD rollout in Europe/China still pending approvals
- Musk factor: CEO attention split between multiple companies
🎯 The Bottom Line
Here's the deal: $111M doesn't flow into options by accident - especially 10,458x normal size! Institutional money is positioning for TSLA to continue its September surge through Q3 deliveries and earnings.
If you own TSLA: Hold tight - big money's betting on higher prices through January
If you're watching: October 2nd delivery numbers are THE catalyst - better than expected could trigger next leg up
If you're bearish: Respect the $440 gamma support - that's your line in the sand
Mark your calendar:
- October 2nd - Q3 deliveries (make or break moment!)
- October 22nd - Q3 earnings (next major catalyst)
- November 6th - Annual meeting ("special" announcements coming)
Remember: When someone drops $73M on calls expiring in 3.5 months, they usually know something! This isn't your neighbor Bob on Robinhood - this is serious institutional positioning. 🐋
Disclaimer: Options trading involves substantial risk of loss. This analysis is for educational purposes only and not financial advice. Always do your own research and consult with a financial advisor.
About Tesla: Tesla is a vertically integrated battery electric vehicle automaker and developer of autonomous driving software with a $1.46 trillion market cap in the motor vehicles & passenger car bodies sector.