🌊 TSLA Call Seller Tsunami - $154M Institutional Fade at $455! 💰
📅 October 1, 2025 | 🔥 Unusual Activity Detected
🎯 The Quick Take
Someone just executed an $154M call selling program on Tesla at 13:28 PM today! This massive institutional play sold 34,500 November $455 calls collecting $154M in premium while betting TSLA won't break above $455 by November 21st. With Q3 deliveries dropping Thursday and earnings October 22nd, this is positioning for range-bound action through catalysts. Translation: Big money is fading the rally at these levels!
📊 Company Overview
Tesla, Inc. (TSLA) is a vertically integrated electric vehicle manufacturer and autonomous driving software developer with:
- Market Cap: $1.45 Trillion
- Industry: Motor Vehicles & Passenger Car Bodies
- Employees: 125,665
- Primary Business: EVs, energy storage, solar, autonomous driving software
📊 The Option Flow Breakdown
The Tape (October 1, 2025 @ 13:28):
| Time | Symbol | Side | Buy/Sell | Type | Expiration | Premium | Strike | Volume | OI | Size | Spot | Option Price |
|---|---|---|---|---|---|---|---|---|---|---|---|---|
| 13:28:50 | TSLA | MID | SELL | CALL | 2025-11-21 | $78M | $455 | 36K | 53K | 17,500 | $458.16 | $44.85 |
| 13:28:10 | TSLA | MID | SELL | CALL | 2025-11-21 | $76M | $455 | 18K | 53K | 17,000 | $458.09 | $44.85 |
Total Premium Collected: $154M for 34,500 contracts
What This Actually Means
This is naked call selling at massive scale - a highly confident bet against upside! The trader:
- Collects massive premium ($154M) by selling at-the-money $455 calls
- Maximum profit of $154M if TSLA stays below $455 by November 21st
- Breakeven at $499.85 ($455 + $44.85 premium)
- Unlimited risk if TSLA explodes above $500
Unusual Score: EXTREME (17,250x average size) - Institution-sized positioning!
📈 Technical Setup / Chart Analysis
YTD Performance Chart
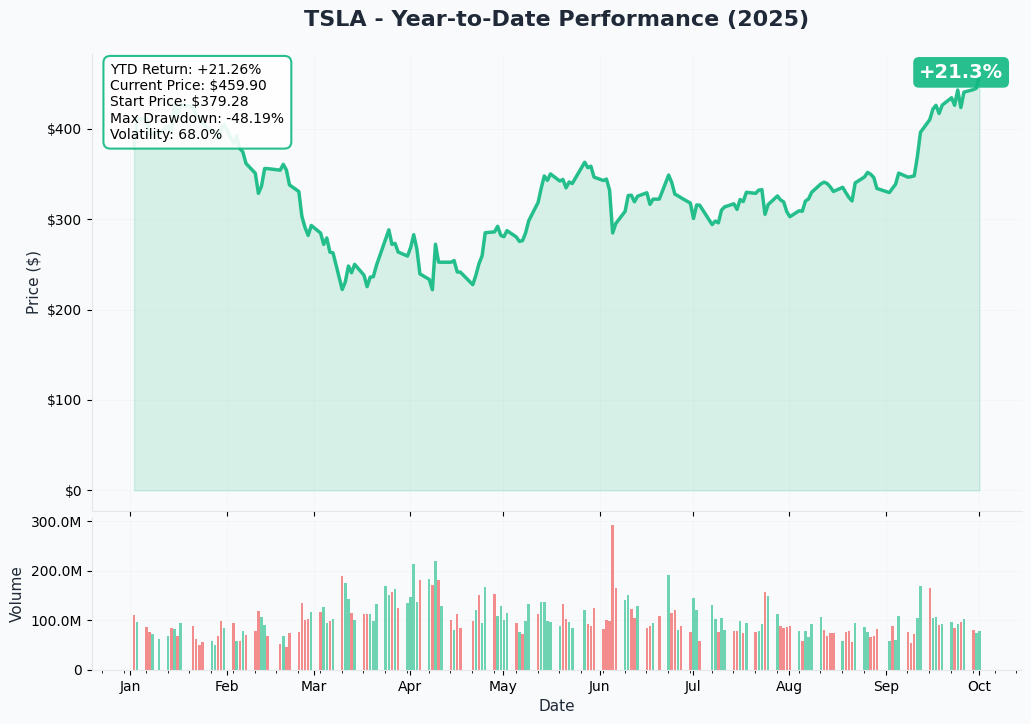
Tesla's having a stellar year with +107% YTD performance, currently trading at $459 near all-time highs. The stock has been on an absolute tear since August lows around $220.
Key observations:
- Current price: $459 (near 52-week highs)
- 52-week range: $221.86 - $459.00
- Recent momentum: +108% rally from August lows
- Volume: Elevated institutional interest
Gamma-Based Support & Resistance Analysis
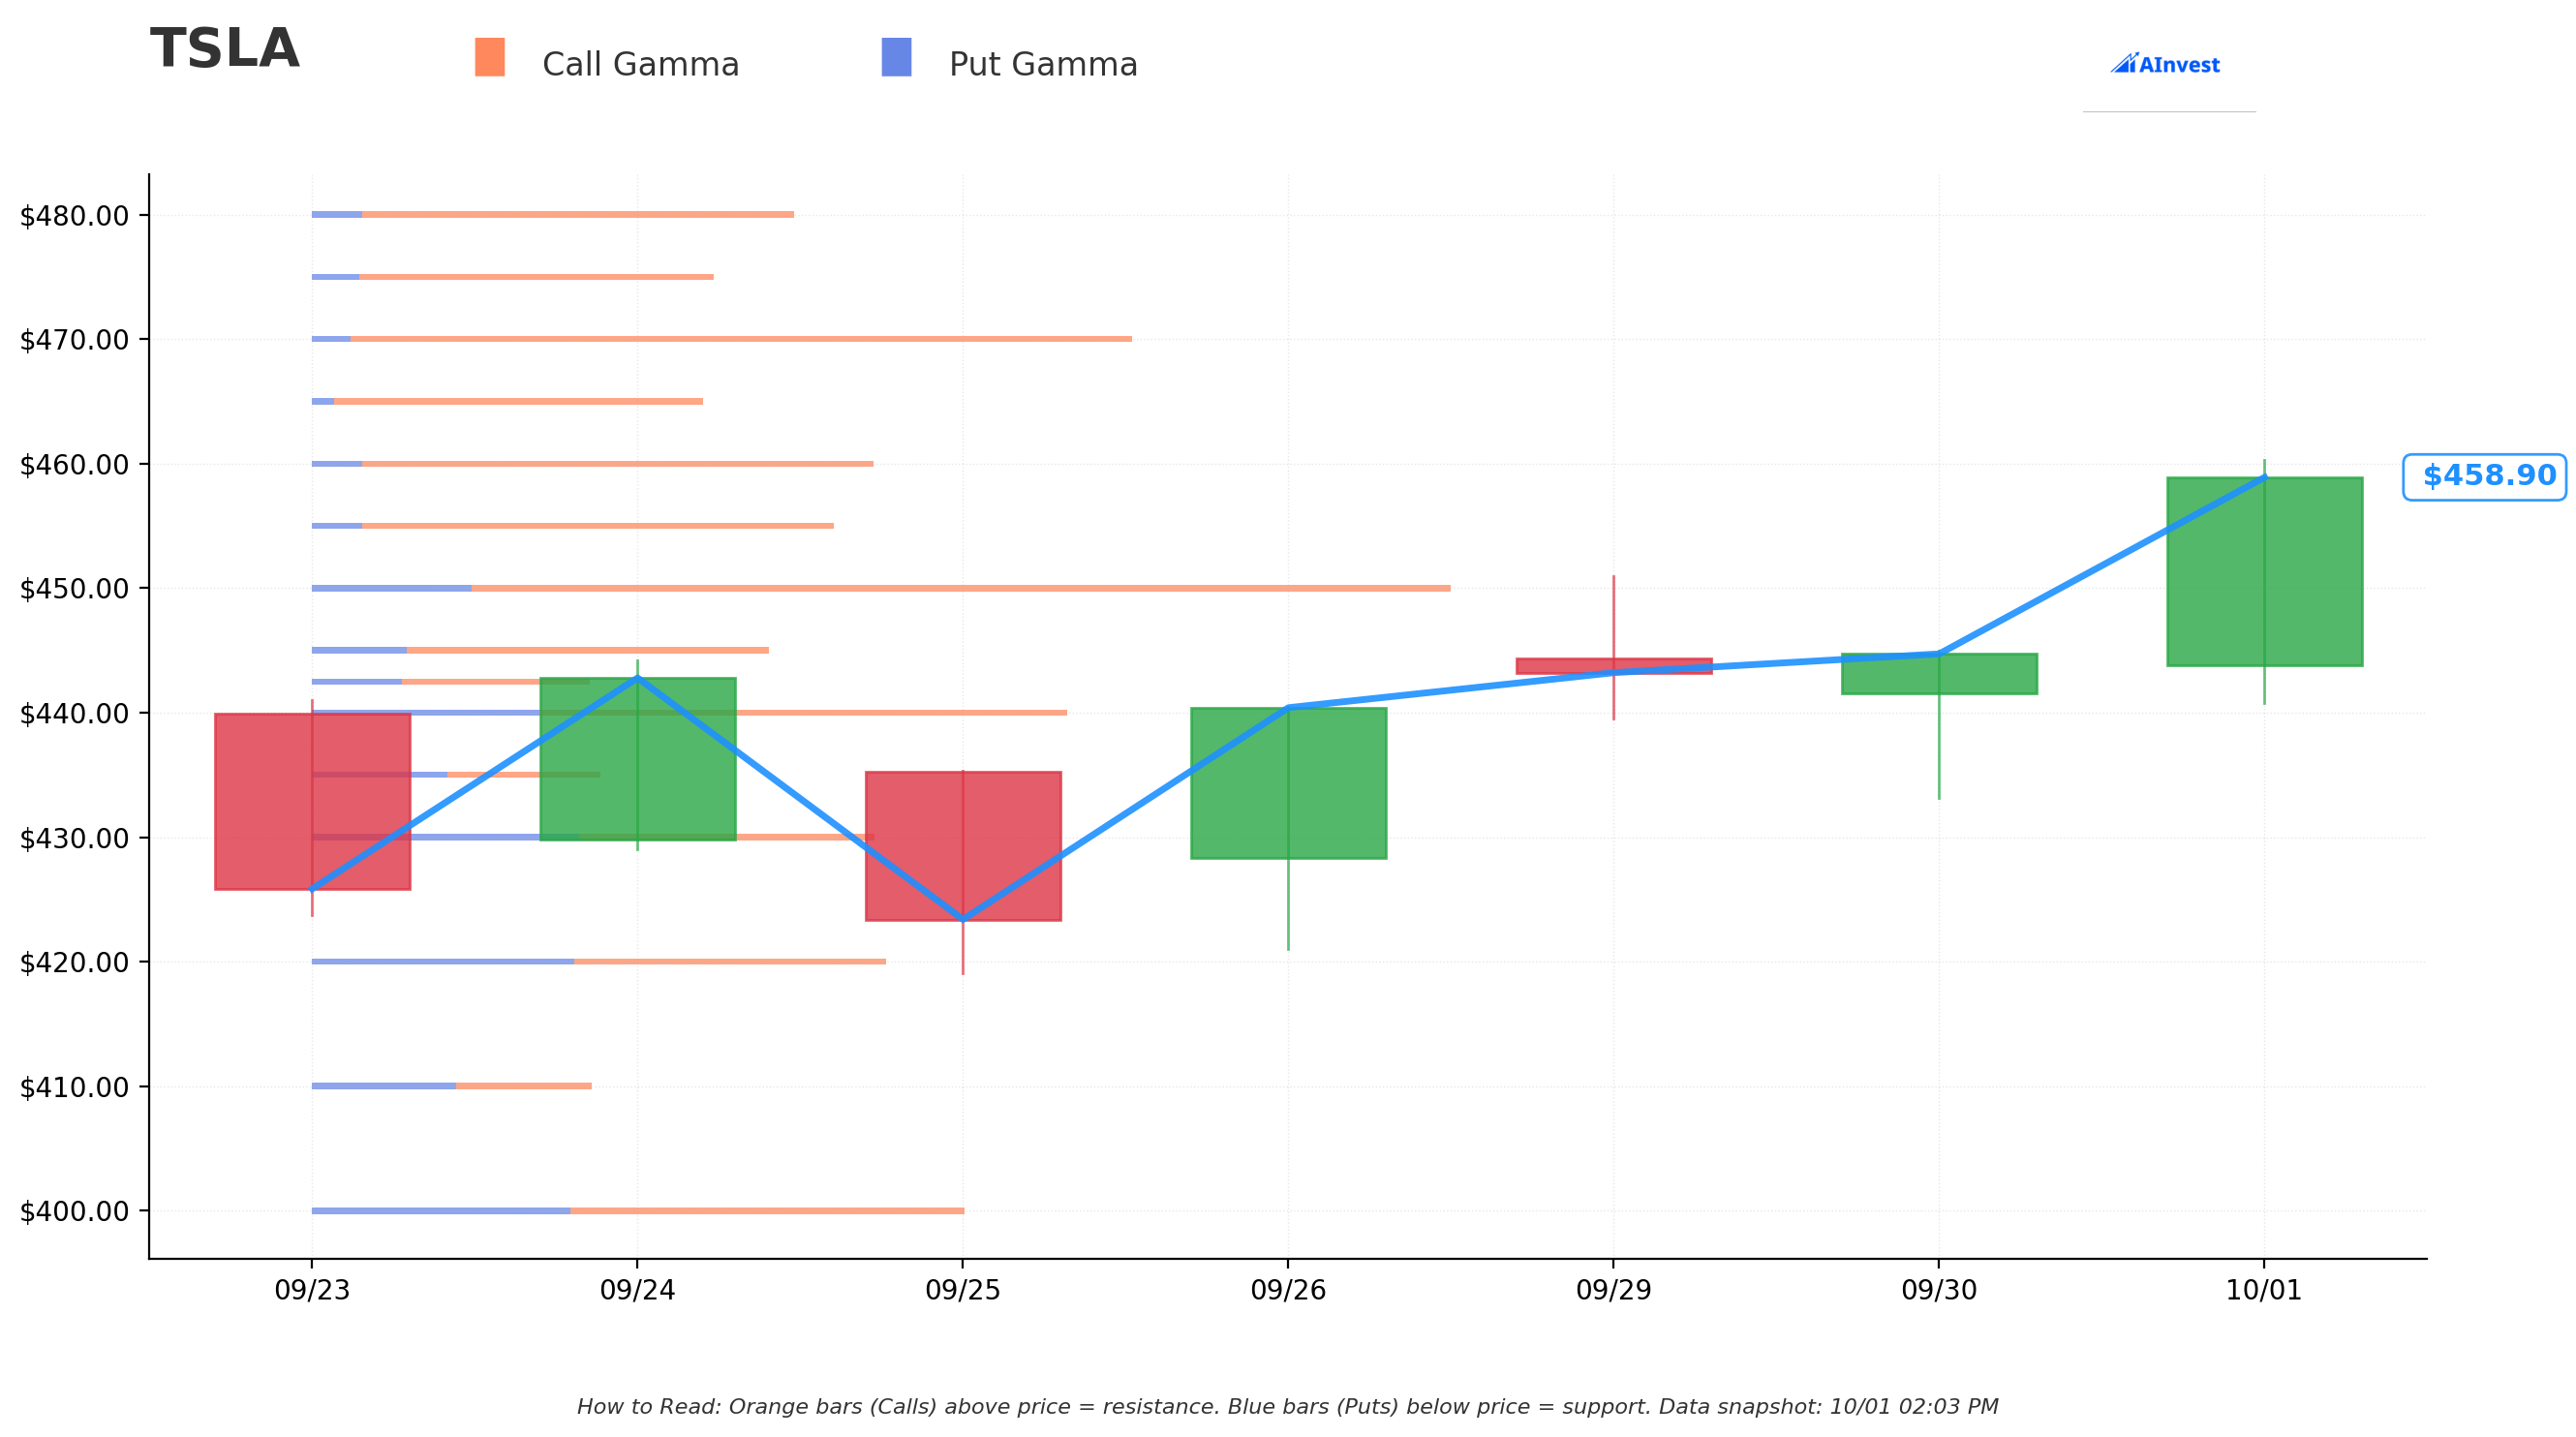
Current Price: $459.00
The gamma chart reveals critical levels explaining this massive trade:
- Strongest Support: $455 strike with 16.40 total GEX (13.26 net bullish)
- Immediate Resistance: $460 strike with 17.71 total GEX
- Major Resistance: $470 strike with 25.92 total GEX
- Mega Wall: $500 strike with 41.07 total GEX (38.05 net bullish)
- Net GEX Bias: Bullish (433.43 call GEX vs 146.14 put GEX)
The seller chose $455 perfectly - right at the strongest support level where gamma will help pin the stock!
⚡ Catalysts
Immediate Catalysts
Q3 2025 Deliveries - Thursday, October 3rd
- Consensus expects 447,000-448,000 vehicles with bulls targeting 480K (Reuters, William Blair, Yahoo Finance)
- 22% sequential improvement from Q2's 384,000 if hits target
- Rush to secure $7,500 federal EV tax credit before September 30th expiration driving demand (Markets FC)
- Critical datapoint for Q3 earnings estimates
Q3 2025 Earnings - October 22, 2025
- Wall Street expects EPS of $0.48 with revenue ~$24.98 billion (MarketBeat, Zacks)
- Energy segment could surprise with explosive growth trajectory
- FSD revenue recognition becoming material contributor
FSD Version 14 Release - Early October
- 10x larger neural network than V12 (Teslarati, Electrek)
- Described as more "sentient" driving experience (Not a Tesla App)
- V14.0 early October, V14.1 two weeks later, V14.2 by year-end (Autopilot Review)
- Major step toward robotaxi viability
Medium-Term Catalysts
Robotaxi Commercial Launch
- Austin pilot already operational since June 2025 (Axios)
- Commercial introduction targeting late 2025/early 2026 (Morgan Stanley via Teslarati)
- Plans to cover 50% of U.S. population by year-end (Tickeron)
- Expansion to California, Nevada, Arizona, Florida imminent
Optimus Robot Production
- Targeting thousands of units by end of 2025 (scaled back from 5,000 target) (ROIC.ai, MLQ.ai)
- Gen 3 prototype expected late 2025 (Teslarati)
- Full production early 2026 with millions per year within 4-5 years
- Major AI monetization opportunity beyond vehicles
Energy Storage Explosion
- Storage deployments doubling year-over-year (Benchmark via Teslarati)
- Data center demand driving massive growth
- New Megafactories expanding production capacity
- Becoming increasingly important profit center
🎯 Price Targets & Probabilities
Using gamma levels and analyst consensus:
Bull Case (20% chance)
Target: $500-$600
- Delivery beat above 480K units
- FSD V14 breakthrough capabilities
- Energy segment surprise
- Dan Ives $600 target based on AI transformation (CoinCentral, QuiverQuant)
Risk to call seller: Unlimited losses above $500
Base Case (60% chance)
Target: $430-$470 range
- Deliveries meet ~450K consensus
- Stock consolidates recent gains
- Gamma pinning around $455-$460 levels
- Call seller profits in this range
Perfect scenario for this call selling strategy
Bear Case (20% chance)
Target: $400-$430
- Delivery disappointment below 440K
- Q4 demand concerns post-tax credit
- Broader market correction
- Competition from Chinese EVs intensifying
Call seller keeps full $154M premium
💡 Trading Ideas
Conservative: Credit Spread Protection
Play: Bear call spread (Nov 21st expiration)
Sell $470 calls, buy $490 calls
Risk: $20 per spread max loss Reward: $8-10 credit per spread
Why this works: Rides the gamma resistance with defined risk
Balanced: Iron Condor Range Play
Play: Sell $430/$450/$470/$490 iron condor (Nov 21st)
Sell $450 put and $470 call Buy $430 put and $490 call
Risk: $20 max loss per spread Reward: $10-12 credit collected
Why this works: Profits from range-bound action around gamma levels
Aggressive: Contrarian Long Play
Play: Buy dip on any weakness
Buy $455 calls (December expiration)
Risk: Premium paid (~$55-60) Reward: Unlimited if breaks $500 resistance
Why this works: If deliveries crush estimates, could squeeze shorts
⚠️ Risk Factors
- Delivery timing: Thursday's numbers could swing stock 5-10%
- Tax credit expiration: Q4 demand uncertainty post-September 30th
- China competition: BYD and others gaining market share globally
- FSD regulatory: Any delays could impact robotaxi timeline
- Valuation multiple: Trading at premium requires perfect execution
- Optimus delays: Production targets already being scaled back
🏁 The Bottom Line
Real talk: This $154M call selling program tells us institutional money is betting Tesla won't break $455 through November expiration. The gamma data supports this with massive resistance building above current levels.
If you own TSLA: Consider taking profits or selling covered calls above $470
If you're watching: Thursday's deliveries are make-or-break for near-term direction
If you're bullish: Wait for post-delivery pullback or focus on December+ options
Mark your calendar:
- October 3rd - Q3 deliveries (potential volatility event)
- October 22nd - Q3 earnings (major catalyst)
- November 21st - Option expiration (gamma unwind)
This call seller is betting on consolidation through earnings - with $154M on the line, they've done their homework!
Disclaimer: Options trading involves substantial risk. This analysis is for educational purposes only and not financial advice. Past performance doesn't guarantee future results.
About Tesla: Tesla is a vertically integrated battery electric vehicle automaker and developer of autonomous driving software with a $1.45 trillion market cap in the motor vehicles & passenger car bodies sector.