🔥 TSLA: $46M Protective Put Spread OPENED – Smart Money Hedging Into 2026!
📅 December 31, 2025 | 🐋 Institutional Hedging Detected
🎯 The Quick Take
A sophisticated trader just opened a $46M protective put spread on TSLA right before the market closes for 2025! This isn't a directional bearish bet - this is institutional money hedging a large long position ahead of Q1 2026 catalysts. With TSLA trading at $450.93, they're buying deep ITM protection at the $507.5 strike while selling lower strikes ($505, $510, $520) to finance the hedge. The size vs. open interest (4,190 vs 976 OI on the lead leg) confirms these are new opening positions - someone with a massive TSLA long is locking in downside protection through January 2.
💰 Company Overview
Tesla, Inc. (TSLA) is a $1.51 trillion vertically integrated electric vehicle automaker and AI software developer operating in the Motor Vehicles & Passenger Car Bodies sector. The company manufactures luxury EVs, trucks, and semi-trucks while developing autonomous driving technology and humanoid robots. Tesla also operates battery storage solutions, solar energy systems, a fast-charging network, and an auto insurance business. With 125,665 employees and approximately 1.8 million global vehicle deliveries in 2024, Tesla stands as the 10th most valuable company globally.
💰 The Option Flow Breakdown
📊 What Just Happened
Here's the complete tape showing a coordinated opening of a protective put spread hedge:
| Time | Symbol | Buy/Sell | C/P | Expiration | Strike | Volume | Premium | OI | Size | Spot | Option Price | Option Symbol |
|---|---|---|---|---|---|---|---|---|---|---|---|---|
| 15:17:31 | TSLA | BUY | PUT | 2026-01-02 | $507.5 | 4,400 | $24.0M | 976 | 4,190 | $450.93 | $56.68 | TSLA20260102P507.5 |
| 15:17:31 | TSLA | SELL | PUT | 2026-01-02 | $505 | 2,800 | $15.0M | 74 | 2,740 | $450.93 | $54.19 | TSLA20260102P505 |
| 15:17:31 | TSLA | SELL | PUT | 2026-01-02 | $510 | 835 | $4.9M | 14 | 830 | $450.93 | $59.15 | TSLA20260102P510 |
| 15:17:31 | TSLA | SELL | PUT | 2026-01-02 | $520 | 415 | $2.8M | 8 | 410 | $450.93 | $69.17 | TSLA20260102P520 |
Total Premium: $46.7M
🤓 What This Actually Means
Translation for us regular folks: This trader is opening a protective hedge on a large TSLA long position. They're buying deep ITM puts at $507.5 (paying $24M) and selling puts at nearby strikes ($505, $510, $520) to reduce the net cost of protection. This is classic institutional hedging behavior - they own a ton of TSLA stock and want to lock in gains or limit losses through year-end.
🔍 The Unusualness Factor:
- $507.5 PUT BUY: 3.07 Z-Score (EXTREMELY UNUSUAL) - This represents 555x the average activity for this strike
- $505 PUT SELL: 2.49 Z-Score (HIGHLY UNUSUAL) - About 350x typical volume
- $510 PUT SELL: -0.13 Z-Score (TYPICAL) - Actually normal activity
- $520 PUT SELL: 0.41 Z-Score (TYPICAL) - Standard trading levels
💡 Why Size > OI Matters: On every leg, the trade size exceeds the existing open interest (4,190 vs 976 OI on the $507.5 put). This confirms these are brand new positions being opened, not existing positions being closed. Someone is initiating fresh downside protection.
🎯 Order Classification: The BUY on the $507.5 put is a "Buy to Open" (BTO) - opening new protection. The SELLs on lower strikes are "Sell to Open" (STO) - financing the hedge by collecting premium. Net cost: approximately $1.3M for $46M in notional protection through January 2.
📈 Technical Setup / Chart Check-Up
YTD Chart Analysis
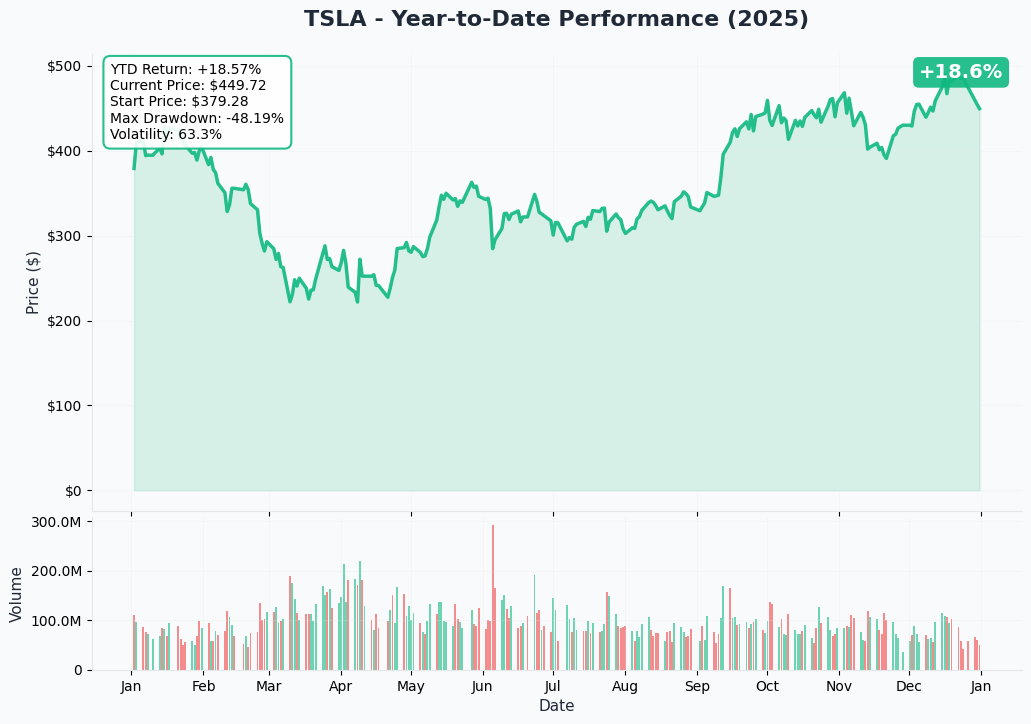
TSLA has had a rollercoaster 2025! The stock started the year around $380, crashed to the low $300s in Q1 during the DOGE/political turmoil (down 38% at the worst), then staged an impressive recovery throughout the year. The chart shows TSLA hit all-time highs near $499 on December 22 before pulling back to current levels around $450.
Key Observations:
- 📈 Recovery Rally: From Q1 lows to December highs represents a massive ~60% rebound
- 🎢 Recent Pullback: Currently sitting $48 (-9.6%) below the December 22 peak of $498.83
- 💪 Support Held: Stock found buyers around $450, creating a potential short-term floor
- 🔮 Year-End Positioning: Classic institutional profit-taking before year-end is evident
The YTD chart tells the story: political headwinds crushed the stock early, but robotaxi optimism and energy storage strength fueled the recovery. Now we're in a consolidation phase as traders digest the year's gains.
🎯 Gamma-Based Support & Resistance Analysis
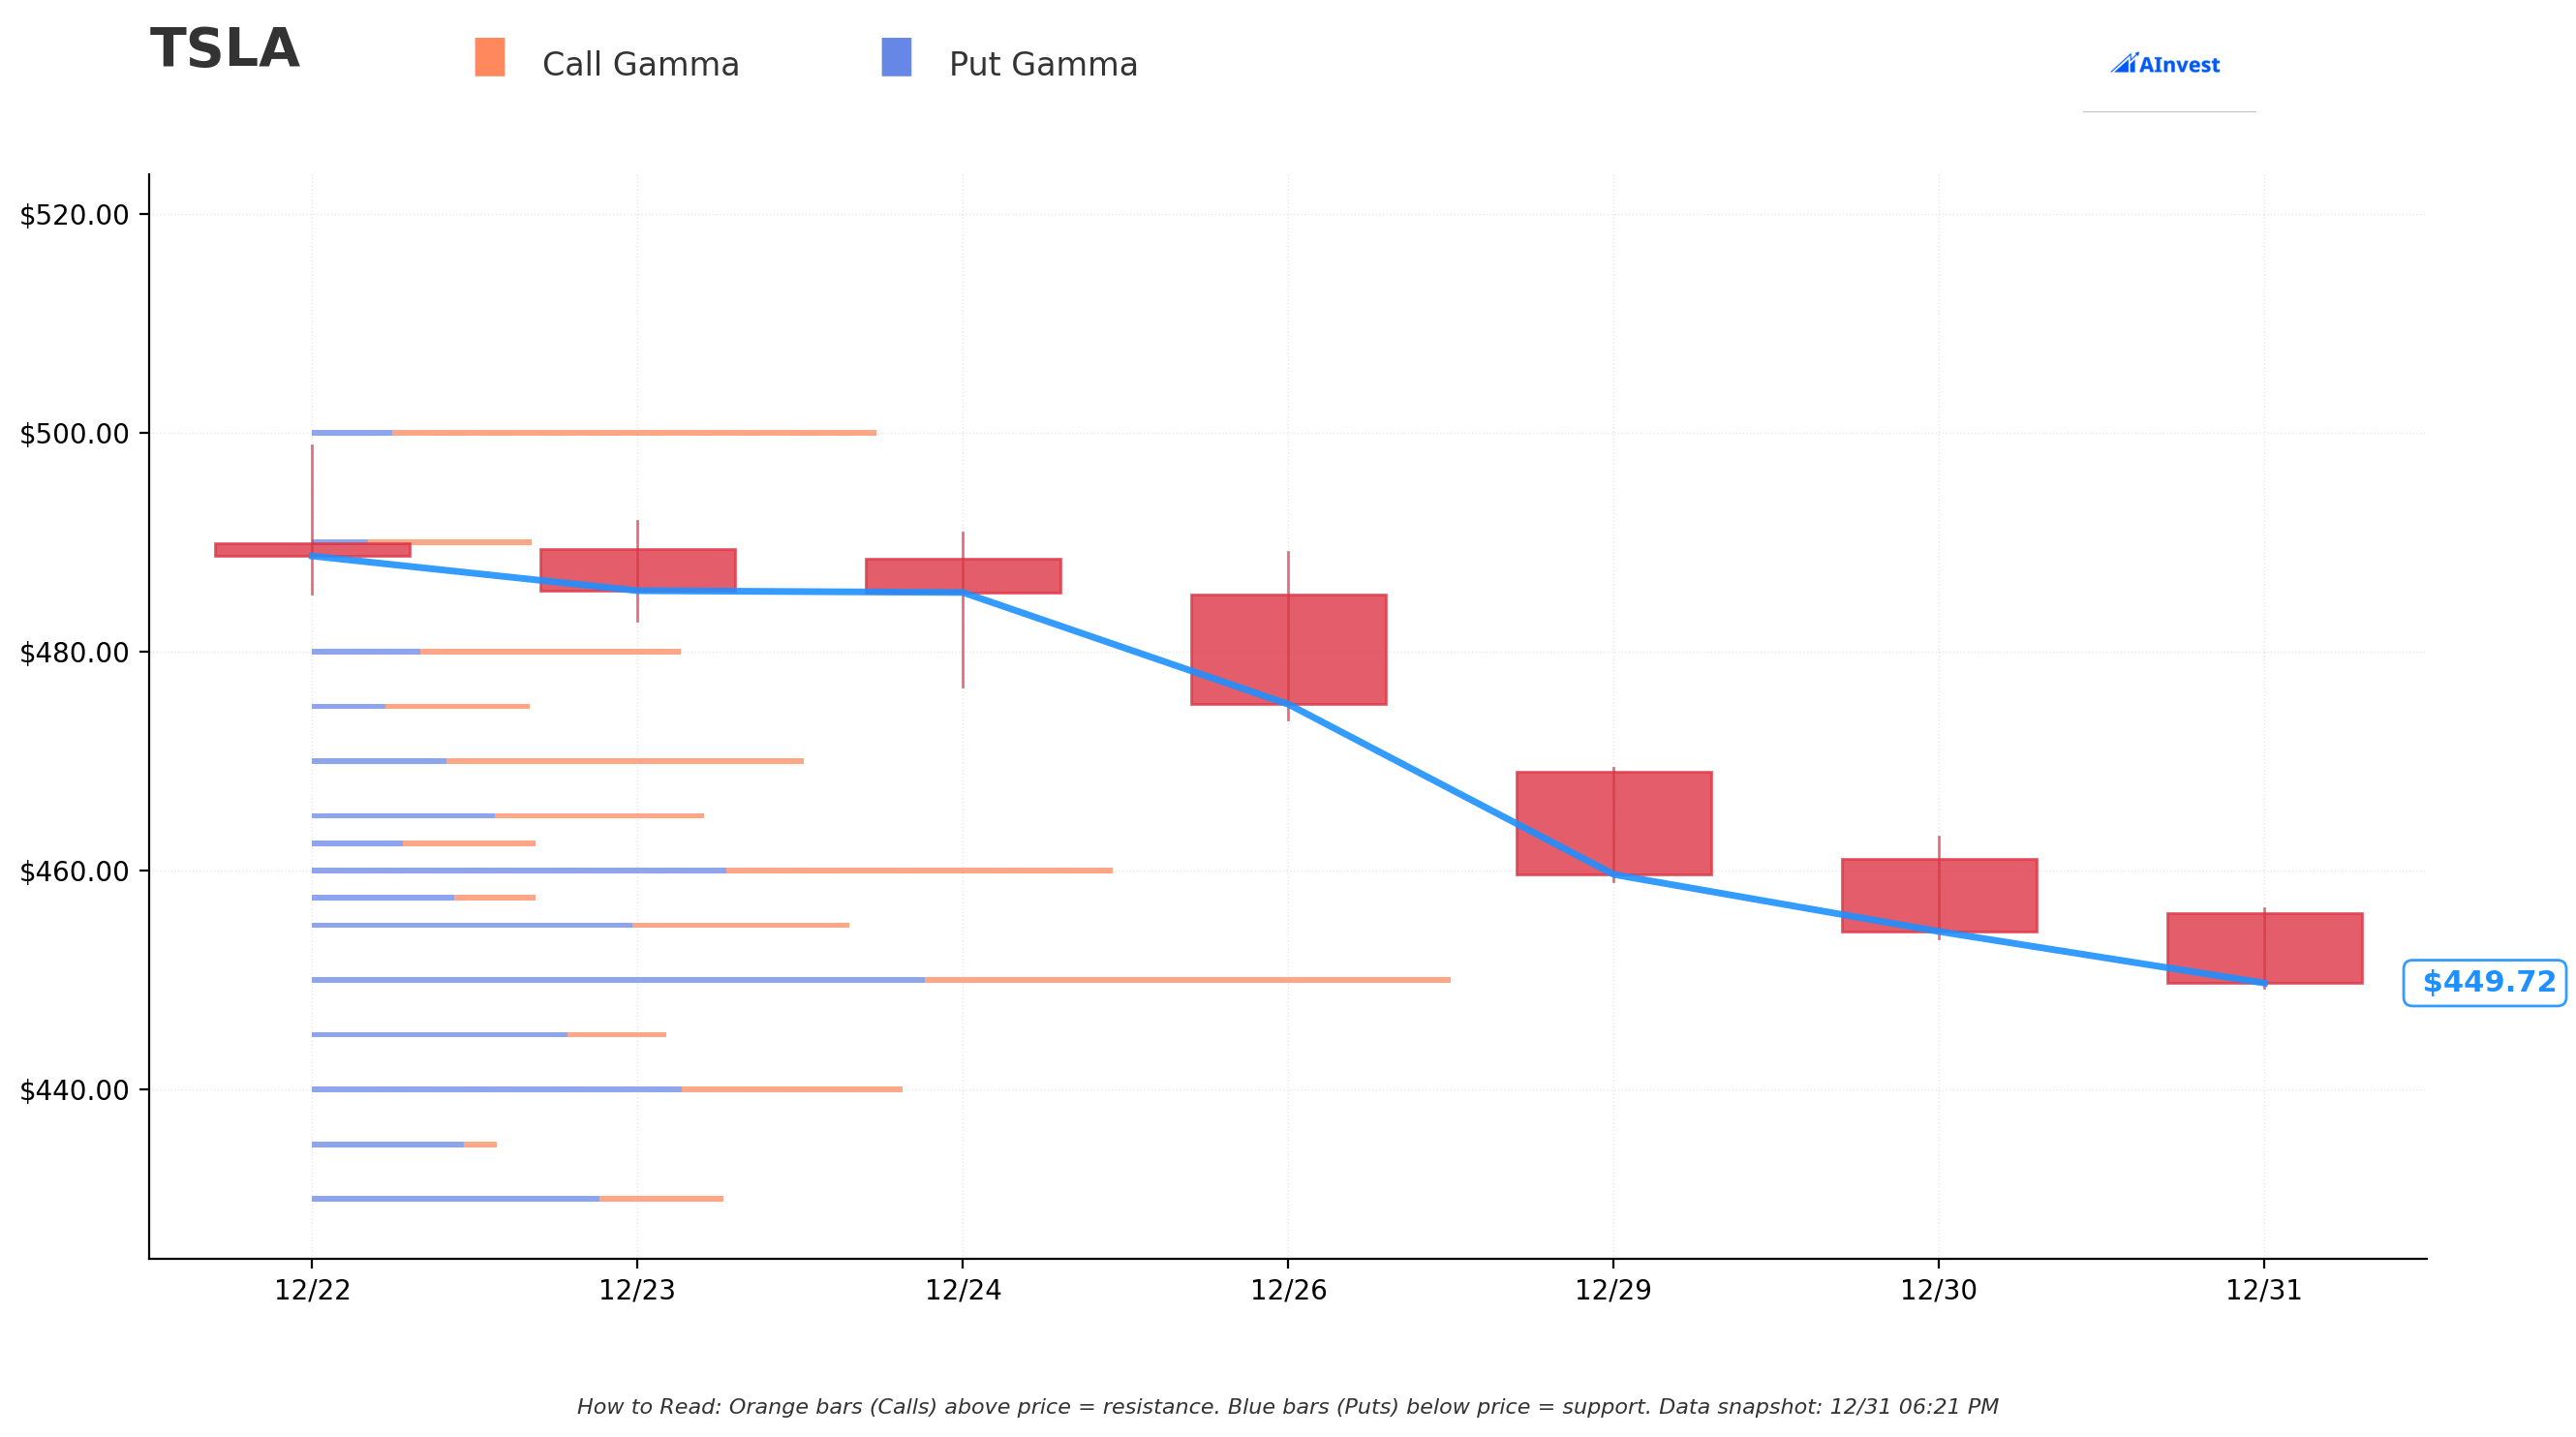
Current Price: $449.79
🔵 Support Levels (Put Gamma - Buy Pressure Below):
-
$440 - STRONGEST SUPPORT (32.98 total GEX)
- Just 2.2% below current price
- Net GEX of -8.20 (put-dominated)
- First line of defense if selling accelerates
-
$430 - STRONG SUPPORT (22.96 total GEX)
- 4.4% downside cushion
- Net GEX of -9.18 (heavy put protection)
- Major institutional put wall here
-
$400 - DEEP SUPPORT (20.61 total GEX)
- 11.1% below current levels
- Psychological round number
- Would represent a return to October lows
🟠 Resistance Levels (Call Gamma - Sell Pressure Above):
-
$450 - IMMEDIATE RESISTANCE (63.66 total GEX) - STRONGEST LEVEL
- Literally right at current price (0.05% away)
- Massive 34.13 put GEX + 29.53 call GEX
- This is the battleground - stock is pinned here
-
$455 - NEAR-TERM CEILING (30.10 total GEX)
- Just 1.2% above current price
- Net GEX of -5.69 (still put-heavy)
- Breaking through unlocks $460
-
$460 - MODERATE RESISTANCE (44.95 total GEX)
- 2.3% upside from here
- Mixed gamma profile
- Need momentum to clear this
-
$465 - WEAKENING RESISTANCE (22.03 total GEX)
- First level with positive net GEX (+1.46)
- 3.4% upside target
- Call gamma starts taking over
-
$470 - STRONG RESISTANCE (27.64 total GEX)
- Net GEX of +12.51 (heavily call-dominated)
- 4.5% above current price
- Breaking this could trigger dealer hedging rally
-
$480 - MAJOR RESISTANCE (20.77 total GEX)
- 6.7% upside from current levels
- Strong call gamma wall
- Would need significant catalyst
-
$500 - PSYCHOLOGICAL BARRIER (31.61 total GEX)
- 11.2% upside (back to recent highs)
- Net GEX of +22.69 (massive call concentration)
- Round number resistance + recent rejection zone
Net GEX Bias: BULLISH (371.45 call GEX vs. 307.31 put GEX)
📊 Implied Move-Based Support & Resistance Analysis
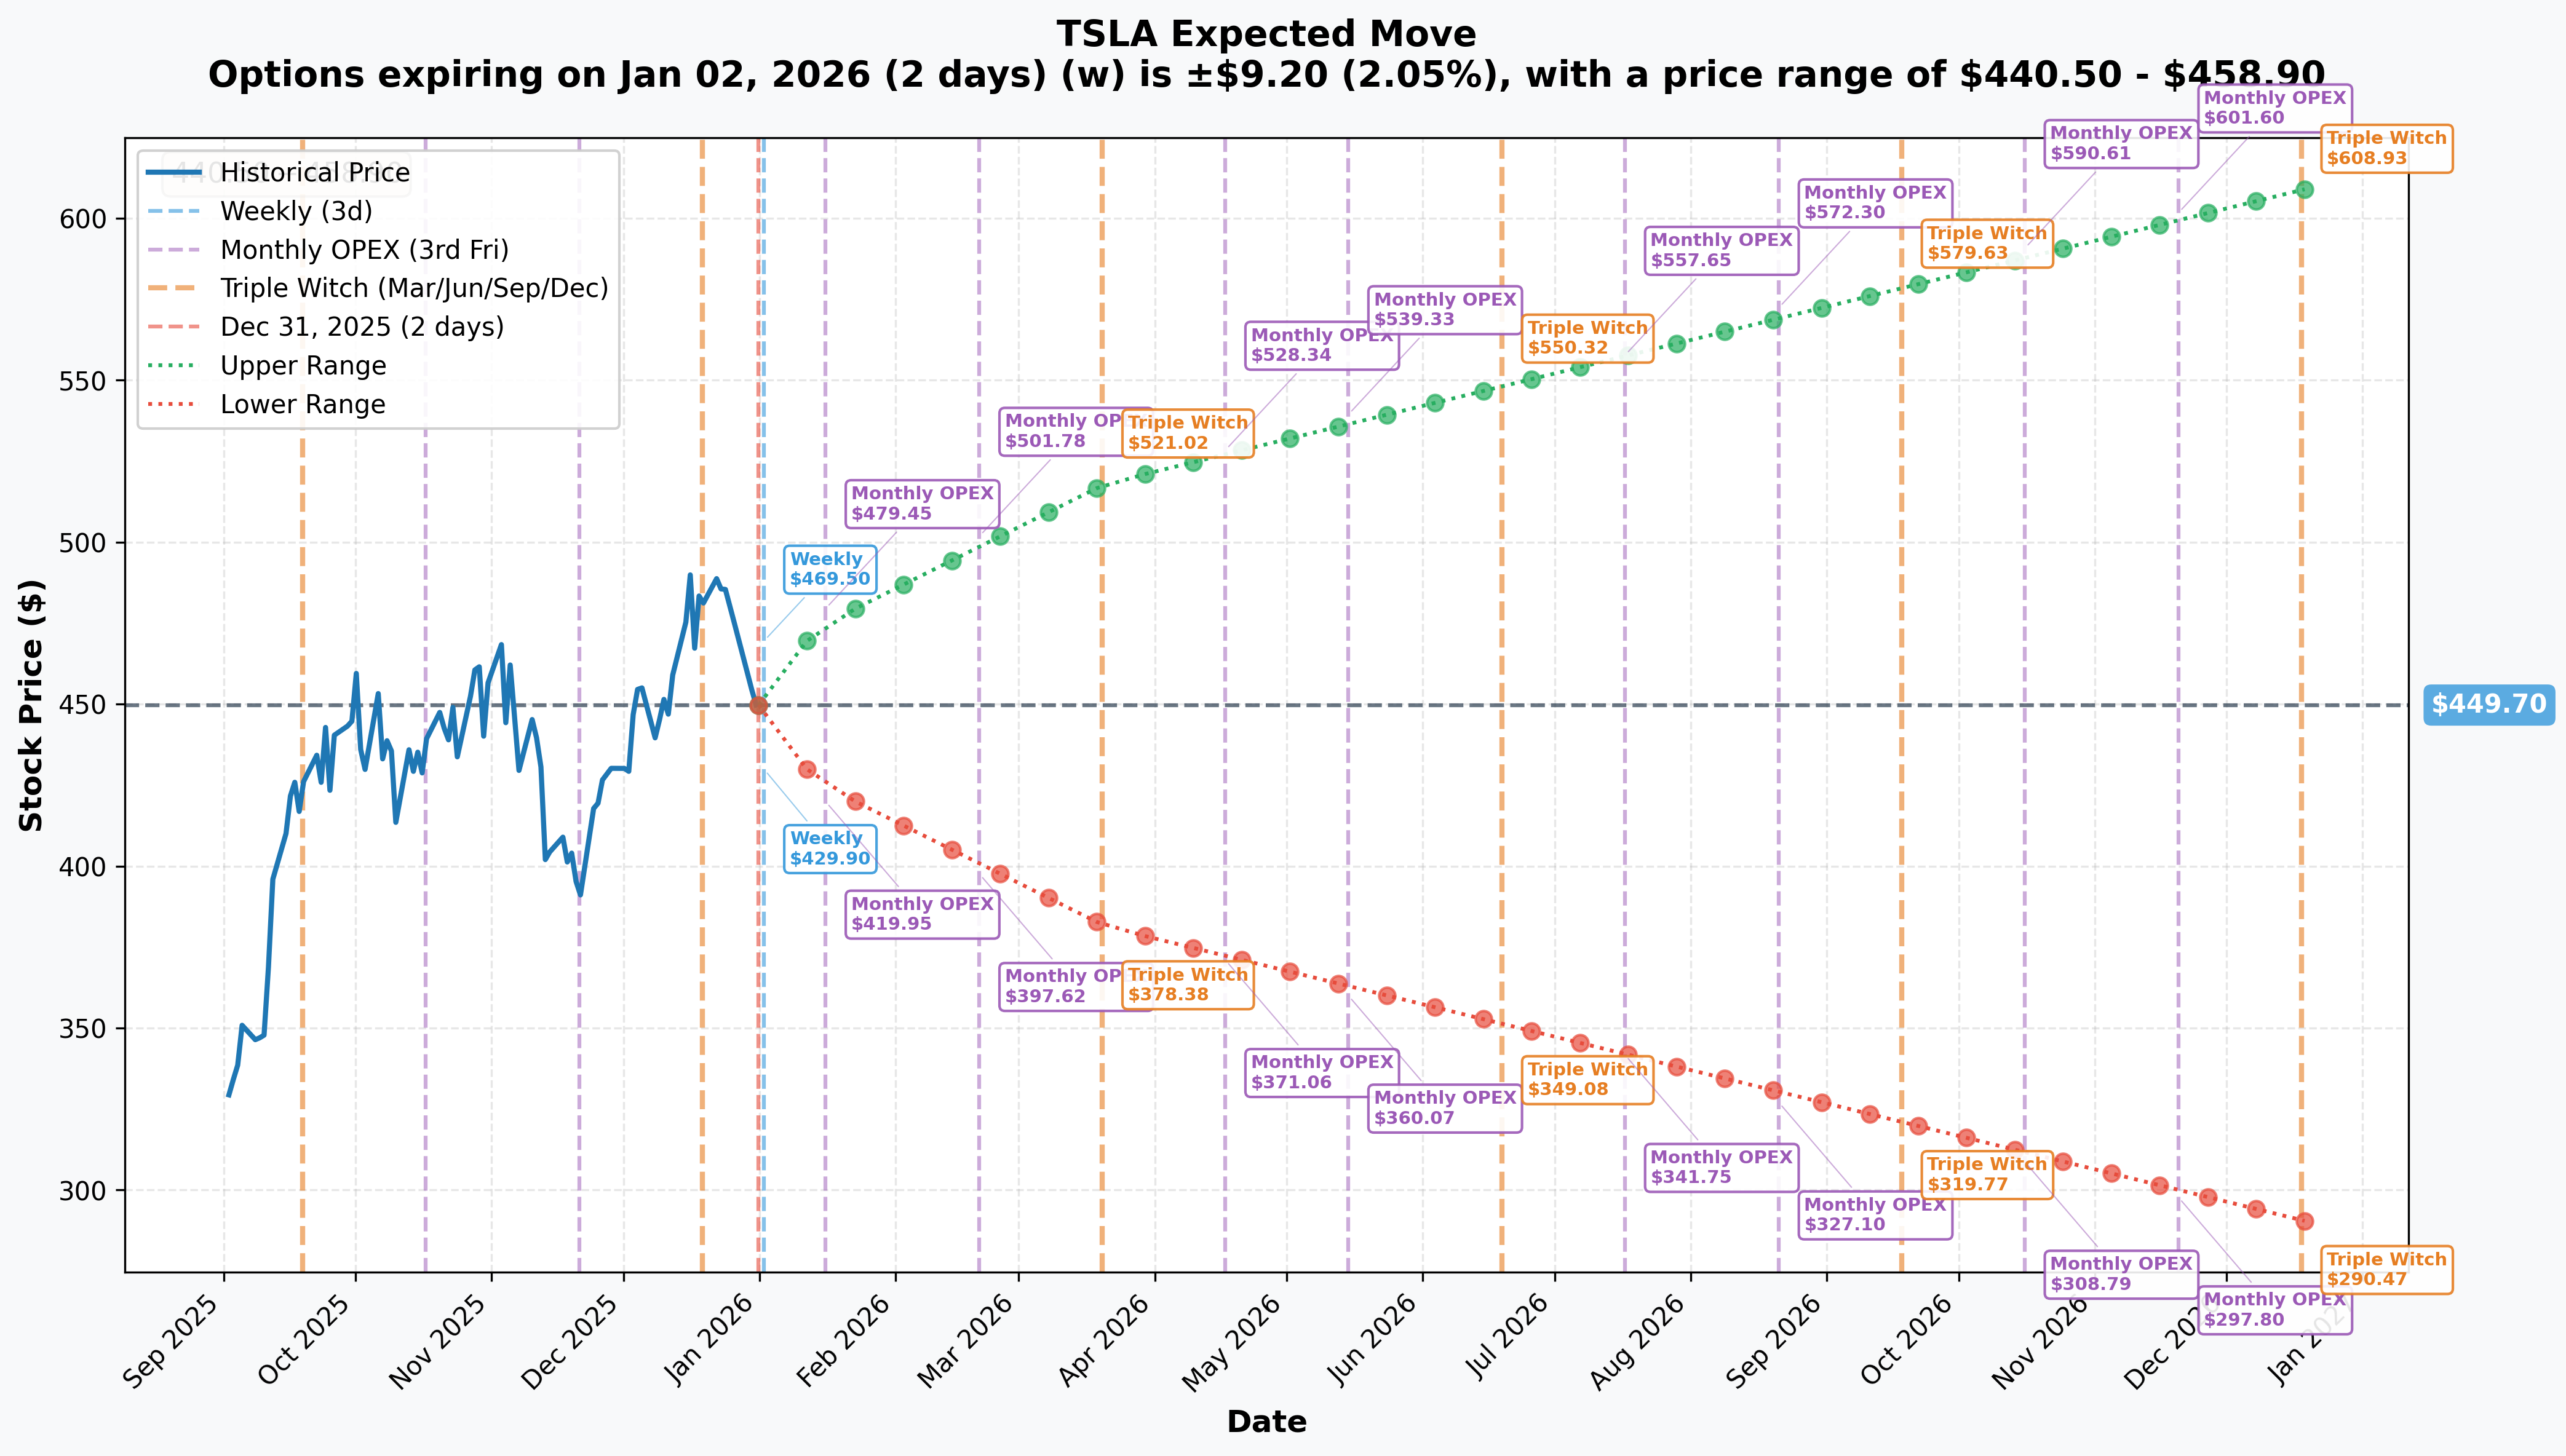
The options market is pricing in some significant movement expectations across different timeframes:
📅 Weekly (January 2, 2026 - 2 Days Out):
- Implied Move: ±2.05% (±$9.20)
- Upper Range: $458.90
- Lower Range: $440.50
- Reliability: ✅ HIGH (near-term moves most accurate)
Translation: The market expects TSLA to stay within a tight $440-$459 range through Friday. That's a relatively calm expectation for TSLA.
📅 Monthly OPEX (January 16, 2026 - 16 Days Out):
- Implied Move: ±5.71% (±$25.69)
- Upper Range: $475.39
- Lower Range: $424.01
- Reliability: ✅ HIGH (monthly is very reliable)
This is where it gets spicy! The market is pricing in a potential $51 trading range over the next two weeks. That includes Q4 delivery numbers (due early January) and potential volatility from year-end positioning unwinding.
📅 Quarterly Triple Witch (March 20, 2026 - 79 Days Out):
- Implied Move: ±15.19% (±$68.32)
- Upper Range: $518.02
- Lower Range: $381.38
- Reliability: ✅ HIGH
By March expiration, options traders are pricing a massive $137 potential range. This makes sense - Q4 earnings will be reported, Cybercab production should begin in April, and FSD regulatory news could drop anytime. The March quarterly expiration captures all these catalysts.
📅 Yearly LEAPS (December 18, 2026 - 352 Days Out):
- Implied Move: ±35.41% (±$159.23)
- Upper Range: $608.93
- Lower Range: $290.47
- Reliability: ✅ HIGH
By end of 2026, the market is pricing potential for TSLA anywhere from $290 to $609 - basically acknowledging this stock could double or get cut in half depending on execution of robotaxi, affordable EV launch, Optimus production, and China FSD rollout.
🎯 Key Takeaway: Short-term is relatively calm, but medium to long-term volatility expectations are elevated. The market knows Q1 2026 is loaded with catalysts that could send this stock significantly higher or lower.
🎪 Catalysts
📆 Upcoming Catalysts (What Could Move The Stock)
🔜 Q4 2025 Delivery Report (Early January 2026)
- Expected Deliveries: 422,850 units (down 15% YoY) per Tesla's own published consensus
- Full Year 2025: 1,640,752 units (down 8.3% YoY)
- Risk: Would mark second consecutive year of declining deliveries
- Why It Matters: Tesla took the unusual step of publishing consensus on December 29, suggesting they want to manage expectations. A miss could be brutal; a beat could trigger relief rally.
💰 Q4 2025 Earnings (Late January 2026)
- What To Watch: Automotive margins (compressed in Q3 to 18%), Energy segment performance (30%+ gross margins), FSD development costs, robotaxi timeline updates
- Analyst Consensus: Hold rating from 26 analysts; average price target $402-$414 per MarketBeat's analysis
- Recent Q3: Mixed results - record revenue ($28.1B, +12% YoY) but net income crashed 37% to $1.37B due to 50% surge in operating costs
🚗 Affordable Vehicle Launch (H1 2026)
- Target Price: $22,000-$25,000 (internally called "Model 2" or "Model Q")
- Expected Launch: Late 2025 to early 2026 per Altitudes Magazine
- Status: Originally slated for H1 2025 start, but as of June 2025 production had not begun
- Importance: Could unlock mass-market EV adoption, critical for volume growth
🤖 Cybercab Production (April 2026)
- Production Start: April 2026 at Giga Texas per InsideEVs report
- Volume Production: Q2 2026
- Target Price: Under $30,000
- Features: Two-passenger robotaxi, no steering wheel/pedals
- Current Status: Crash testing underway at Giga Texas
- CRITICAL DEPENDENCY: Requires unsupervised FSD regulatory approval to operate commercially
🇨🇳 FSD China Rollout (Q1 2026)
- Expected Timeline: Q1 2026 per Seeking Alpha analysis
- Regulatory Status: Pending approvals
- Importance: Critical for competing against BYD, Huawei, and domestic rivals in second-largest market
🚛 Tesla Semi Volume Production (H1-H2 2026)
- First Customer Builds: H1 2026 per Electrek
- Volume Production: H2 2026
- Annual Capacity Target: 50,000 units
- Recent Milestone: Demonstrated 1.2 MW charging capability on December 31
🤖 Optimus Robot Expansion (2026)
- Production-Intent Prototype: February/March 2026 per Tesla North
- 2026 Target: 50,000-100,000 units
- Long-Term Goal: 1 million units annually by late 2026
- Skepticism: Bank of America downgraded citing execution risks on mass production
✅ Past Catalysts (Already Happened)
📉 Q3 2025 Earnings (October 22, 2025)
- Results: Record revenue $28.1B (+12% YoY) but net income plunged 37% to $1.37B
- Gross Margin: Compressed to 18.0% from 19.8%
- Operating Margin: Collapsed 40% YoY to 5.8%
- Delivery Beat: Record 497,099 units (+7% YoY)
- Energy Segment: Emerged as star performer with record 12.5 GWh deployments (+81% YoY)
⚡ Energy Storage: Record Quarter (Q3 2025)
- Deployments: 12.5 GWh (+81% YoY) per Nasdaq analysis
- Q2 2025 Revenue: $3.04B (+176% YoY)
- Energy Gross Margins: ~30% vs. 17% automotive
- Significance: Energy now represents 25% of revenue at nearly double the automotive margins
🚙 Model Y Juniper Refresh (January 2025 Launch)
- U.S. Deliveries: Began March 2025
- Launch Price: Long Range AWD now starts at $50,630 per Tesla Oracle
- China Orders: 70,000+ in first 5 days
- Improvements: 10% efficiency gains, 8-inch rear screen, 22% less road noise
📉 Cybertruck Struggles (2025)
- Q3 2025 Sales: ~5,400 units (down 63% YoY) per WebProNews
- Production Cuts: Tesla reduced production lines, shifted workers to Model Y
- Market Position: Lost best-selling electric pickup title to Ford F-150 Lightning
- Total Production: Only 63,619 units from Nov 2023 to Oct 2025 revealed via recall filing
🏛️ DOGE Political Fallout (Q1 2025)
- Yale Study: Found Musk's political involvement cost Tesla 1-1.26 million U.S. vehicle sales
- Q1 2025 Impact: Net income plunged 71% to $409M; deliveries down 13% (biggest quarterly decline ever) per NPR
- Stock Damage: Shares fell 38% in early 2025
- Musk Response: Announced reduced DOGE involvement starting May 2025
🤖 FSD v14.2.2.2 Release (December 28, 2025)
- Latest Version: Rolled out following rapid iteration
- Unsupervised Testing: Tesla began testing robotaxis without human safety monitors in Austin
- Musk Testing: CEO and AI Director publicly shared Christmas Eve rides in unsupervised robotaxis
- Fleet Size: Approximately 31 robotaxis in Austin, under 150 in Bay Area
- Missed Target: October prediction of "500+ vehicles in Austin" and "1,000+ in Bay Area" by year-end not achieved per InsideEVs
📊 Analyst Activity (December 2025)
- Wedbush: Buy rating, $600 price target (December 15)
- Deutsche Bank: Buy rating, $500 price target (December 19)
- Truist: Hold rating, $444 price target (December 19)
- Consensus: Hold from 26 analysts per Stock Analysis
- Rating Split: 23% Strong Buy, 23% Buy, 31% Hold, 12% Sell, 12% Strong Sell
🎲 Price Targets & Probabilities
Using the gamma exposure analysis, implied move data, and upcoming catalyst timeline, here's where TSLA could realistically trade:
🐂 Bull Case: $480-$500 (6.7% to 11.1% upside)
Path to Get There:
- ✅ Q4 deliveries beat the 422,850 consensus (or at least don't miss badly)
- ✅ Q4 earnings show energy segment maintaining 30%+ gross margins
- ✅ Affordable vehicle production timeline confirmed for Q1 2026
- ✅ Cybercab crash testing completed successfully, April production on track
- ✅ Positive FSD regulatory news from California or Texas
Key Gamma Levels to Break:
- Clear $455 resistance (1.2% up)
- Push through $460 (2.3% up)
- Break $470 strong resistance (4.5% up)
- Target $480-$500 zone (major call gamma concentration with 31.61 total GEX at $500)
Probability: 25-30%
The monthly implied move shows $475 as the upper range for mid-January, which aligns with this bull target. Net GEX bias is bullish (371.45 call vs. 307.31 put), and breaking through $470 could trigger dealer buying to hedge short call positions. However, execution risks are elevated - any delivery miss or margin compression in Q4 earnings kills this scenario.
🎯 Base Case: $440-$460 Range (±2.2%)
Most Likely Scenario:
- 📊 Q4 deliveries come in around consensus expectations
- 💰 Earnings show mixed results (energy strong, auto margins weak)
- ⏳ Catalyst timelines pushed back slightly but not materially
- 🌍 China competition remains intense, but FSD rollout progresses
Key Support/Resistance Levels:
- $450 pin zone - Absolutely massive 63.66 total GEX right at current price
- $440 support - Strongest support level (32.98 GEX)
- $455-$460 resistance - Combined 75.05 total GEX creates ceiling
Probability: 45-50%
This is what the weekly implied move (±2.05% or $440.50-$458.90 range) is telling us. The gamma profile shows TSLA is essentially pinned at $450 with massive options activity creating a gravity well. Unless we get a significant catalyst, the stock grinds within this tight range through early January. Market makers will hedge to keep it range-bound given the concentration of near-term options expiring January 2.
🐻 Bear Case: $400-$430 (-11.1% to -4.4% downside)
Path to Disaster:
- ❌ Q4 deliveries miss the already-lowered 422,850 consensus significantly
- ❌ Q4 earnings show automotive margins compressing below 17%
- ❌ Affordable vehicle launch delayed beyond H1 2026
- ❌ Cybercab production timeline pushed back due to regulatory issues
- ❌ China market share continues collapsing (already fell out of top 10 NEV manufacturers in October per CnEVPost)
- ❌ BYD reports continued dominance in global EV sales
Key Support Levels to Watch:
- $440 - First major support (32.98 total GEX with -8.20 net put wall)
- $430 - Secondary support (22.96 total GEX with -9.18 net, heavy institutional put protection)
- $400 - Deep support (20.61 total GEX, psychological round number)
Probability: 20-25%
The monthly implied move shows $424 as the lower range, and the quarterly move extends down to $381. The gamma profile shows meaningful put walls at $440 and $430, suggesting institutions have hedged for downside. Given Q4 delivery expectations are already low and Tesla pre-announced consensus (unusual move), a significant disappointment is possible. The bear case hinges on execution failures across multiple fronts - missing on both deliveries AND profitability would trigger this scenario.
Critical Level: If $440 breaks with volume, the next stop is $430, then potentially $400. The put gamma concentrations at these levels should provide strong buying support from dealer hedging.
💡 Trading Ideas
🛡️ Conservative: Cash-Secured Put at $440 Strike
The Play:
- Strategy: Sell the January 16, 2026 $440 Put
- Premium Collected: Approximately $8-10 per share ($800-$1,000 per contract)
- Capital Required: $44,000 per contract (cash-secured)
- Max Profit: Premium collected (1.8-2.3% return in 16 days)
- Max Loss: If TSLA crashes below $440, you own it at $440 (but you wanted to own TSLA anyway at that price)
Why This Works:
- ✅ Selling puts at the strongest gamma support level ($440 has 32.98 total GEX)
- ✅ Monthly implied move lower range is $424, so $440 has cushion
- ✅ If assigned, you're owning TSLA at prices near June 2025 lows with Q4 earnings de-risked
- ✅ You collect premium either way - if TSLA stays above $440, you keep the cash
Best For: Investors who want to own TSLA but think it might dip after year-end profit-taking. You're getting paid to wait.
Risk Management: If TSLA breaks below $430 with volume, consider rolling the put down and out to February expiration to collect more premium and avoid assignment.
⚖️ Balanced: Call Calendar Spread ($470 Strike)
The Play:
- Strategy: Sell January 16, 2026 $470 Call, Buy March 20, 2026 $470 Call
- Net Cost: Approximately $3-5 per share ($300-$500 debit per spread)
- Max Profit: If TSLA is right at $470 on January 16 expiration
- Risk: Limited to premium paid ($300-$500)
Why This Works:
- 🎯 $470 has strong call gamma resistance (27.64 total GEX with +12.51 net)
- 📅 You're shorting near-term elevated implied volatility (5.71% monthly move) and buying longer-term (15.19% quarterly move) where Q4 earnings and Cybercab production catalysts live
- 💰 Time decay works in your favor - the January short call decays faster than the March long call
- 🚀 If TSLA rallies hard after January expiration, you own the March call to participate
Best For: Traders who think TSLA stays range-bound short-term but could break out by March when Cybercab production news hits. This is a volatility play that profits from time decay.
Breakeven: TSLA needs to be between roughly $465-$475 at January expiration for this to work well.
🚀 Aggressive: Bull Put Spread Targeting Earnings Pop
The Play:
- Strategy: Sell March 20, 2026 $430 Put, Buy March 20, 2026 $400 Put
- Premium Collected: Approximately $8-12 per spread ($800-$1,200 credit per spread)
- Capital Required: $3,000 collateral per spread (difference between strikes)
- Max Profit: $800-$1,200 (26-40% return if TSLA stays above $430)
- Max Loss: $1,800-$2,200 (if TSLA crashes below $400)
Why This Works:
- 💪 Both strikes are at major gamma support levels (22.96 GEX at $430, 20.61 GEX at $400)
- 📊 March expiration captures Q4 earnings, potential affordable vehicle announcement, and Cybercab production start
- 🎯 The quarterly implied move shows $381 as lower range - your short strike at $430 has significant cushion
- ⚡ Energy segment strength (30%+ margins, record deployments) provides earnings floor
Best For: Bullish traders who believe Q4 earnings won't be a disaster and robotaxi progress continues. You're betting TSLA doesn't fall more than 4.4% from current levels by March.
The Risk: If Q4 deliveries badly miss AND automotive margins compress below 15% AND Cybercab gets delayed, this spread could hit max loss. You need at least one of the three major catalysts (deliveries, earnings, Cybercab) to not completely fail.
Risk Management: If TSLA breaks below $440 with volume before earnings, consider closing for a small loss rather than holding through the event.
⚠️ Risk Factors
📉 Execution Risks (HIGH PROBABILITY)
What Could Go Wrong:
-
🚗 Q4 Deliveries Miss: Consensus is already low at 422,850 units (down 15% YoY), but the market is pricing in execution. Any significant miss below 410,000 units could trigger selling. Remember, Tesla unusually pre-published consensus on December 29 per Electrek, which suggests they're managing expectations.
-
🤖 Robotaxi Regulatory Delays: Unsupervised FSD approval remains uncertain. California permits still pending, and any setback pushes back the entire Cybercab production timeline. The Motley Fool notes that commercial operation requires regulatory clearance first.
-
🏭 Production Timeline Slips: Semi and affordable vehicle have been repeatedly delayed. Cybertruck is running at less than 10% capacity with only 63,619 total units produced from November 2023 to October 2025. What's to say Cybercab won't slip past April 2026?
🌍 Competitive Threats (VERY HIGH PROBABILITY)
The China Problem:
- 📊 BYD Dominance: Through Q3 2025, BYD sold 1.6 million pure EVs vs. Tesla's 1.22 million - a lead of 388,000 units per CarNewsChina
- 🇨🇳 Market Share Collapse: October 2025 China sales fell to just 26,006 units (lowest since November 2022), representing only 2.03% market share. Tesla fell out of top 10 NEV manufacturers for the first time since August 2022.
- 🏆 129 Competitors: China has 129 EV brands competing. Huawei, Xiaomi-backed EVs, and domestic rivals surging 90%+ in sales while Tesla struggles.
U.S. Competitive Pressure:
- 🚙 Ford F-150 Lightning now outsells Cybertruck
- 🤖 Waymo and Zoox expanded rapidly in 2025 robotaxi operations
💰 Margin Compression (HIGH PROBABILITY)
Profitability Under Pressure:
- 📉 Q3 gross margin compressed to 18.0% from 19.8% YoY
- 💸 Operating costs surged 50% YoY due to AI/R&D investments and tariffs per Shacknews
- 🎫 Regulatory credit revenue dropped to $417M from $739M year earlier
- ⚠️ Automotive margins (17%) significantly trail energy segment (30%+)
The Math Problem: Tesla is spending aggressively on R&D for FSD, Optimus, Cybercab, and Semi while automotive revenue faces pricing pressure from Chinese competition. Unless volume surges from affordable vehicle launch, margins stay compressed.
🏛️ Political & Brand Damage (ONGOING RISK)
The DOGE Hangover:
- 📊 Yale study found Musk's political involvement cost 1-1.26 million U.S. vehicle sales
- 💔 Brand perception damaged among core progressive/environmental customer base
- 📉 Q1 2025 saw 71% net income plunge and 13% delivery decline during peak DOGE involvement
While Musk reduced DOGE involvement starting May 2025, brand damage may persist into 2026.
💸 Valuation Risk (CRITICAL FOR OPTIONS TRADERS)
The P/E Problem:
- 📊 Trading at 307x earnings while net income fell 37% in Q3
- 🎯 Analyst consensus price target of $402-$414 suggests 11-8% downside from current $450 levels per Stock Analysis
- ⚖️ 24% of analysts rate Sell/Strong Sell
- 🎰 Stock is priced for near-perfect execution on autonomous driving, Cybercab, Optimus, and energy storage
Translation: Any meaningful disappointment on key catalysts could trigger sharp correction. The $46M bear put spread closing we saw today suggests at least one large trader thought the risk/reward wasn't favorable holding through year-end.
📅 Tax Credit Cliff (Q1 2026 HEADWIND)
- 🚗 Q3 deliveries were boosted by customers rushing to capture the $7,500 EV tax credit before expiration per Tesery
- ⏬ This creates a demand pull-forward effect - sales in Q1 2026 could be weaker as buyers who would have purchased in Q1 already bought in Q3/Q4
🔍 What Smart Money Is Saying
The $46M protective put spread opening tells us:
- ✅ At least one sophisticated trader is hedging a large TSLA long position into year-end
- 📊 The extreme unusualness (3.07 Z-score on the $507.5 strike = 555x average activity) confirms this was institutional-sized
- ⏰ They're opening protection just 2 days before expiration - suggests concern about near-term volatility or locking in year-end gains for tax purposes
- 💭 They remain long TSLA but want downside protection through Q4 delivery numbers and into Q1 catalysts
🎯 The Bottom Line
Real talk: This $46M protective put spread opening is someone hedging a big TSLA long into year-end. They're not betting against the stock - they own it and want protection. The deep ITM strikes ($505-$520 when stock is at $451) lock in gains from TSLA's run while still allowing participation if the stock rallies further.
Here's Your Action Plan:
✅ If You Own TSLA:
- Watch $440 support - That's the line in the sand with massive put gamma wall
- Mark your calendar for early January - Q4 delivery numbers will set the tone for the entire quarter
- Hedge if nervous - Consider buying March $430 puts (trading around $15-18) to protect through earnings and Cybercab production start
👀 If You're Watching From The Sidelines:
- Conservative Entry: Wait for Q4 delivery numbers. If they beat and stock holds $440, consider entering
- Aggressive Entry: Start building position here at $450 if you believe in the 2026 catalyst timeline (Cybercab production, China FSD, affordable vehicle)
- Trader's Play: Sell premium at the $440-$450 pin zone while implied volatility is elevated before January 16 expiration
📉 If You're Bearish:
- Wait for a bounce - Don't chase the downside here. Let TSLA rally back to $460-$470 resistance before putting on new bearish positions
- Focus on Q4 earnings - That's the binary event. If margins compress below 16% AND deliveries disappoint, the bear case accelerates
- Watch China - If December China deliveries come in weak again, that confirms the competitive threat is accelerating
The Big Picture
Tesla is at an inflection point. The core automotive business is declining (2025 marks second consecutive year of falling deliveries), but the energy segment is thriving and robotaxi/FSD progress is real. The stock is trading at 307x earnings, which means it's priced for perfection on the autonomous driving story.
🎯 Next 60 Days Critical:
- January: Q4 deliveries + Q4 earnings
- February/March: Affordable vehicle production start confirmation + Optimus production-intent prototype
- March: FSD China rollout progress
Bulls need at least 2 of 3 major catalysts to deliver. Bears need execution failures across the board.
The $450 pin we're seeing in gamma exposure isn't an accident - that's where options traders have concentrated their bets, creating a temporary equilibrium. Breaking out of the $440-$460 range requires a real catalyst.
One thing's certain: The trader who opened that $46M hedge isn't panicking or selling - they're staying long but protecting their gains. That's sophisticated risk management worth paying attention to.
⚠️ DISCLAIMER: Options trading involves substantial risk and is not suitable for all investors. This analysis is for educational purposes only and does not constitute financial advice. The author may hold positions in securities discussed. Past performance does not guarantee future results. Always conduct your own research and consult with a qualified financial advisor before making investment decisions.
Data Sources: Trade data from proprietary options flow analysis. Company information from public sources. Gamma exposure calculations based on options open interest and standard dealer hedging assumptions. Implied move calculations based on ATM straddle pricing across multiple expirations.