TSLA Deep ITM Calls: $41.7M in Position Management Signals Smart Money Taking Profits
January 8, 2026 | Unusual Activity Detected
Company Overview
Tesla, Inc. (TSLA) is a vertically integrated battery electric vehicle automaker and developer of real-world artificial intelligence software, including autonomous driving systems and humanoid robots. The company also manufactures energy storage solutions, solar products, and operates charging networks and insurance services.
| Metric | Value |
|---|---|
| Market Cap | $1.43 Trillion |
| Sector | Motor Vehicles & Passenger Car Bodies |
| Current Price | $436.09 |
| 52-Week High | $489.88 (December 16, 2025) |
| YTD 2026 Return | -5.8% |
The Quick Take
Someone is managing a massive position in deep in-the-money TSLA $100 strike calls worth $41.7M in total premium. With TSLA trading around $436, these $100 calls are roughly $336 in-the-money - meaning they're essentially synthetic stock positions. Four closing trades and one new short call suggest institutional profit-taking and position restructuring ahead of Q4 earnings on January 28, 2026.
The Option Flow Breakdown
What Just Happened
| Time | Symbol | Buy/Sell | Call/Put | Expiration | Strike | Volume | OI | Size | Premium |
|---|---|---|---|---|---|---|---|---|---|
| 11:37:36 | TSLA20260116C100 | SELL | CALL | 2026-01-16 | $100 | 1,500 | 4,830 | Large | $8.3M |
| 11:37:33 | TSLA20260116C100 | SELL | CALL | 2026-01-16 | $100 | 1,200 | 4,830 | Large | $8.3M |
| 11:21:37 | TSLA20260116C100 | SELL | CALL | 2026-01-16 | $100 | 960 | 4,830 | Large | $8.4M |
| 11:10:47 | TSLA20260116C100 | SELL | CALL | 2026-01-16 | $100 | 710 | 4,830 | Large | $8.3M |
| 11:06:20 | TSLA20260116C100 | SELL | CALL | 2026-01-16 | $100 | 460 | 4,830 | Medium | $8.4M |
Option Symbol: TSLA20260116C100
Total Volume: 4,830 contracts Total Premium: $41.7M Expiration: January 16, 2026 (8 days out)
Detected Option Strategies
1. Closing Calls (Profit-Taking): Four of the five trades (totaling $33.4M) are Sell-to-Close (STC) orders. Traders who previously purchased these deep ITM calls are now liquidating their positions to lock in gains.
2. Short Call (Income/Covered Call): The $8.3M Sell-to-Open (STO) trade represents a new short call position, likely part of a covered call strategy where the trader owns underlying TSLA shares and is selling calls against them.
What This Actually Means
These are deep in-the-money calls - with TSLA at $436 and the strike at $100, each contract has roughly $336 of intrinsic value. Here's why this matters:
The Four Closing Trades (STC - Sell to Close): Someone who owned these calls is cashing out $33.4M worth of positions. These traders likely bought these calls months or years ago at much lower prices and are now locking in substantial profits.
The One Opening Trade (STO - Sell to Open): This $8.3M trade opened a new short call position. Selling deep ITM calls is typically part of a covered call strategy - the trader owns TSLA shares and is selling calls against them to generate income or establish an exit price.
Translation: Big money is taking chips off the table. When institutional traders close massive deep ITM call positions just 8 days before expiration - and right before a major earnings report - it often signals they're satisfied with gains and want to reduce exposure to upcoming volatility.
Technical Setup
YTD Chart Analysis
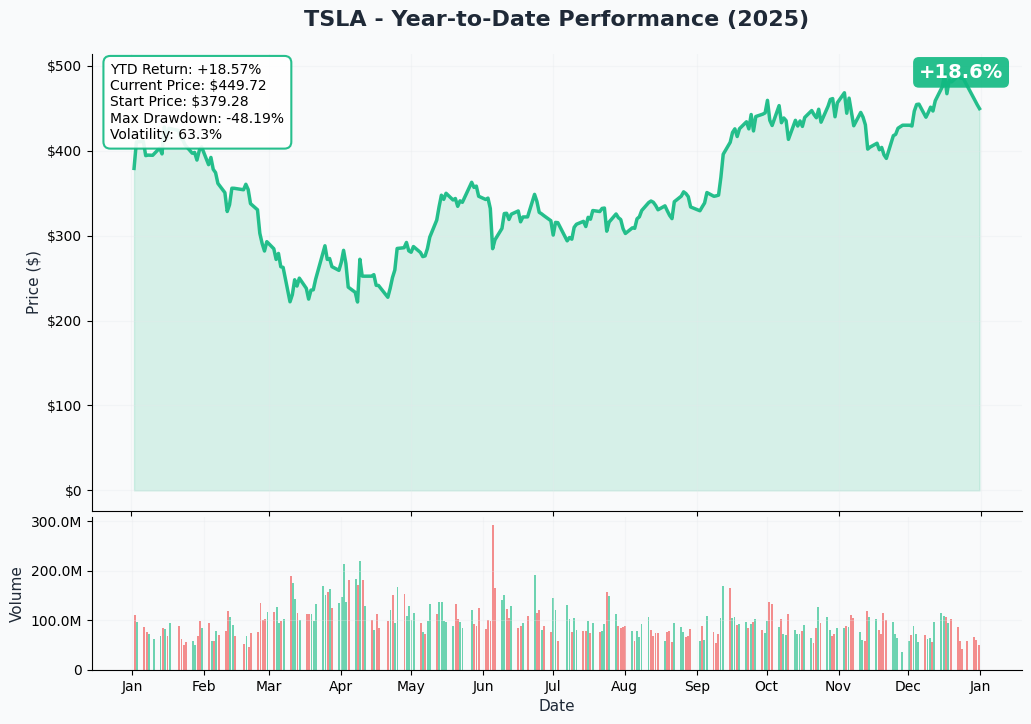
TSLA had a volatile 2025, starting at $379.28 and experiencing a maximum drawdown of -48.19% before recovering to close the year up +18.57%. The stock hit its 52-week high of $489.88 in mid-December 2025 but has since pulled back about 11%. Current price action shows the stock consolidating after the December rally, with volatility at 63.3% - significantly elevated compared to the broader market.
Gamma-Based Support & Resistance Analysis
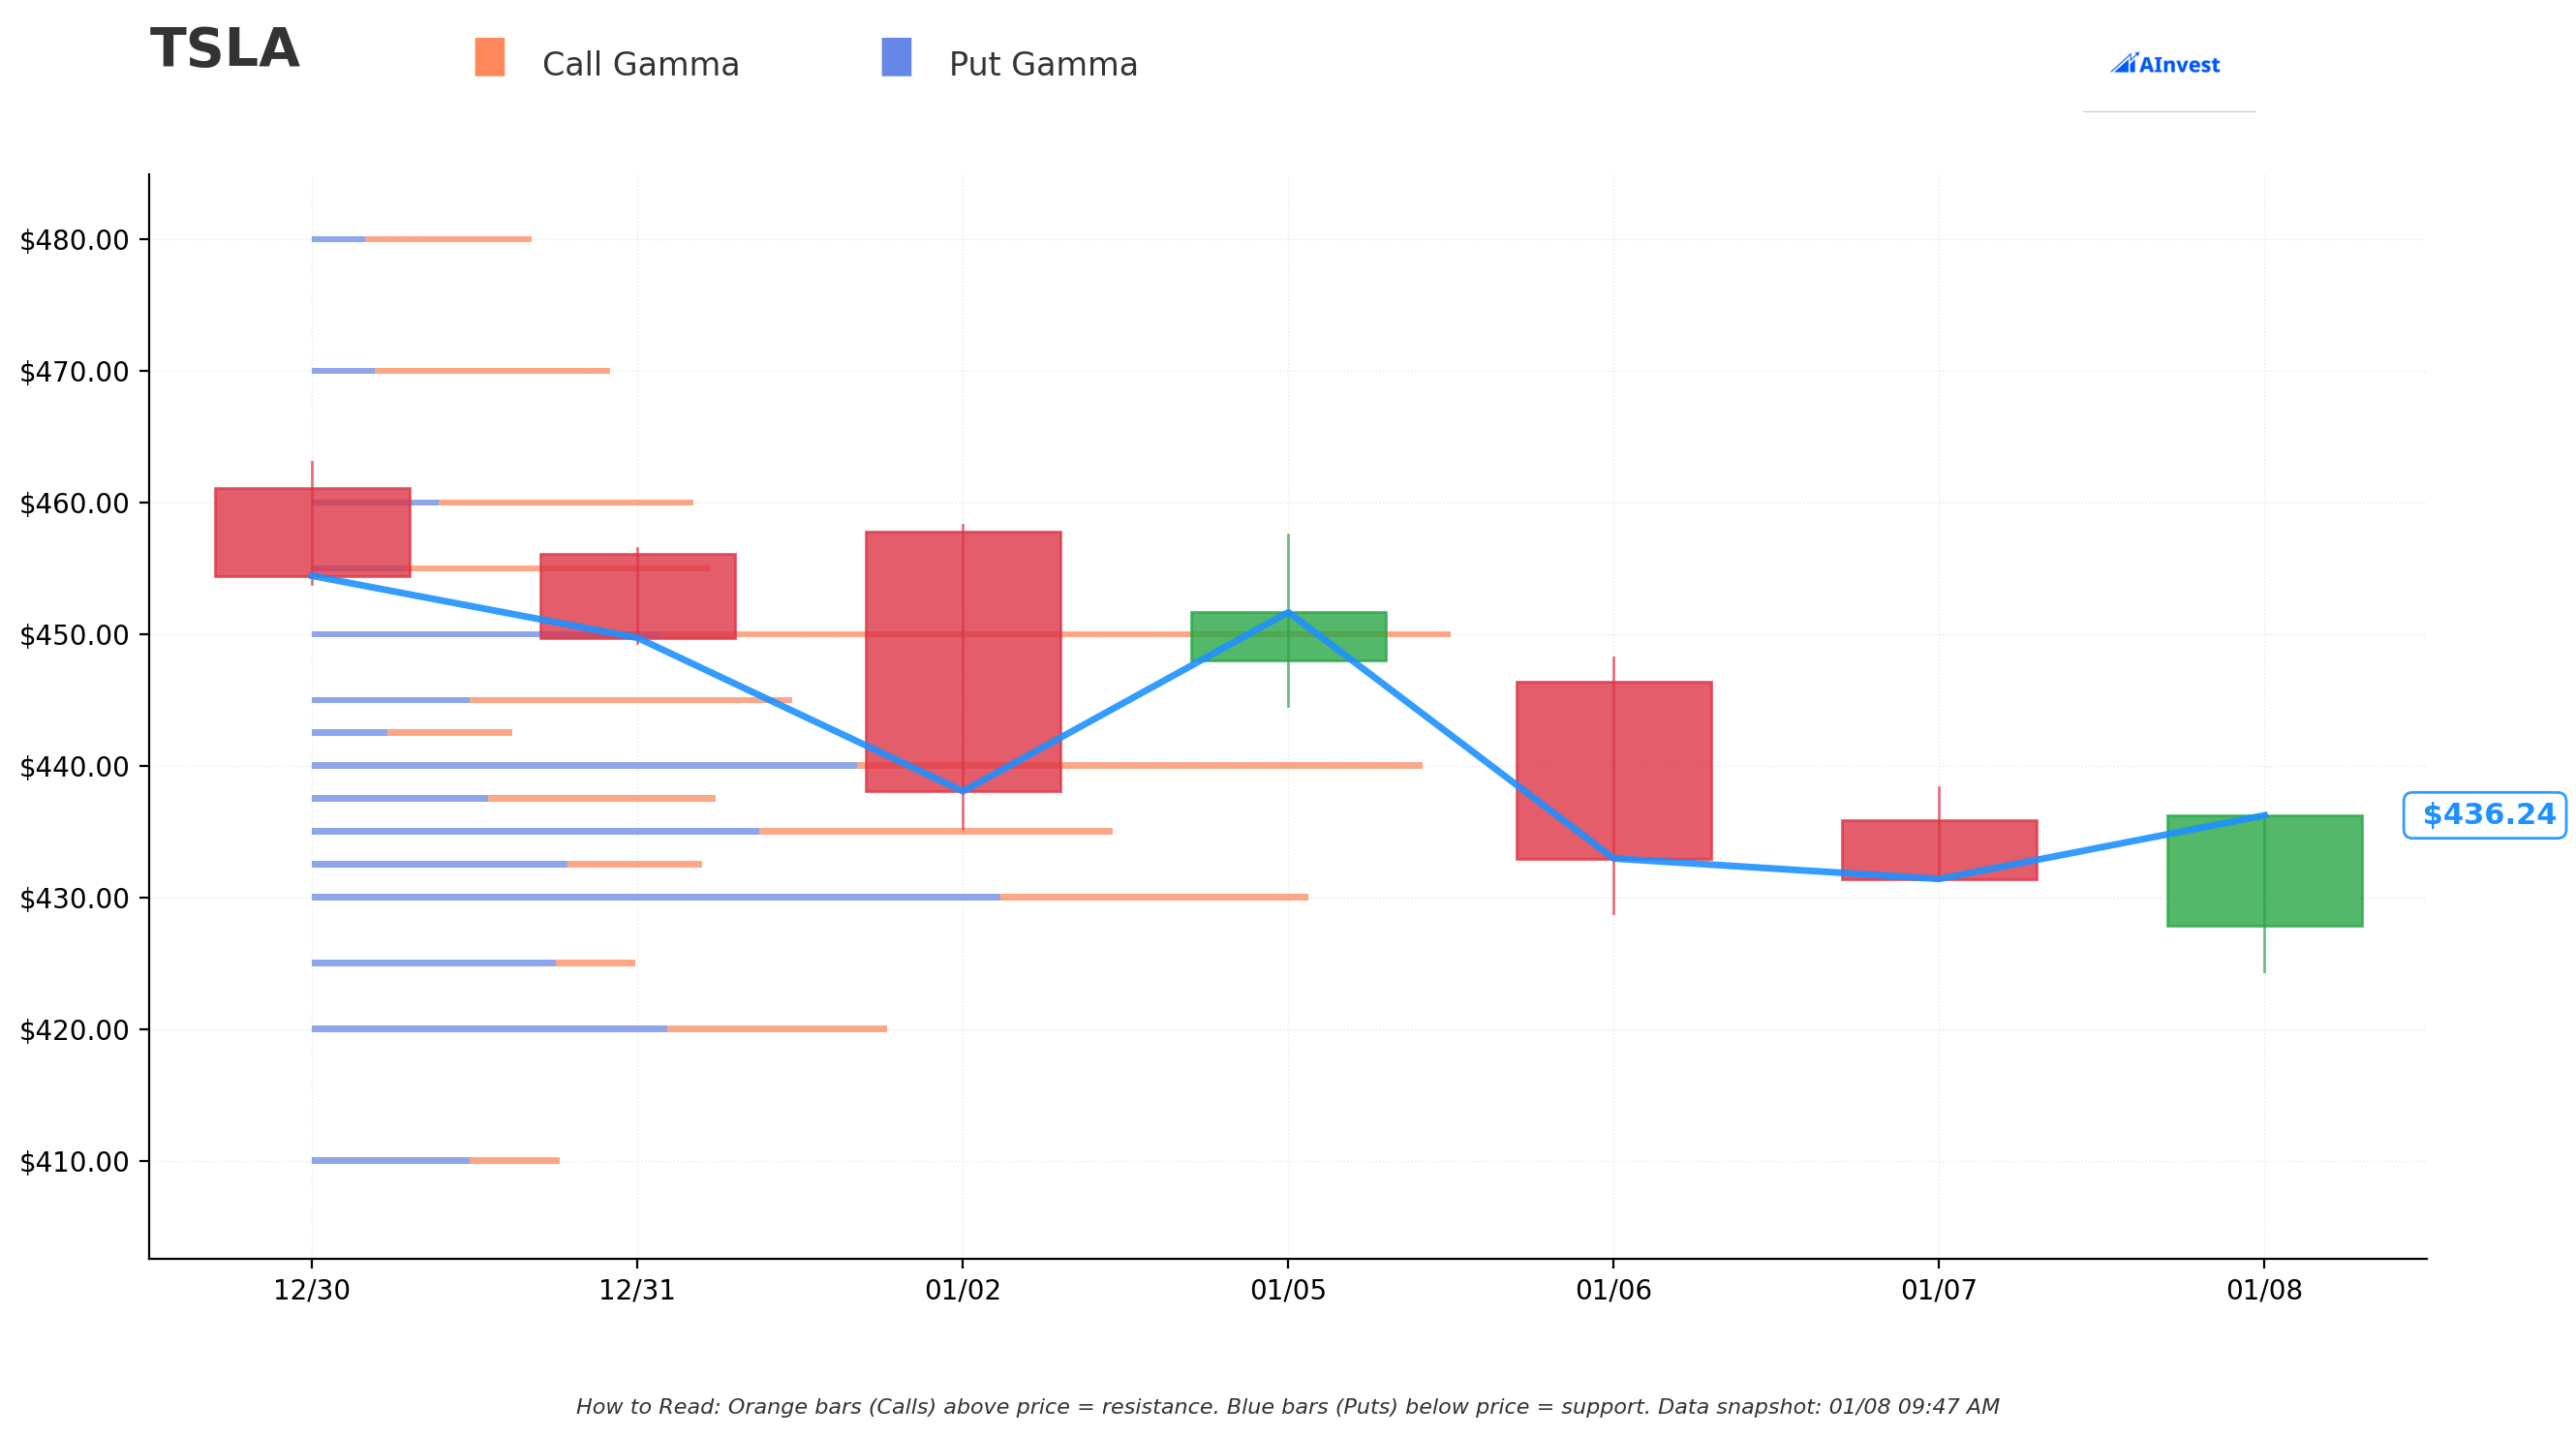
Reading the Gamma Chart:
- Orange bars (Call Gamma) above the price line = Resistance levels
- Blue bars (Put Gamma) below the price line = Support levels
- Current price: $436.24
Key Levels from Gamma Exposure:
- Strong Resistance: $450-$460 zone shows heavy call gamma - expect price to face headwinds here
- Pivot Zone: $430-$440 has mixed positioning - current battleground
- Support: $420-$430 shows put gamma accumulation - likely floor in the near term
- Deep Support: $410 level shows additional put gamma - secondary floor
The gamma structure suggests TSLA is currently in a consolidation zone with resistance overhead at $450 and support below at $420. The recent selloff from $450+ has found buyers near current levels.
Implied Move Analysis
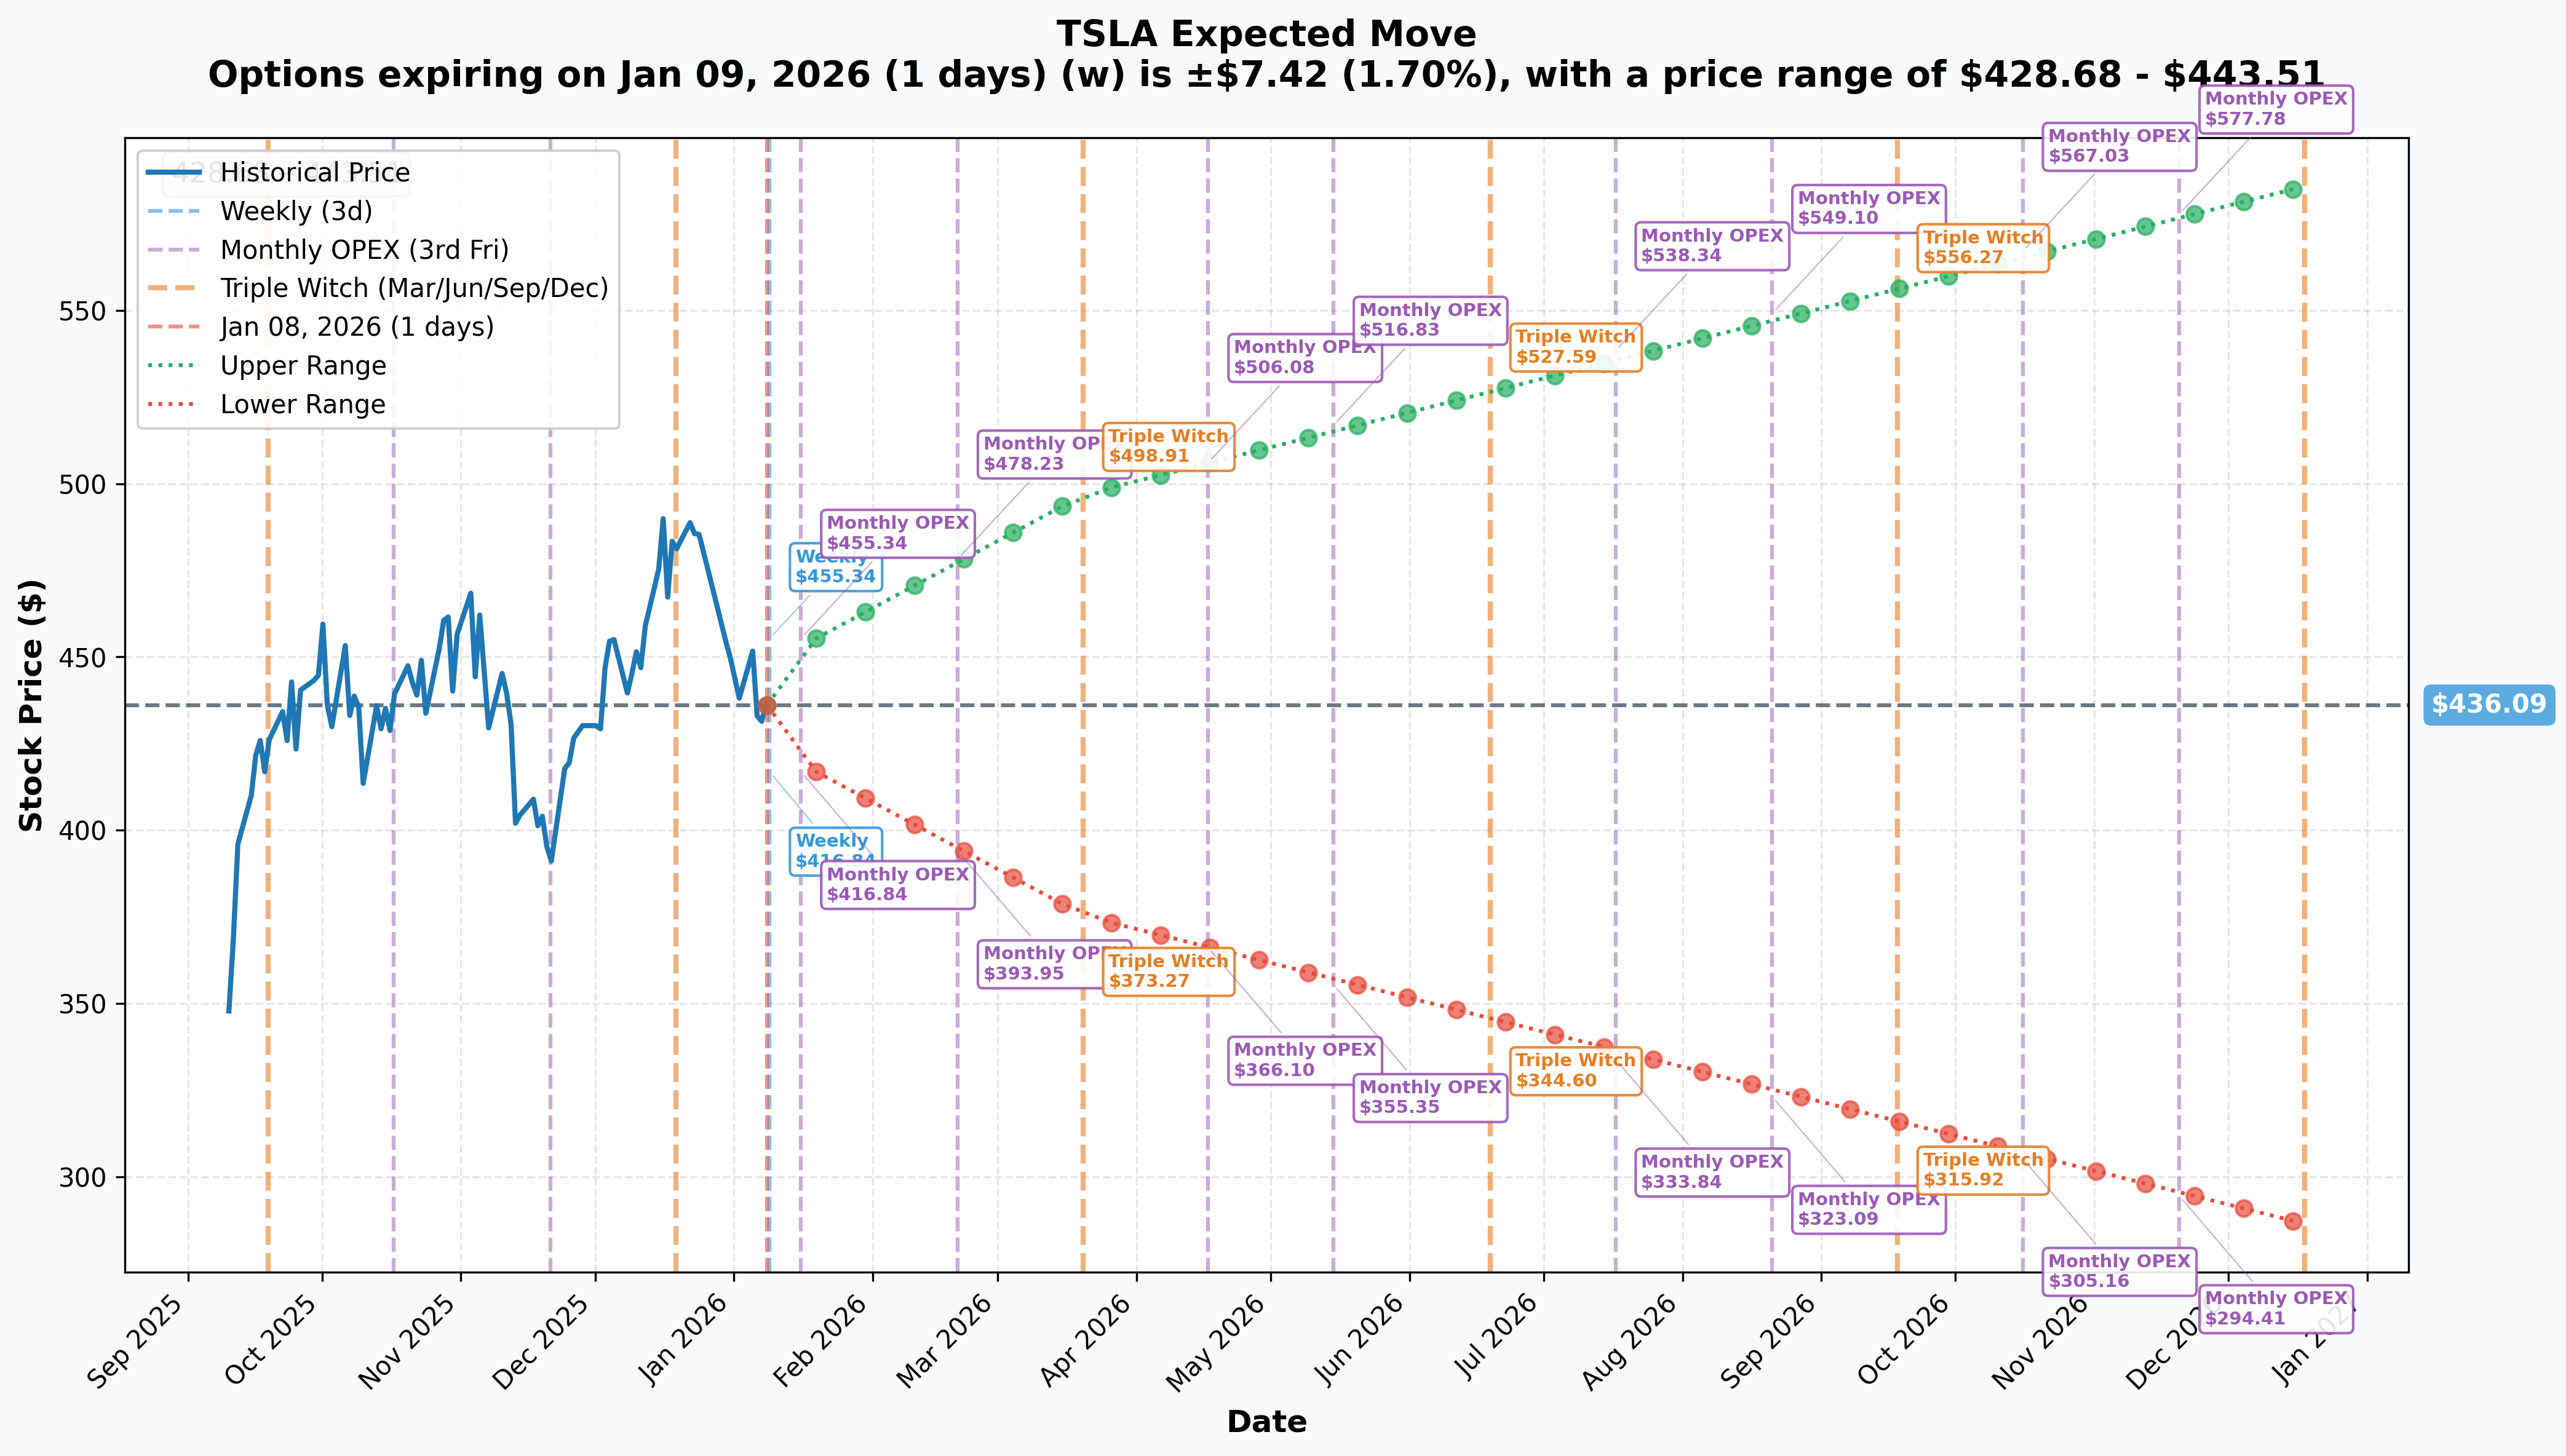
Options Market Expected Ranges:
| Timeframe | Expiration | Implied Move | Expected Range |
|---|---|---|---|
| Weekly | Jan 9, 2026 | +/-1.7% ($7.42) | $428.68 - $443.51 |
| Monthly OPEX | Jan 16, 2026 | +/-3.94% ($17.17) | $418.92 - $453.26 |
| Quarterly | Mar 20, 2026 | +/-13.96% ($60.86) | $375.23 - $496.95 |
| Yearly LEAPS | Dec 18, 2026 | +/-34.36% ($149.83) | $286.26 - $585.93 |
Key Observation: The January 16 expiration (same as our unusual trades) implies a range of $418.92 to $453.26. The fact that massive positions are being closed at the $100 strike suggests traders expect the stock to remain well above $100 but may not believe it will continue climbing aggressively into earnings.
Catalysts
Upcoming Events (Next 30 Days)
| Date | Event | Significance |
|---|---|---|
| January 28, 2026 | Q4 2025 Earnings (After Close) | Major catalyst - consensus expects $23.37B revenue, $0.34-$0.46 EPS |
| April 2026 | Cybercab Production Start | First dedicated robotaxi vehicle launch at Gigafactory Texas |
According to Tesla Investor Relations, the Q4 earnings call will provide critical updates on:
- Vehicle delivery guidance for Q1 2026
- FSD revenue recognition and take rate
- Robotaxi expansion timeline
- Cybercab production confirmation
Recent Events (Last 30 Days)
Q4 2025 Vehicle Deliveries (January 2, 2026):
- Q4 Deliveries: 418,227 vehicles (missed consensus of 426,000), according to CNBC
- Full Year 2025: 1,636,129 vehicles (-8.6% YoY) - second consecutive annual decline
- Energy Storage Record: 14.2 GWh deployed in Q4, 46.7 GWh for full year (+48.7% YoY), per Tesla Investor Relations
BYD Overtakes Tesla (January 2, 2026):
- BYD delivered 2.26 million BEVs in 2025 vs Tesla's 1.64 million, per CNBC and CNN
- First time Tesla lost the global EV crown
Nvidia CES Announcement (January 6, 2026):
- TSLA fell 5% after Nvidia announced plans to develop autonomous driving systems, increasing competitive pressure, per Yahoo Finance
Price Targets & Probabilities
Based on gamma levels, implied moves, and catalyst analysis:
Bull Case: $453-$475 (25% probability)
- Trigger: Strong Q4 earnings beat on January 28 + positive FSD/robotaxi guidance
- Technical: Break above $450 gamma resistance opens path to $475
- Catalyst: Cybercab production timeline confirmation for April 2026, per InsideEVs
Base Case: $420-$445 (55% probability)
- Scenario: Stock consolidates in current range into earnings
- Technical: Supported by put gamma at $420, capped by call gamma at $450
- Implied Move: January OPEX range is $418.92-$453.26 - market expects this zone
Bear Case: $375-$400 (20% probability)
- Trigger: Earnings miss + production guidance cut + robotaxi delays
- Technical: Break below $420 support targets $375 (quarterly implied floor)
- Risk Factor: Yale study found Musk's political activities cost Tesla 1-1.26 million U.S. sales, per Fortune
Trading Ideas
Conservative: Cash-Secured Put at Support
The Trade: Sell TSLA $420 Put, January 31, 2026 expiration
- Premium: Approximately $8-$10 per contract
- Max Profit: Premium collected if TSLA stays above $420
- Breakeven: ~$410-$412
- Why This Works: You get paid to potentially buy TSLA at a 4% discount to current price. The $420 level has put gamma support, and even the bear case targets this area as a floor.
- Risk: Full assignment if TSLA crashes below $420 - be prepared to own shares
Balanced: Post-Earnings Call Spread
The Trade: Wait for earnings on January 28, then buy the February $440/$470 Call Spread
- Entry: After earnings volatility crush
- Cost: Approximately $8-$10 per spread
- Max Profit: $30 per spread if TSLA hits $470+
- Why This Works: Earnings will resolve near-term uncertainty. If guidance is strong, the Cybercab April launch becomes the next catalyst driver. Implied move shows $498.91 upper range by March triple witch.
- Risk: Loss limited to premium paid if TSLA stays below $440
Aggressive: LEAPS Call for Autonomy Thesis
The Trade: Buy TSLA $500 Call, December 2026 expiration
- Cost: Approximately $65-$80 per contract
- Breakeven: ~$565-$580 by December 2026
- Max Profit: Unlimited upside
- Why This Works: The LEAPS implied range shows $585.93 as the upper bound. If Cybercab launches successfully in April, unsupervised FSD gets approved, and Tesla Semi ramps production, the autonomy thesis could drive significant upside.
- Risk: Premium decay if catalysts disappoint. According to The Motley Fool, 2026 is positioned as the year of the Tesla robotaxi - but execution risk is high.
Risk Factors
Execution Risk:
- Cybercab production depends on unsupervised FSD approval not yet received anywhere
- Tesla robotaxis currently crashing more than 10x as frequently as human drivers, per Wikipedia
Competitive Pressure:
- BYD now the global EV leader with aggressive pricing
- Waymo providing 250,000+ rides per week vs Tesla's ~135 vehicles
- Nvidia entering autonomous driving space adds software competition
Valuation Risk:
- At $1.43T market cap, Tesla trades at roughly 70x forward earnings
- Average analyst price target is $393.89-$414.92, implying 5-10% downside from current levels, per Stock Analysis
- UBS has a $247 target; GLJ Research has $25.28, per Investing.com
Political/Brand Risk:
- Musk's DOGE involvement continues to impact brand perception, per CBS News and NPR
- $7,500 federal EV tax credit was eliminated September 2025
The Bottom Line
Here's the deal: The $41.7M in deep ITM call activity we're seeing today is classic institutional position management, not a directional bet. When traders close positions in $100 strike calls with TSLA at $436, they're taking profits on bets that worked - not making new predictions.
What this tells us:
- Smart money is satisfied with current gains and reducing exposure before earnings
- The new short call ($8.3M STO) suggests covered call selling - generating income on existing shares
- Timing matters - 8 days to expiration + 20 days to earnings = reduce risk window
Your Action Plan:
- If you own TSLA: Consider the covered call strategy - the January 16 $450 calls could generate income if you're willing to cap upside
- If you're watching: Wait for Q4 earnings January 28 before initiating new positions - implied volatility will be elevated until then
- If you're bearish: The $420 put gamma support and implied move floor suggest limited near-term downside - timing a short is difficult here
Mark your calendar: January 28, 2026 after market close - Q4 earnings will be the next major catalyst that determines whether TSLA continues consolidating or breaks out of this range.
Disclaimer
This analysis is for informational purposes only and does not constitute investment advice. Options trading involves substantial risk of loss and is not suitable for all investors. The unusual options activity discussed may not indicate future stock performance. Past performance does not guarantee future results. Always conduct your own due diligence and consider consulting with a licensed financial advisor before making investment decisions.
Data sourced from Ainvest Option Flow and publicly available financial reports as of January 8, 2026.