TSLA (Tesla, Inc.) - Unusual Options Activity Report
Date: January 30, 2026 | Sector: Motor Vehicles & Passenger Car Bodies | Market Cap: $1,563.1B
Company Overview
Tesla, Inc. is the world's leading vertically integrated battery electric vehicle maker and a developer of real-world AI software, including autonomous driving (FSD) and humanoid robots (Optimus). Beyond EVs, Tesla operates a fast-growing energy storage business (Megapack) and is pushing into robotaxis, with unsupervised operations already underway in Austin. Love it or hate it, this is one of the most catalyst-dense names on the planet right now.
| Metric | Value |
|---|---|
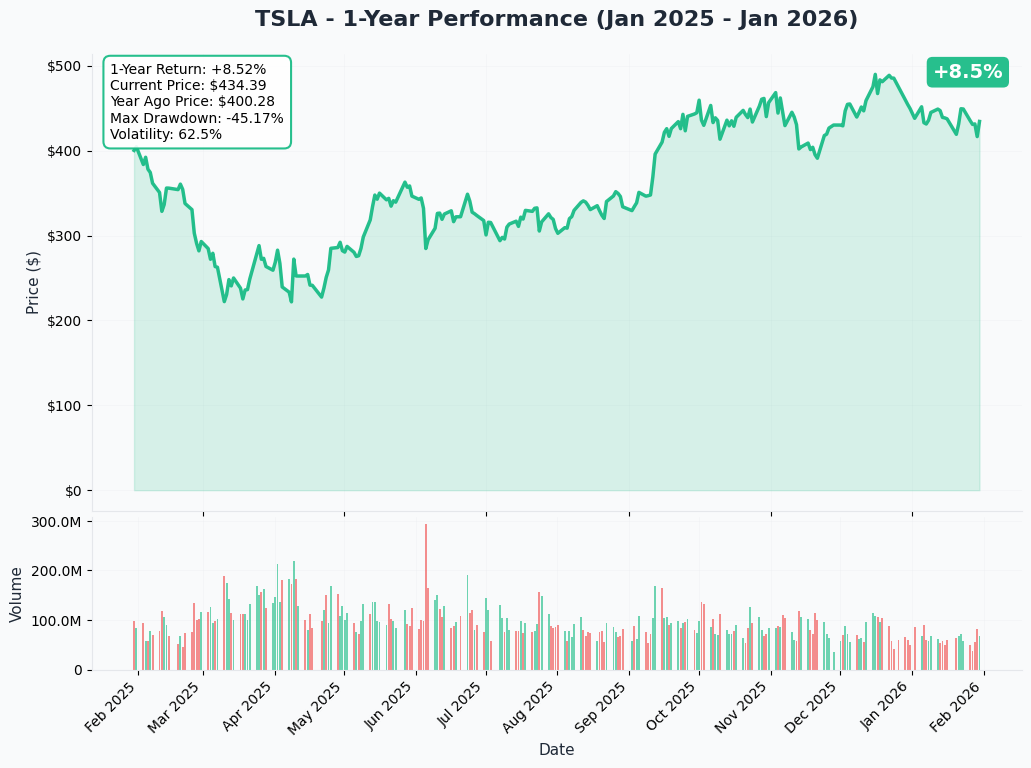
| Current Price | $438.65 |
| Market Cap | $1,563.1B |
| 52-Week Range | $214.25 - $498.83 |
| P/E (TTM) | ~406x |
| Sector | Motor Vehicles & Passenger Car Bodies |
YTD Price Chart
🚨 Unusual Options Activity Detected
Someone just dropped $13 million on TSLA puts. That is not a casual trade. Let's break it down.
Trade Details
| Time | Symbol | Side | Buy/Sell | Type | Expiration | Premium | Strike | Volume | OI | Size | Spot Price | Option Price |
|---|---|---|---|---|---|---|---|---|---|---|---|---|
| 10:50:12 | TSLA | ASK | BUY | PUT $430 | 2026-03-06 | $13M | $430 | 7,300 | 484 | 6,969 | $438.65 | $19.00 |
Vol/OI Ratio: 15.08x | Z-Score: EXTREMELY UNUSUAL
View TSLA 03/06 $430 Put on Ainvest
🔍 Trade Interpretation
What Happened
A single buyer lifted the ask on 6,969 contracts of the TSLA March 6 $430 put, paying $19.00 per contract for a total outlay of roughly $13 million. The trade was executed as a Buy to Open (BTO), meaning this is a brand-new position -- not someone closing an existing trade.
Why This Matters
- 📈 Volume/OI Ratio of 15.08x -- Open interest was only 484 contracts before this trade. That means the buyer bought more than 14x the entire existing open interest in a single clip. This is textbook institutional-scale activity.
- 🎯 Slightly OTM -- The $430 strike sits about 2% below the current $438.65 spot price. This isn't deep out-of-the-money speculation -- it's a very targeted, near-the-money bet.
- 📅 35 days to expiration -- Enough time for a meaningful move but not so far out that theta burn is negligible. This suggests the buyer expects a catalyst-driven move in the next month.
- 💰 $13M premium -- At this size, you're looking at a hedge fund or institutional desk. Retail doesn't casually write $13 million checks on puts.
Possible Motivations
-
Portfolio Hedge: Tesla is one of the most widely held stocks in the world. A large long holder sitting on enormous gains could be buying downside protection ahead of a volatile period (FSD transition Feb 14, Cybercab production ramp, SpaceX merger uncertainty).
-
Directional Bearish Bet: The buyer believes TSLA will trade below $430 by early March. Given the post-earnings volatility and the stock's 406x P/E, a pullback to $430 (about 2% lower) is well within the weekly implied move.
-
Event Hedge: With the FSD subscription-only transition on February 14 and continued uncertainty around the SpaceX merger rumors, this could be targeted protection around a specific binary event.
Breakeven Analysis
- Breakeven at expiration: $411.00 ($430 strike - $19.00 premium)
- That's 6.3% below current price -- a meaningful move but within the monthly implied move of +/-6.9%
- Max loss: $13M (full premium) if TSLA stays above $430 through March 6
- Max profit: Theoretically unlimited to the downside (but realistically capped by Tesla not going to zero in 35 days)
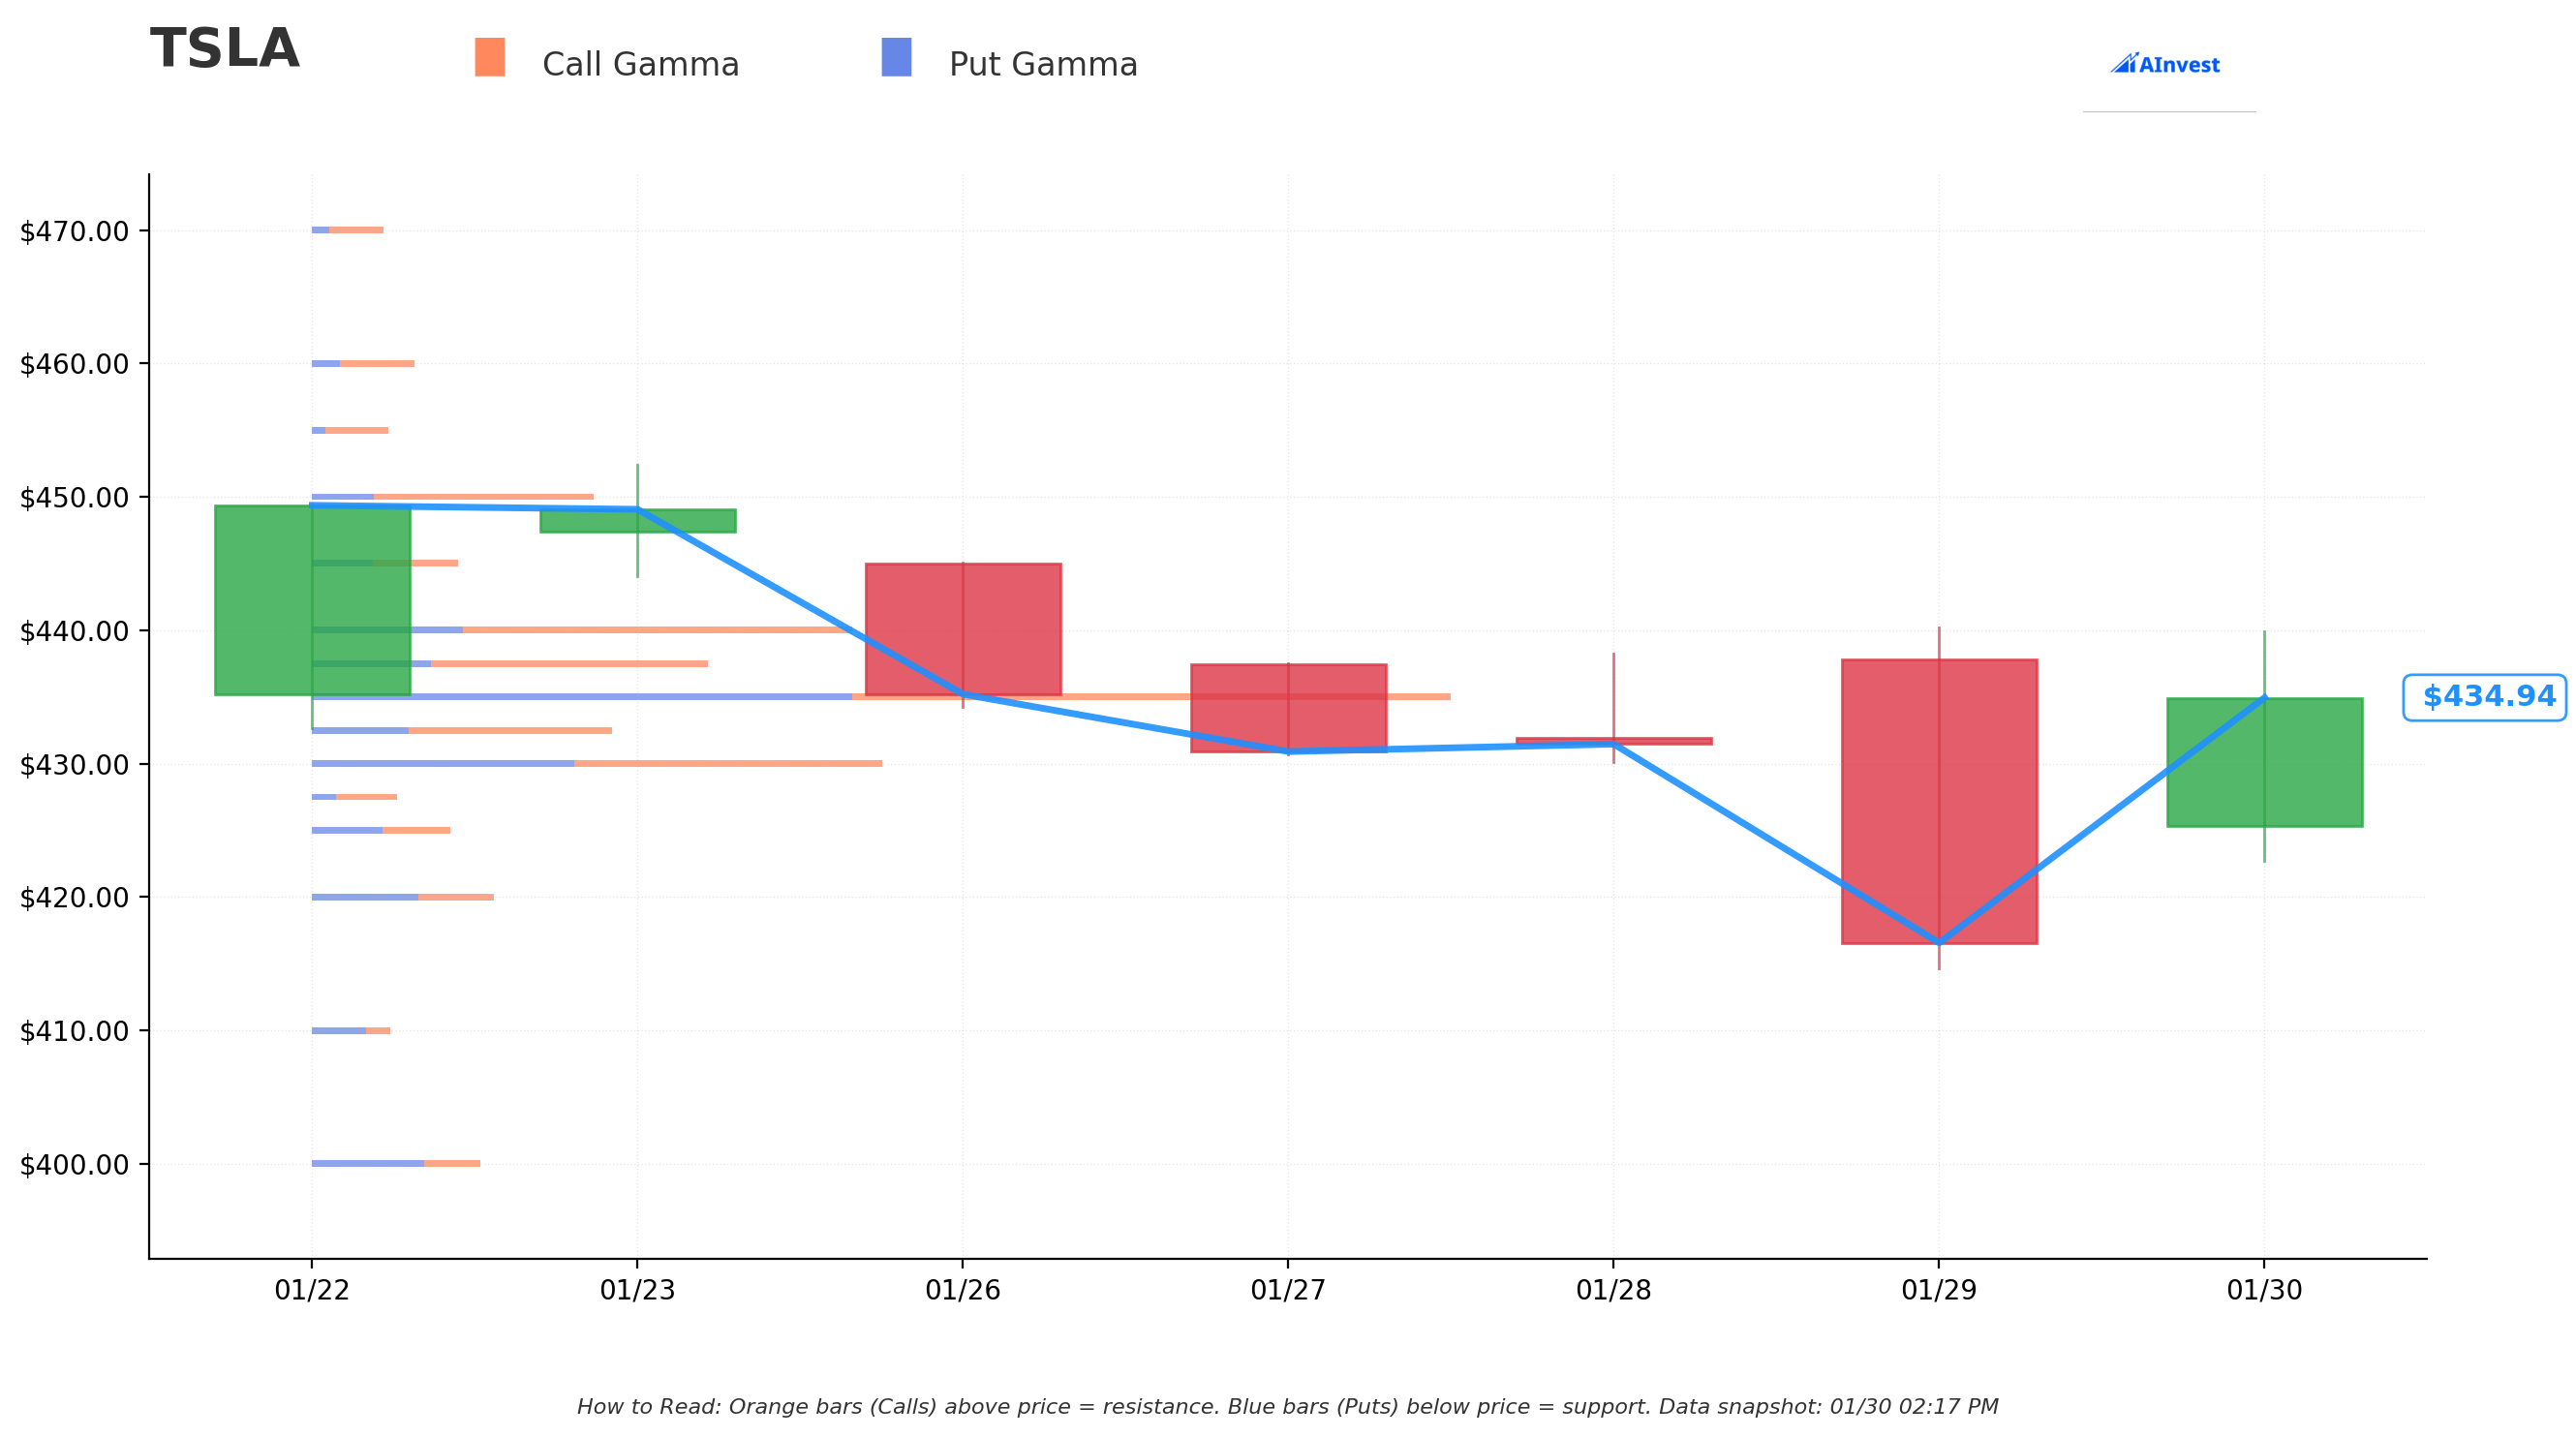
📊 Gamma Exposure (GEX) & Support/Resistance
| Level | Strike | Gamma Intensity | Type |
|---|---|---|---|
| Strongest Support | $435 | 167 | ✅ Key floor |
| Support | $432.50 | 41 | Secondary |
| Support | $430 | 73 | Put strike target |
| Support | $420 | 24 | Lower support |
| Support | $400 | 23 | Major psychological level |
| Strongest Resistance | $440 | 80 | Key ceiling |
| Resistance | $437.50 | 60 | Near-term cap |
| Resistance | $445 | 21 | Secondary |
| Resistance | $450 | 41 | Round number |
| Resistance | $500 | 23 | Major overhead |
Net GEX Bias: Bullish -- Dealers are net long gamma, which means they'll be buying dips and selling rips, creating a stabilizing effect around current levels.
What This Means for the Put Trade
The $430 strike lines up directly with a gamma support level (intensity: 73). If TSLA breaks through the $435 strongest support and the $432.50 secondary level, the $430 put strike becomes a magnet. But dealer hedging at $435 will act as a speed bump on the way down. The buyer needs a real catalyst to punch through that wall.
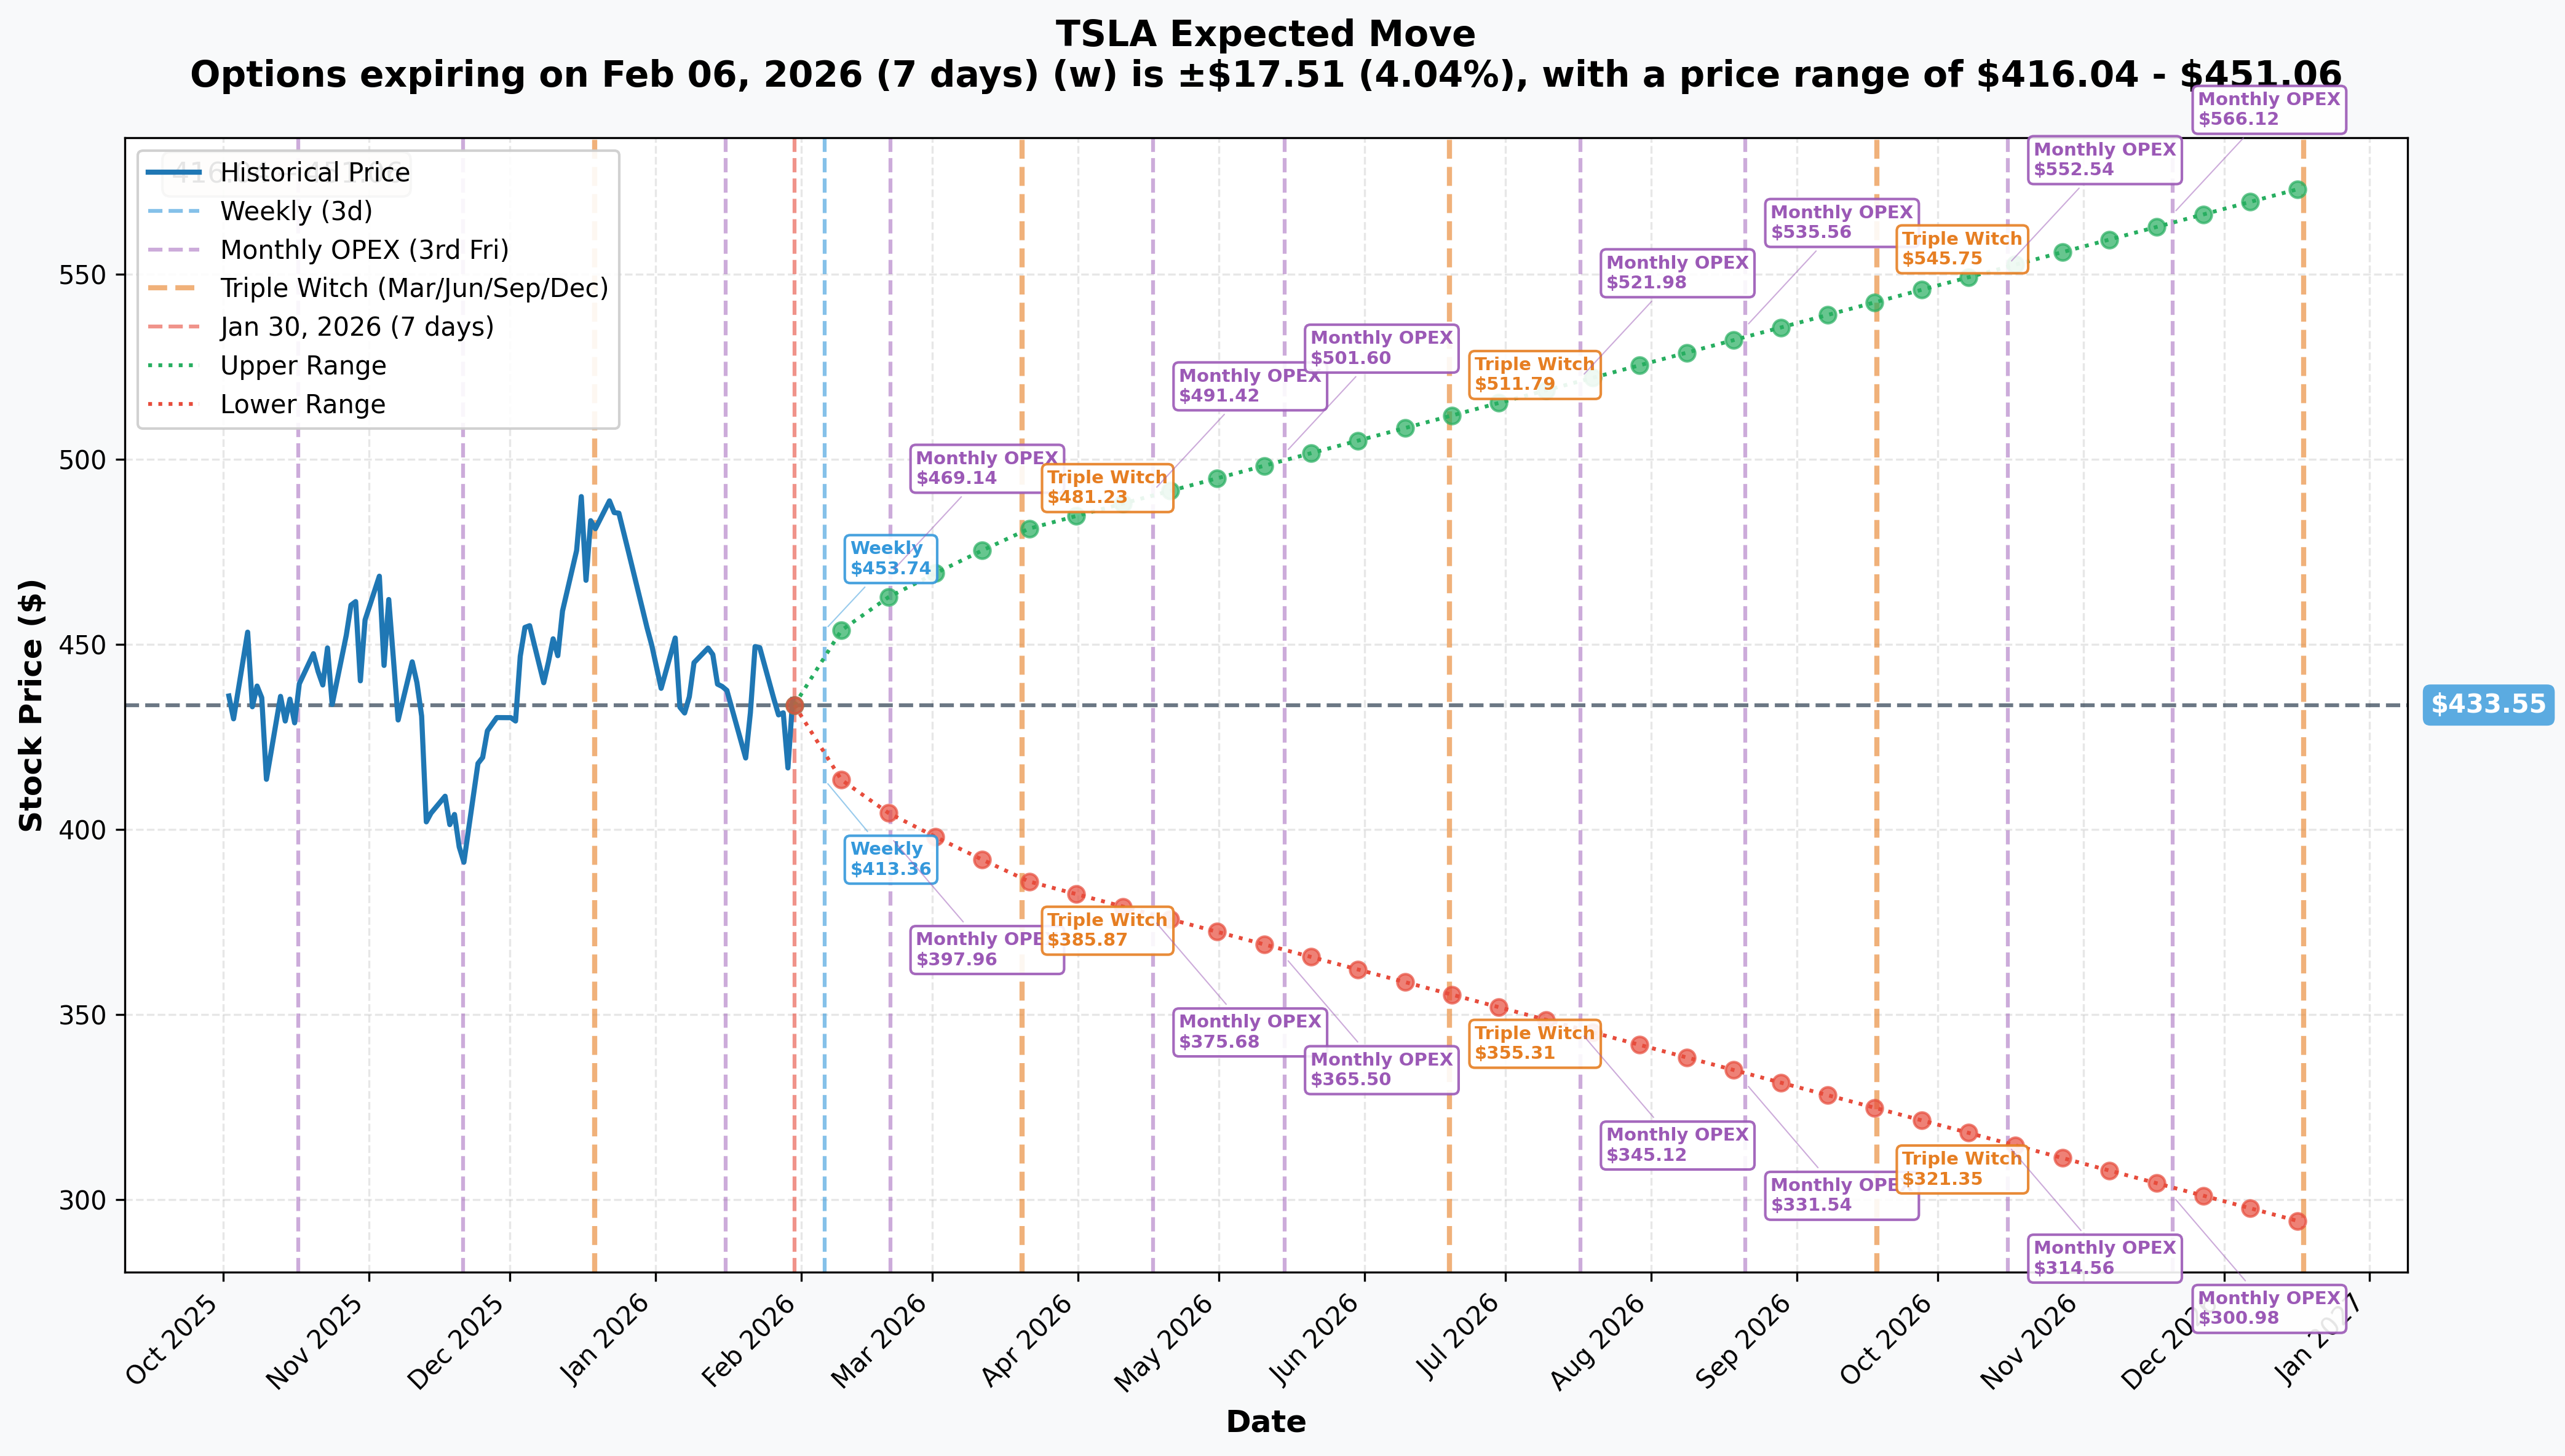
🔮 Implied Move Analysis
| Timeframe | Expiry | Implied Move | Range |
|---|---|---|---|
| Weekly | Feb 6 | +/-$17.51 (4.0%) | $416.04 - $451.06 |
| Monthly OPEX | Feb 20 | +/-$30.03 (6.9%) | $403.52 - $463.58 |
| Quarterly (Triple Witch) | Mar 20 | +/-$47.34 (10.9%) | $386.21 - $480.89 |
| Yearly LEAPS | Dec 18 | +/-$140.04 (32.3%) | $293.51 - $573.59 |
Key Takeaway
The put's $430 strike is well within the weekly implied move range (lower bound: $416.04). The breakeven at $411 sits slightly below the weekly lower bound but comfortably within the monthly OPEX range ($403.52 - $463.58). The options market is pricing in plenty of room for this trade to work.
The March 6 expiration falls between the monthly and quarterly OPEX cycles, giving the buyer exposure to the Feb 14 FSD subscription transition and nearly a month of post-event price action.
🔥 Upcoming Catalysts
Tesla has an unusually dense catalyst calendar over the next few months. Here's what could move the stock -- and this put trade -- in either direction:
Near-Term (Next 35 Days -- Within Trade Window)
-
FSD Subscription-Only Transition (February 14, 2026) -- Tesla is ending the $8,000 one-time FSD purchase option, moving all new activations to the $99/month subscription model. This could create short-term revenue recognition uncertainty but builds a stronger recurring revenue base.
-
SpaceX-Tesla Merger Speculation -- Bloomberg reported on January 29 that SpaceX is considering a merger with Tesla or xAI. Polymarket puts odds of a Tesla-SpaceX merger by June at 18%. This is a wildcard that could swing the stock violently in either direction.
-
Post-Earnings Digestion -- Tesla reported Q4 2025 results on January 28, beating on EPS ($0.50 vs $0.45 consensus) but showing a 61% YoY plunge in net income and an 11% decline in auto revenue. The market is still digesting these numbers.
-
Optimus Gen 3 Unveiling (Q1 2026) -- The first production-intent prototype of Tesla's humanoid robot could drop any day this quarter. Musk is converting the Fremont Model S/X line to produce 1 million Optimus robots per year.
Medium-Term (2-6 Months)
-
Cybercab Production Start (April 2026) -- Musk confirmed Cybercab manufacturing begins at Giga Texas in April, using the new "unboxed" manufacturing process. Target price: under $30,000. Still needs NHTSA regulatory approval for public road use.
-
Robotaxi Expansion to 7 New Cities -- Dallas, Houston, Phoenix, Miami, Orlando, Tampa, and Las Vegas are all confirmed for H1 2026. Austin is going fully unsupervised.
-
Q1 2026 Earnings (Late April) -- First quarter reflecting FSD subscription transition, final Model S/X production, and early Cybercab signals.
-
SpaceX IPO (Potential June 2026) -- SpaceX is reportedly targeting a June 2026 IPO at ~$1.5 trillion valuation. Whether Tesla is included in that structure could be stock-defining.
Bearish Catalysts to Watch
- Two straight years of delivery declines -- Full-year 2025 deliveries fell 8.6% to 1.64M vehicles. BYD is now the world's largest EV seller.
- Cybertruck sales collapse -- Down 48% in 2025, with Q4 sales plunging 68% YoY.
- $20B+ capex year -- Tesla is more than doubling spending to over $20 billion in 2026. That's a lot of cash burn.
- European brand damage from Musk's political activities continues to weigh on sales.
- Morgan Stanley downgrade -- Cut from Overweight to Equal Weight, citing near-term challenges.
- Analyst consensus: ~$397-400 average price target -- That implies roughly 9% downside from current levels, which would put the stock right at the $400 gamma support.
🤔 Our Take
The Bull vs. Bear Setup
This $13M put trade is fascinating because it comes at a moment of maximum uncertainty for Tesla. The bull story (autonomy, robotics, energy, SpaceX merger) has never been more compelling. But the bear story (declining auto sales, 406x P/E, $20B capex burn, execution risk) has never been more grounded either.
What the Smart Money Might Be Seeing
The timing is notable -- this trade was placed two days after Q4 earnings and one day after the SpaceX merger rumors. If this is a hedge, the buyer might be protecting a long position against the possibility that the merger news fizzles or the market re-focuses on the actual fundamentals: declining deliveries, compressed margins, and a stock trading at 400x earnings.
If it's a directional bet, the buyer might be fading the post-earnings pop and SpaceX hype, expecting a mean-reversion back toward the analyst consensus range of $397-$434.
Key Levels to Watch
- $435: Strongest gamma support. If this breaks, the put trade starts working.
- $430: The strike price. Also a gamma support level (73). A break below here means the trade is in-the-money.
- $411: Breakeven at expiration. Within the monthly implied move range, so achievable but requires a solid move lower.
- $440: Nearest resistance. If TSLA pushes above here, this put loses value quickly.
Risk Assessment
| Factor | Assessment |
|---|---|
| Trade Conviction | HIGH -- $13M premium, 15x volume/OI ratio, executed on the ask |
| Institutional Probability | VERY HIGH -- Size and execution style consistent with hedge fund/institutional desk |
| Directional Signal | BEARISH (but could be a hedge on a larger long position) |
| Catalyst Alignment | STRONG -- FSD transition, merger uncertainty, post-earnings digestion all in window |
| GEX Support | Buyer needs to break through $435 gamma wall; dealer hedging works against this trade near-term |
📝 Summary
A heavyweight institutional player just put $13 million on the table betting TSLA trades below $430 by March 6. With a volume-to-open-interest ratio of 15x, this is one of the most unusual put trades we've seen in TSLA this year. The trade sits in a sweet spot of catalyst density -- the FSD subscription transition, SpaceX merger uncertainty, and post-earnings digestion all fall within the 35-day window.
That said, dealer gamma at $435 provides a near-term floor, and the net GEX bias is bullish. The buyer needs a genuine negative catalyst or a broader market pullback to break through the gamma wall. This is either extremely well-informed downside conviction or a very expensive insurance policy from someone sitting on a mountain of TSLA gains.
Either way, watch the $435 level. If it breaks on volume, the path to $430 and below opens up fast.
This report is for informational purposes only and does not constitute investment advice. Options trading involves substantial risk of loss. Past performance is not indicative of future results.