TSLA: $4.5M Short Call Cover Signals Institutional Risk Reduction
February 3, 2026 | Institutional Options Activity Alert
The Quick Take
Someone just deployed $4.5 MILLION closing out short call positions in Tesla before the February 14 FSD deadline. These aren't new bullish bets - they're traders reducing directional exposure before potential volatility around key catalysts. With TSLA pinned right below the massive $420 gamma wall and the FSD subscription deadline 11 days away, this activity signals "I prefer to be flat or light into this event risk."
Company Overview
| Metric | Value |
|---|---|
| Company | Tesla, Inc. (TSLA) |
| Market Cap | $1.58 Trillion |
| Exchange | NASDAQ |
| Industry | Motor Vehicles & Passenger Car Bodies |
| Current Price | $418.94 |
| 52-Week Range | $214.25 - $498.83 |
| Employees | 134,785 |
What They Do: Tesla is a vertically integrated battery electric vehicle automaker and developer of real-world artificial intelligence software. Beyond cars, they manufacture batteries for energy storage, solar panels, operate the Supercharger network, and are pivoting hard into autonomous driving (FSD) and humanoid robots (Optimus). This isn't just a car company anymore - it's positioning itself as the dominant AI and robotics player.
Option Flow Breakdown
What Just Happened
| Time | Symbol | Side | Buy/Sell | C/P | Strike | Volume | OI | Expiration | Size | Premium | Spot | Price |
|---|---|---|---|---|---|---|---|---|---|---|---|---|
| 10:23:07 | TSLA | ASK | BUY | CALL | $450 | 15K | 16K | 2026-02-13 | 7,000 | $2.2M | $421.01 | $3.15 |
| 10:20:27 | TSLA | MID | BUY | CALL | $440 | 6.8K | 7.3K | 2026-02-13 | 4,400 | $2.3M | $421.56 | $5.30 |
Z-Scores:
- $440 Strike: 3.35 (EXTREMELY_UNUSUAL)
- $450 Strike: 3.91 (EXTREMELY_UNUSUAL)
Combined Activity:
- Total Premium: $4.5M
- Total Contracts: 11,400
- Days to Expiration: 10 days
- Strategy: ROLL / Short Cover (Buy to Close)
View $440C Chart | View $450C Chart
What This Actually Means
This is NOT a new bullish bet. This is closing out short call positions (Buy to Close).
Here's the breakdown:
Why Would Someone Be Short Calls?
- Covered call strategies against long stock (income generation)
- Directional bets on Tesla staying below $440-$450
- Market maker inventory management with accumulated short gamma exposure
Why Are They Covering NOW?
- FSD Deadline Risk: February 14 is the last day to buy FSD for $8,000. A surge in purchases could generate material revenue surprises and push TSLA higher
- Optimus V3 Catalyst: Musk described the upcoming robot reveal as "sublime" - could be unveiled any time this quarter
- European FSD Launch: Netherlands approval expected in February, opening significant new market
- Gamma Wall Pressure: With $420 as a major resistance level, a break could trigger dealer hedging flows
Translation: Think of it as de-risking before binary events. You made a directional bet ($4.5M short calls betting Tesla stays below $450 through Feb 13). Now with multiple catalysts approaching - FSD deadline, potential Optimus unveil, European expansion - you decide the risk/reward of holding through these events no longer favors the position. That's the calculation here.
Technical Setup
YTD Chart Analysis
Note: Chart image reference: ytd_chart.png
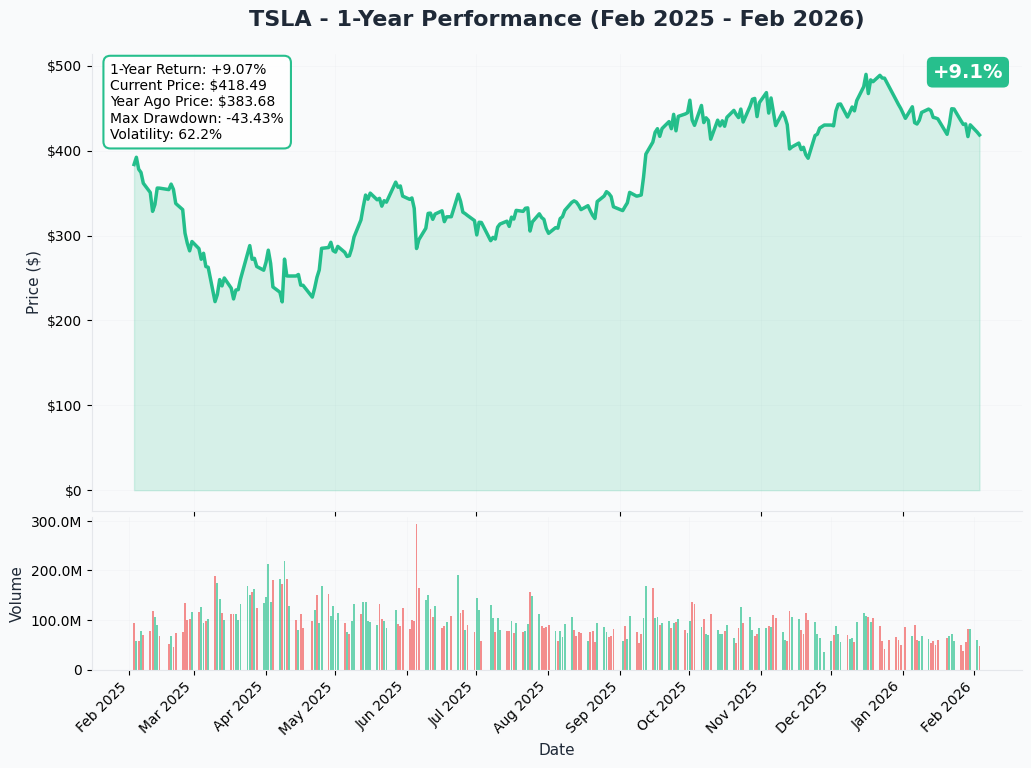
Key Observations:
- 1-Year Return: +9.1% (outperforming most automakers)
- Current Price: $418.49
- Max Drawdown: -43.43% (significant volatility)
- Realized Volatility: 62.2% (elevated)
- All-Time High: $498.83 (Dec 22, 2025) - approximately 16% below peak
The chart shows TSLA recovering from a brutal Q1 2025 selloff (DOGE backlash drove a 71% profit decline). The stock rallied hard into year-end 2025 on Optimus and FSD hype, peaked near $500, and has been consolidating in the $400-$430 range since January.
Gamma-Based Support & Resistance Analysis
Note: Chart image reference: gamma_sr.png
How to Read This: Orange bars (Call Gamma) above price = Resistance. Blue bars (Put Gamma) below price = Support. Bigger bars = Stronger levels.
Current Situation: TSLA at $418.70 is pinned RIGHT below the massive $420 gamma wall. This is the market maker battleground.
Resistance Levels (Where TSLA Faces Selling Pressure):
| Level | Gamma Exposure | Distance from Current |
|---|---|---|
| $420 | $37.7B (PRIMARY) | 0.25% |
| $422.50 | $9.8B | 0.85% |
| $425 | $20.3B | 1.4% |
| $430 | $34.5B | 2.6% |
| $440 | Heavy call OI | 5.0% |
| $450 | Heavy call OI | 7.4% |
Support Levels (Where TSLA Finds Bids):
| Level | Gamma Exposure | Distance from Current |
|---|---|---|
| $417.50 | $9.9B | 0.3% |
| $415 | $12.8B | 0.9% |
| $410 | $17.5B | 2.1% |
| $400 | $32.3B (PRIMARY) | 4.5% |
Interpretation: TSLA is constrained between two major gamma levels - $420 above and $400 below. Market makers actively manage hedges at these price points. A decisive break above $420 on substantial volume would likely trigger dealer hedging flows, potentially accelerating moves toward $430-$440.
Implied Move Analysis
Note: Chart image reference: implied_move.png
Weekly Expected Move (Feb 6, 2026):
- Upper Range: $430.07 (+2.7%)
- Lower Range: $403.51 (-3.7%)
- Implied Move: +/- $13.28 (3.19%)
Key Expiration Targets:
| Expiration | Expected High | Expected Low |
|---|---|---|
| Feb 13 (Our Options!) | ~$439 | ~$397 |
| March Monthly OPEX | $449.10 | $384.48 |
| June Triple Witch | $462.65 | $370.93 |
Critical Insight: The $440 and $450 strikes targeted for short covering sit at the edge of the implied move for Feb 13 expiration. Market pricing assigns approximately 15-20% probability to hitting $440. The trader covering shorts appears to view this risk/reward unfavorably given the upcoming catalyst calendar.
Catalysts
Upcoming (Next 30 Days)
| Date | Event | Impact |
|---|---|---|
| Feb 14, 2026 | FSD Purchase Deadline - Last day to buy FSD for $8,000 (subscription-only after) | HIGH |
| Feb 2026 | European FSD Launch - Netherlands approval expected via "National Exemption" | HIGH |
| Q1 2026 | Optimus V3 Reveal - Musk indicated significant updates coming | HIGH |
| Late April | Q1 2026 Earnings | MEDIUM |
Recent Events (Already Occurred)
| Date | Event | Result |
|---|---|---|
| Jan 28, 2026 | Q4 2025 Earnings | Beat on revenue ($24.9B), EPS beat ($0.50 vs $0.45), but net income -61% YoY |
| Jan 28, 2026 | Model S/X Discontinuation | Fremont converting to Optimus production (1M robots/year target) |
| Jan 14, 2026 | FSD Subscription Transition Announced | One-time $8K purchase ending Feb 14 |
| Jan 2, 2026 | BYD Overtakes Tesla as #1 EV Seller | Tesla deliveries -9% YoY (1.64M) vs BYD +28% (2.26M) |
Price Targets & Probabilities
Based on gamma levels, implied moves, and the catalyst calendar:
Bear Case: $395-$400 (20% Probability)
What Gets Us Here:
- FSD deadline passes with weak uptake - narrative shifts to "subscription fatigue"
- China sales continue declining; BYD extends lead
- Optimus V3 delays or underwhelms
- Broader market selloff (tariff escalation, Fed hawkishness)
Key Level: $400 put gamma wall provides massive support. Breaking this would be ugly.
Base Case: $415-$425 (55% Probability)
What Gets Us Here:
- Stock remains pinned between $400 support and $420 resistance
- FSD deadline generates moderate revenue bump but no major surprise
- Optimus V3 unveiled but timeline uncertainty persists
- Market awaits Q1 earnings for clarity
Key Level: The $420 gamma wall continues to act as a ceiling until a clear catalyst breaks it.
Bull Case: $440-$460 (25% Probability)
What Gets Us Here:
- FSD deadline drives massive last-minute purchases, creating $1B+ revenue surprise
- Optimus V3 reveal exceeds expectations with clear commercial timeline
- European FSD approval creates expansion narrative
- Short covering cascade above $420 triggers dealer buying
Key Level: Breaking $420 with volume would trigger a gamma squeeze toward $430, then $440. The Feb 13 call covering suggests someone believes this scenario is more likely than the market implies.
Trading Ideas
Conservative: "The Patient Observer"
Strategy: Cash-secured put at support
- Trade: Sell TSLA 2026-02-21 $400 Put
- Premium: ~$3.50 ($350/contract)
- Max Risk: Assigned at $400 (you own TSLA at $396.50 effective cost)
- Max Profit: $350 per contract if TSLA stays above $400
- Why This Works: The $400 level has $32.3B in put gamma support. You're essentially betting the gamma wall holds. If assigned, you own Tesla at a 5.3% discount to current price.
- Probability of Profit: ~75%
Balanced: "The Catalyst Strangle"
Strategy: Long strangle to capture FSD deadline volatility
- Trade: Buy TSLA 2026-02-14 $410 Put + $430 Call
- Cost: ~$8.50 ($850/contract pair)
- Break-even: Below $401.50 or above $438.50 by Feb 14
- Max Risk: $850 per strangle (total premium paid)
- Max Profit: Unlimited above $438.50, substantial below $401.50
- Why This Works: You're betting the FSD deadline creates a bigger move than the market expects. Whether bullish catalyst (massive FSD uptake) or bearish (disappointment), you profit from volatility.
- Probability of Profit: ~40% (but asymmetric payoff)
Aggressive: "Following the Whale"
Strategy: Call spread following the short-covering signal
- Trade: Buy TSLA 2026-02-13 $420 Call, Sell TSLA 2026-02-13 $450 Call
- Cost: ~$5.50 ($550/contract)
- Max Risk: $550 per spread
- Max Profit: $2,450 per spread (345% return)
- Break-even: $425.50
- Why This Works: Someone just paid $4.5M to cover shorts at $440-$450. They know something. This spread lets you participate in a breakout above $420 with defined risk. If the gamma squeeze materializes, you capture most of the move.
- Probability of Profit: ~30% (high risk/high reward)
Risk Factors
Execution Risks
- Optimus Timeline Slippage: Roboticist Rodney Brooks calls humanoid robot vision "pure fantasy thinking" - Musk timelines have a history of delays
- FSD Regulatory Limbo: Unsupervised FSD still only approved in Austin pilot program
- CapEx Pressure: $20B planned spending in 2026 could strain free cash flow
Competitive Headwinds
- BYD Dominance: Now #1 global EV seller; Tesla's China market share eroding
- Stale Product Line: Model S/X discontinued, Model 3/Y aging, Cybercab delayed
- FSD Competition: Chinese smart EV brands advancing rapidly while Tesla's China FSD rollout stalls
Macro & Political Risks
- Tariff Escalation: Trump tariffs (up to 245% on China) threaten Cybercab economics
- DOGE Backlash Overhang: "Tesla Takedown" boycott movement damaged brand perception
- Consumer Spending Pressure: Average household tariff impact of $1,300 in 2026 could hurt vehicle demand
Valuation Concerns
- HSBC's Bear Case: Suggests 74.7% downside risk
- Multiple Compression Risk: If AI/robotics narrative fades, stock reverts to auto industry multiples
Bottom Line
This $4.5M short-covering trade reflects institutional de-risking ahead of binary events.
Here's the practical perspective:
If you own TSLA: The gamma setup suggests range-bound consolidation ($400-$420) until a catalyst forces a breakout. The February 14 FSD deadline is the next key inflection point. Consider upside call sales above $440 to generate premium while awaiting clarity.
If you're monitoring: Short covering at elevated Z-scores signals expected volatility. The $420 gamma wall is the critical threshold to watch. A break above $420 on meaningful volume would likely trigger follow-through toward $430-$440. Wait for confirmation before committing capital.
If you're bearish: The $400 put gamma support is substantial. Absent material negative surprises (weak FSD uptake, Optimus delays, tariff shocks), downside appears contained to roughly 4-5%.
Mark your calendar: February 14 (FSD deadline), followed by potential Q1 announcements regarding Optimus. These represent the key catalysts for the Feb 13 expiration.
Key takeaway: When $4.5M in Buy-to-Close activity on short-dated calls (Z-scores 3.35-3.91) precedes major catalysts, institutional traders are clearly managing risk. The message is consistent: event volatility is anticipated.
Option Flow Summary Table
| Strike | Expiration | Type | Volume | Premium | Z-Score | Interpretation |
|---|---|---|---|---|---|---|
| $440 | 2026-02-13 | Call | 6,800 | $2.3M | 3.35 | Short cover before FSD deadline |
| $450 | 2026-02-13 | Call | 15,000 | $2.2M | 3.91 | Short cover before FSD deadline |
Disclaimer: This analysis is for informational purposes only and does not constitute investment advice. Options trading involves substantial risk of loss and is not appropriate for all investors. Past performance does not guarantee future results. Always conduct your own research and consider your financial situation before making investment decisions.
Data Sources: Tesla Investor Relations, Yahoo Finance, CNBC, Polygon.io
Charts: Ainvest