🚨 TSLA $46M Complex Put Restructure - Smart Money Rolling Deep ITM Puts Into Extended Protection! 🛡️
📅 March 16, 2026 | 🔥 Unusual Activity Detected
🎯 The Quick Take
Someone just executed a 8-leg, $46.3M complex put restructuring on Tesla at the close today — selling near-term deep ITM puts while loading up on new strikes and extending protection into April and May. This is NOT a simple bearish bet — this is sophisticated portfolio repositioning with TSLA trading at $396.61, roughly 20% off its December highs, just 5 days before the Terafab chip factory launch event on March 21. Translation: big money is staying hedged through a dense catalyst window while optimizing where they hold their protection.
📊 Company Overview
Tesla, Inc. (TSLA) is one of the most polarizing mega-cap stocks in the world — part automaker, part energy company, part AI/robotics bet:
- Market Cap: $1.47 Trillion
- Industry: Motor Vehicles & Passenger Car Bodies (EVs, Energy Storage, AI/Robotics)
- Current Price: $396.61 (March 16, 2026)
- Primary Business: Electric vehicles (Model 3/Y/S/X/Cybertruck), energy storage (Megapack/Powerwall), autonomous driving (FSD/Robotaxi), humanoid robots (Optimus), and now in-house AI chip fabrication (Terafab)
- 52-Week Range: ~$225 – $489.88
At $1.47T market cap, Tesla prices in a future where autonomous driving, Optimus robots, and energy storage are all massive winners. The core auto business is struggling — second consecutive annual delivery decline at 1.64M units (-8.6% YoY) — but the story has never been just about cars.
💰 The Option Flow Breakdown
📊 What Just Happened — The Full Tape (March 16, 2026 @ 15:31:50)
| Time | Symbol | Side | Buy/Sell | C/P | Expiration | Premium | Strike | Volume | OI | Size | Spot | Option Price | Option Symbol |
|---|---|---|---|---|---|---|---|---|---|---|---|---|---|
| 15:31:50 | TSLA | MID | SELL | PUT | 2026-03-20 | $10.7M | $500 | 1,035 | 10,320 | 1,035 | $396.61 | $103.34 | TSLA20260320P500 |
| 15:31:50 | TSLA | MID | SELL | PUT | 2026-03-20 | $17M | $460 | 2,681 | 7,230 | 2,681 | $396.61 | $63.42 | TSLA20260320P460 |
| 15:31:50 | TSLA | MID | BUY | PUT | 2026-03-20 | $6.3M | $490 | 675 | 4,600 | 675 | $396.61 | $93.42 | TSLA20260320P490 |
| 15:31:50 | TSLA | MID | BUY | PUT | 2026-05-27 | $1M | $470 | 100 | 1,000 | 100 | $396.61 | $100.42 | TSLA20260527P470 |
| 15:31:50 | TSLA | MID | BUY | PUT | 2026-03-20 | $4.7M | $480 | 562 | 4,200 | 562 | $396.61 | $83.64 | TSLA20260320P480 |
| 15:31:50 | TSLA | MID | SELL | PUT | 2026-03-20 | $0.4M | $450 | 75 | 720 | 75 | $396.61 | $53.44 | TSLA20260320P450 |
| 15:31:50 | TSLA | MID | BUY | PUT | 2026-03-27 | $2.8M | $510 | 218 | 1,000 | 218 | $396.61 | $128.44 | TSLA20260327P510 |
| 15:31:50 | TSLA | MID | BUY | PUT | 2026-04-17 | $3.4M | $515 | 287 | 1,000 | 287 | $396.61 | $118.45 | TSLA20260417P515 |
Total Premium Involved: ~$46.3M across 8 legs
🤓 What This Actually Means
Real talk: this is one of the most structured, deliberate hedge repositionings you'll see. Eight legs hit simultaneously at 15:31:50 — the final minute before close on a Friday. Let's break it down:
The SELLS (closing/reducing existing protection):
- 💸 TSLA20260320P500 sold at $103.34 — Collecting $10.7M, closing 1,035 contracts of the $500 put expiring this Friday (part of a 10,320-contract OI position). With TSLA at $396.61, this is $103.39 deep ITM and nearly all intrinsic value. This position expires in 4 days — they're selling before it collapses to intrinsic.
- 💸 TSLA20260320P460 sold at $63.42 — Collecting $17M on 2,681 contracts. Same Friday expiration. The 7,230 OI shows a large existing position; they're closing a significant chunk.
- 💸 TSLA20260320P450 sold at $53.44 — Collecting $0.4M on 75 contracts. Small cleanup on this leg.
The BUYS (opening new or rolling protection forward):
- 🛡️ TSLA20260320P490 bought at $93.42 — $6.3M on 675 contracts for the same Friday expiration. Buying this week protection at a cheaper strike.
- 🛡️ TSLA20260320P480 bought at $83.64 — $4.7M on 562 contracts. Building up near-term downside exposure at lower cost.
- 📅 TSLA20260327P510 bought at $128.44 — $2.8M on 218 contracts expiring March 27. Deep ITM, extending protection into next week's Terafab event.
- 📅 TSLA20260417P515 bought at $118.45 — $3.4M on 287 contracts expiring April 17. Extends coverage through the Q1 2026 Earnings call (~April 21).
- 📅 TSLA20260527P470 bought at $100.42 — $1M on 100 contracts expiring May 27. Longest-dated leg, extending a tail hedge into late spring.
What's really happening here:
This is a portfolio restructuring roll — not a fresh directional bet. The trader collected roughly $28.1M on the sell legs ($10.7M + $17M + $0.4M) and spent $18.2M on the buy legs ($6.3M + $4.7M + $2.8M + $3.4M + $1M), resulting in a net credit on the overall restructuring. They're reducing protection at the $500, $460, and $450 strikes (where they've been holding big ITM put positions) and redeploying into $490 and $480 strikes for this week's expiration while simultaneously purchasing new protection at the $510 and $515 strikes with later expirations.
The most telling legs are the March 27 $510 puts and April 17 $515 puts: both expire around critical binary events — the Terafab launch March 21 and Q1 2026 earnings ~April 21. This player is maintaining active downside coverage through both of those events.
Think of it like a homeowner adjusting their insurance policy at renewal — they're not necessarily more or less worried about their house burning down, but they're optimizing cost, coverage, and timing. The fact they're doing this at Friday close, with 8 legs simultaneously at the MID price, signals institutional sophistication and access.
Unusual Score: 🔥 HIGH — The 8-leg simultaneous execution at mid prices across multiple strikes and expirations, totaling $46.3M, is the kind of transaction that happens a few times per year on a single name. The $500 put had an existing OI of 10,320 contracts before today's trade, confirming a large pre-existing institutional position being restructured. This is not retail flow.
📈 Technical Setup / Chart Check-Up
YTD Performance Chart
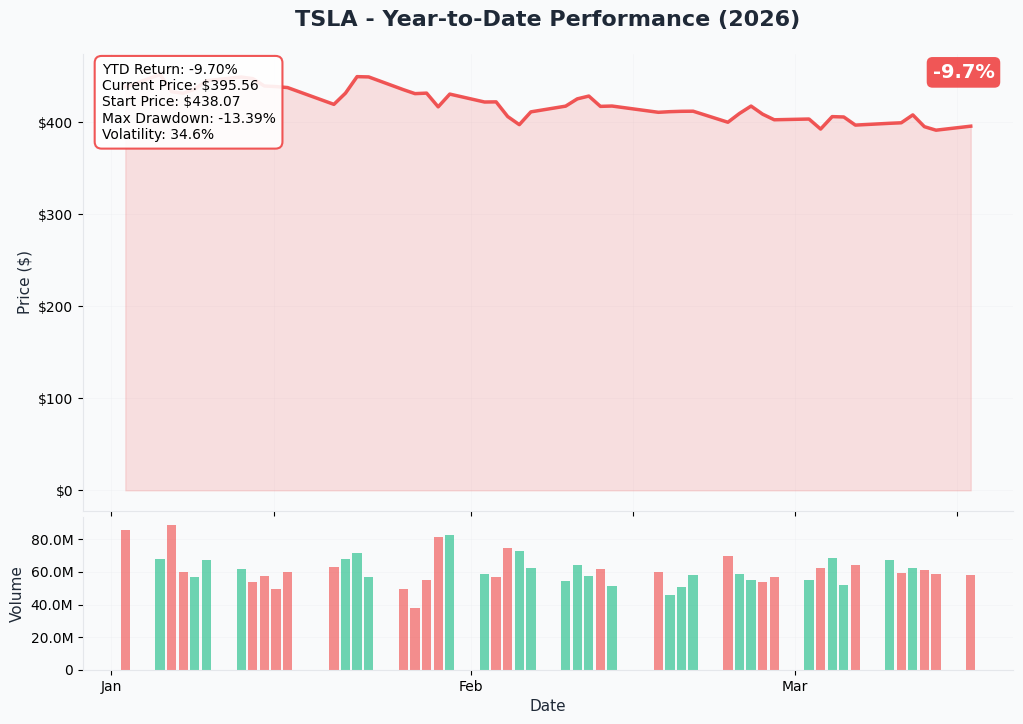
TSLA entered 2026 near its December 2025 all-time high of $489.88 and has since pulled back about 20% to the $396 area. That's a meaningful correction for a $1.47T mega-cap — the stock lost roughly $300B in market cap from peak. The correction has been broad-based: European sales remain in structural decline (13 consecutive months of YoY drops), Q4 2025 deliveries showed a second consecutive annual decline, and macro tech selling pressure has weighed on the entire sector.
Key observations from the YTD chart:
- 📉 Sharp drawdown from peak: From $489.88 to ~$396 is -19% from highs — a healthy correction but not a crash
- 📊 Volume on down days: Elevated selling volume throughout February-March, suggesting institutional de-risking (which this tape confirms)
- 🎢 Volatile swings: A Bank of America upgrade to Buy with $460 target on March 4 caused a bounce, but it faded — the rally couldn't hold
- 🎯 Holding above $370-380 support: Despite the selling, TSLA hasn't broken its longer-term structural support — yet
🔵🟠 Gamma-Based Support & Resistance Analysis
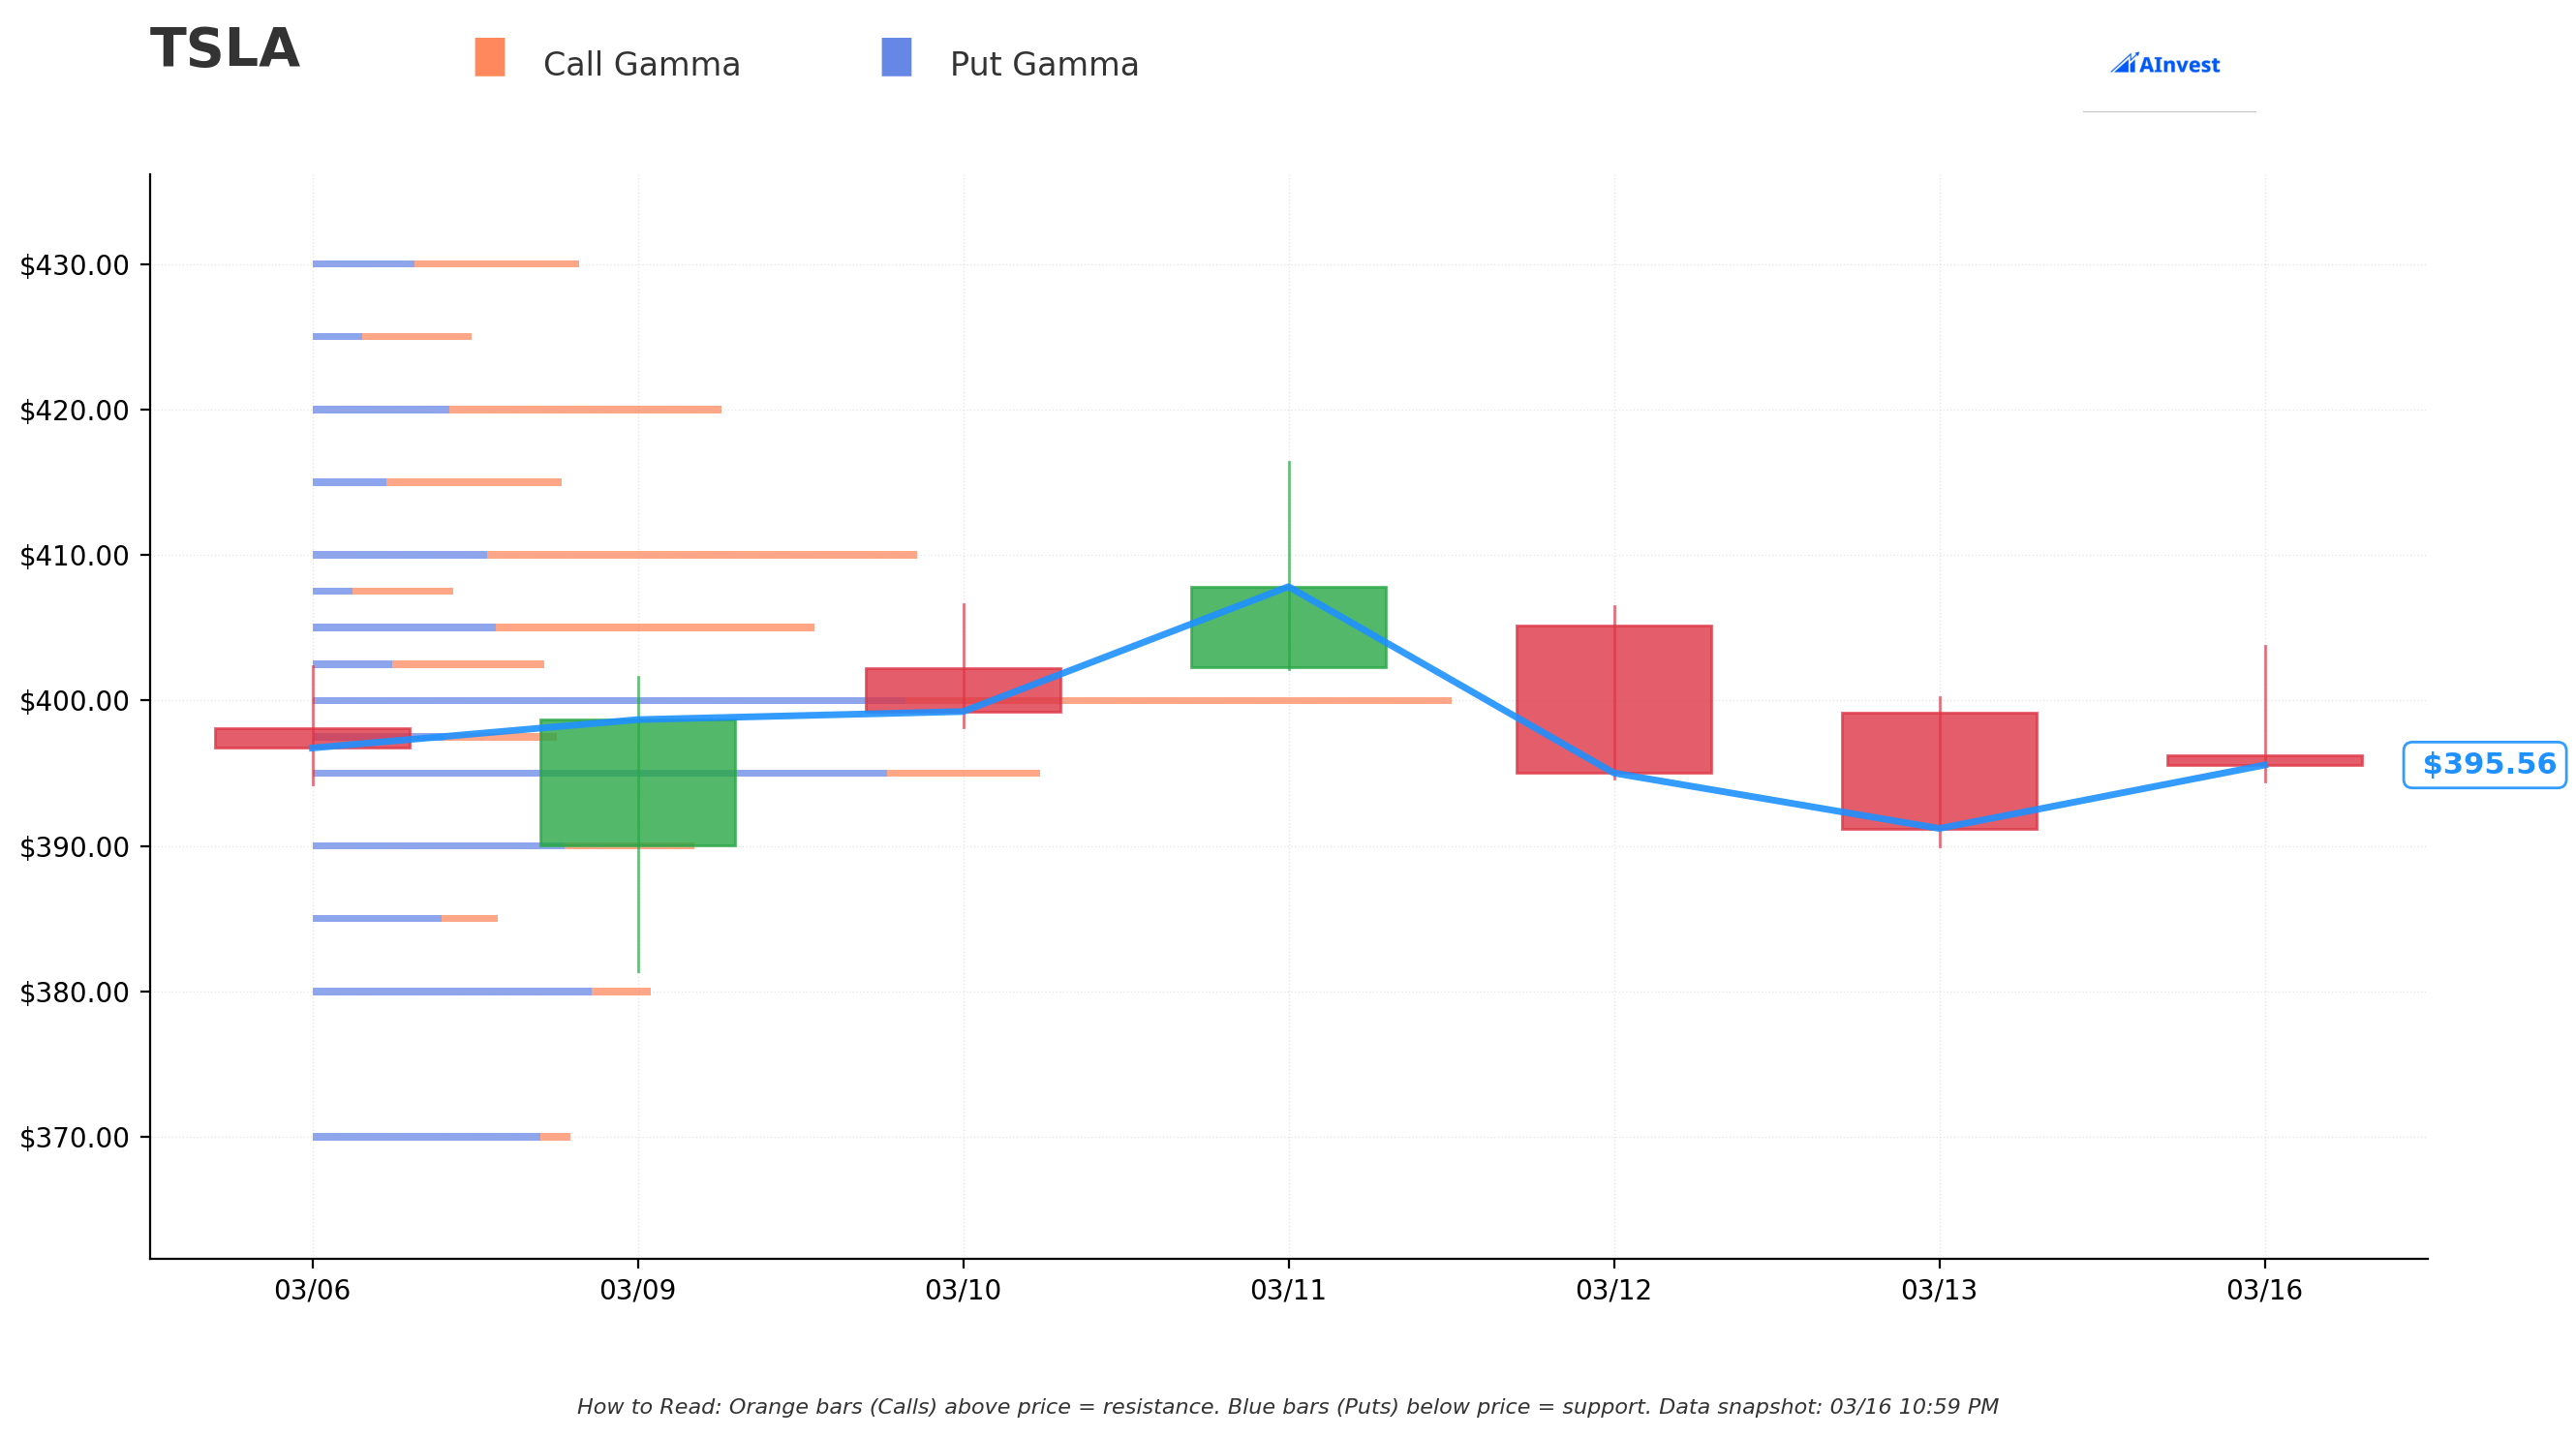
Current Price: $395.46
The gamma exposure map shows a tight battleground directly around current prices, with critical levels stacking on both sides:
🔵 Support Levels (Put Gamma Below Price):
- $395 — Immediate support with 42.8B total gamma (closest floor, strongest put gamma wall below current price at 33.8B)
- $390 — Secondary floor at 22.5B total gamma (-1.4% from here) — dealers will defend this level aggressively
- $380 — Major structural support at 19.9B total gamma (-4% from current) — this is a significant floor given the put OI stacked here
- $370 — Extended support at 15.2B total gamma (-6.4% away) — the disaster floor if $380 breaks
🟠 Resistance Levels (Call Gamma Above Price):
- $400 — Immediate and most significant resistance at 67.0B total gamma (STRONGEST LEVEL on the board). Both call gamma (32.1B) and put gamma (34.9B) are massive here, making $400 a true two-sided magnet. This is the line TSLA needs to clear to regain momentum.
- $405 — Secondary resistance at 29.5B total gamma (+2.4%). Net positive call gamma (7.9B) means dealers lean sell above here.
- $410 — Strong resistance at 35.6B total gamma (+3.7%) — significant call gamma wall (15.0B net calls) that would slow any rally
- $420 — Extended ceiling at 24.1B total gamma (+6.2%) — if TSLA breaks $410, $420 is the next meaningful stop
- $430 — Lighter resistance at 15.7B total gamma (+8.7%)
- $450 — Upper resistance at 16.1B total gamma (+13.8%) — interestingly where Bank of America has their $460 target
What this means for traders:
TSLA is in the middle of a massive gamma tug-of-war. The $395 put gamma wall is providing a floor RIGHT NOW, but the $400 call gamma ceiling (67B — the largest single level in the entire gamma map) is preventing any meaningful recovery. The stock is essentially pinned in a $395–$405 corridor heading into Triple Witch Friday expiration this week.
The net GEX bias is Bullish (312.8B total call GEX vs 285.4B total put GEX), but that's largely the macro picture. Locally, TSLA is trapped below the massive $400 resistance that market makers are systematically defending. Breaking $400 with volume is THE catalyst for a technical recovery toward $410–$420.
📐 Implied Move Analysis
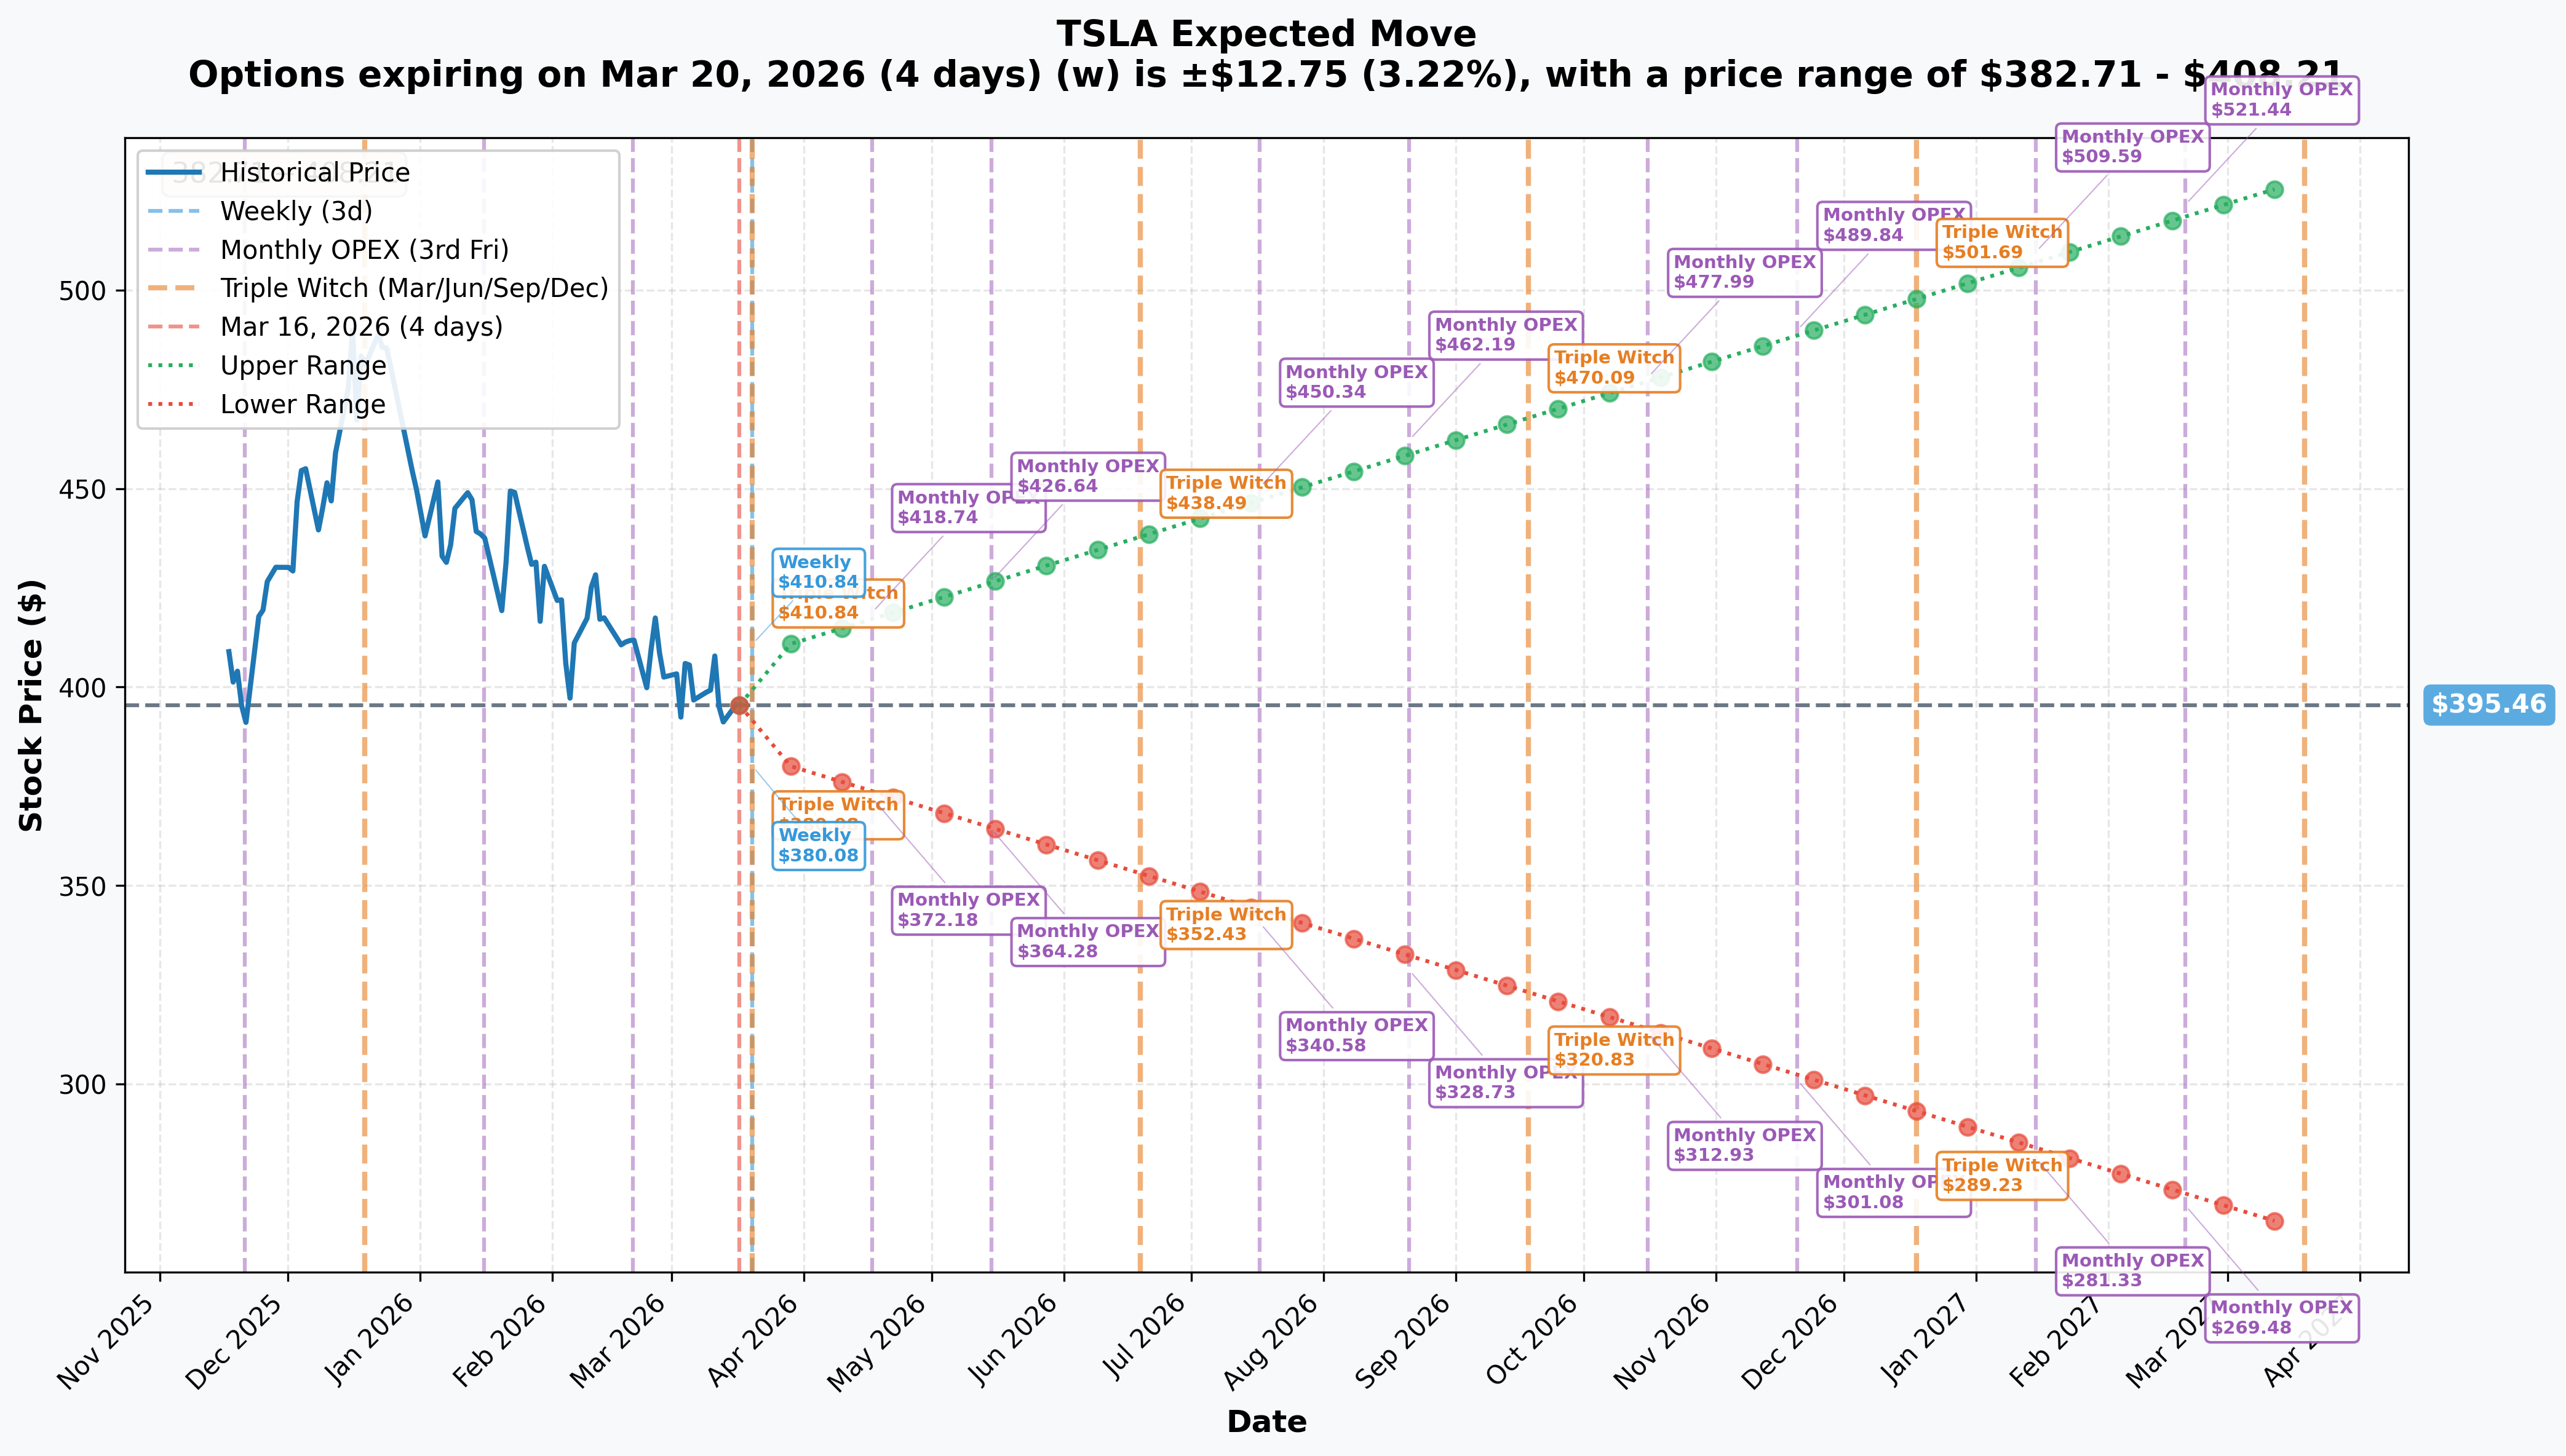
Options market pricing for upcoming expirations:
- 📅 Weekly / Monthly OPEX / Triple Witch (March 20 — 4 days): ±$12.75 (±3.22%) → Range: $382.71 – $408.21
- 📅 April Monthly OPEX (April 17): Range: $372.18 – $418.74
- 📅 May Monthly OPEX (May 15): Range: $364.28 – $426.64
- 📅 June Triple Witch (June 19): Range: $352.43 – $438.49
- 📅 LEAPS (March 2027 — 368 days): ±$132.56 (±33.52%) → Range: $262.90 – $528.02
Translation for regular folks:
This Friday is a Triple Witch expiration — that's when stock options, index options, AND futures all expire on the same day. It creates outsized volume and volatility. The options market is pricing in a $12.75 move by Friday (roughly 3.2% either direction), putting the implied range at $382.71 on the downside and $408.21 on the upside.
Notice that the $382.71 implied lower range aligns almost perfectly with the $380 gamma support level — and the $408.21 upper range is right above the $400/$405 gamma resistance cluster. The options market and gamma structure are telling the same story: expect TSLA to stay pinned in the $380–$410 zone through this Friday.
Looking further out, the April 17 OPEX range of $372–$419 surrounds both the Q1 2026 delivery report (~April 2) and Q1 2026 earnings (~April 21) — making the $515 April 17 put purchase in this trade a direct bet on maintaining protection through those binary events.
🎪 Catalysts
🔥 Upcoming Catalysts (March – May 2026)
Terafab Launch Event — March 21, 2026 (5 DAYS AWAY!) 🏭
Elon Musk confirmed on March 14 that Tesla's Terafab in-house AI chip fabrication facility launches March 21 — just next Saturday. Estimated project cost is $25 billion, targeting 100-200 billion custom AI and memory chips per year using 2nm process technology. This is Tesla's attempt to vertically integrate its AI infrastructure.
The catch? Tesla has zero semiconductor manufacturing experience — and skeptics are already loud. This event could be a massive catalyst in either direction: a detailed, credible announcement could spike TSLA toward $420–$430 gamma resistance; a vague announcement or immediate skepticism could flush it toward $380 support.
Q1 2026 Delivery Report — ~April 2, 2026 📊
Prediction markets are pricing 78% probability of fewer than 350,000 deliveries in Q1. That would be a third consecutive YoY delivery decline — a significant narrative headwind. The Model Y Juniper ramp will be the swing factor.
Q1 2026 Earnings Call — ~April 21, 2026 💰
First full quarterly earnings with Model Y Juniper in the mix. Key things to watch: automotive gross margin trajectory (17.9% in Q4, needs to show stability or expansion), energy storage growth (fastest-growing segment at 46.7 GWh/+48% YoY in 2025), and FSD/Cybercab unit economics. The April 17 $515 put position expires 4 days BEFORE earnings — the trader is protecting through delivery data but not holding through earnings itself.
Cybercab Mass Production Ramp — April-June 2026 🚗
First production Cybercab rolled off Giga Texas in mid-February, weeks ahead of schedule. Volume production targeted by end of 2026, eventually targeting 2 million annual Cybercab capacity. Each credible update here is a positive catalyst.
May 27 $470 Put — The Extended Tail Hedge
The longest-dated leg in this trade expires May 27. It's essentially a cheap tail hedge that keeps downside protection alive through a period that includes the robotaxi expansion to 7 new markets and the Cybercab ramp news flow. If TSLA recovers strongly, this $1M in premium is a small price to pay for peace of mind.
✅ Recent Catalysts (Already Happened)
Q4 2025 Earnings (January 28, 2026):
- Revenue: $24.90B (missed $25.11B consensus)
- Adjusted EPS: $0.50 (beat $0.45 by 11%)
- Automotive Gross Margin: 17.9%, up from 15.4% prior quarter — the most bullish number in the print
- Energy Storage: $12.77B FY2025 revenue (+27% YoY) with 28.7% gross margin
Austin Unsupervised Robotaxi Launch (January 2026):
- Tesla launched public robotaxi rides in Austin without a safety monitor — nearly 700,000 paid miles since June 2025
- Still visually monitored with chase cars, but it's a meaningful milestone
Bank of America Upgrade (March 4, 2026):
- Upgraded to Buy with $460 target, calling Tesla "the clear leader in autonomous driving"
- Bank of America estimates robotaxi expansion at 52% of their valuation model — confirms the high optionality value
FSD NHTSA Data Submission (March 9, 2026 deadline):
- Tesla had difficulty turning over FSD traffic violation data to NHTSA (after two extensions)
- Investigation covers 2.88M vehicles — outcome still pending
- A viral video of FSD driving through railroad crossing barriers on March 8 added public pressure
🎲 Price Targets & Probabilities
Using the gamma structure, implied move data, and upcoming catalyst calendar, here are three scenarios through the next 30 days:
📈 Bull Case — 25% Probability
Target: $418–$430
How we get there:
- 🚀 Terafab launch on March 21 exceeds expectations — credible timeline, strategic partnership announced, 2nm specs validated
- 📊 Q1 delivery report surprises to upside of 350K+ threshold (beats the 78% market probability of a miss)
- 📈 TSLA breaks above $400 gamma resistance with volume — triggers a technical chase toward $410, then $420 (next significant call gamma wall)
- 🛡️ Morgan Stanley's $425 equal-weight target starts looking like a floor; BofA's $460 target gets priced in
- 🌍 Early signs of European brand stabilization — February registrations showed +10% YoY bounce off the low base
- 📉 Implied upper range for April OPEX: $418.74 — the market itself is telling you this is plausible
Why only 25%: The $400 gamma ceiling is massive (67B total gamma). That's the market equivalent of a brick wall. Overcoming it requires sustained institutional buying against systematic market maker selling. The delivery report being below 350K is the more likely outcome per prediction markets.
🎯 Base Case — 50% Probability
Target: $382–$408 (Pinned Range)
Most likely scenario:
- 📊 Terafab announcement is credible but raises more questions than it answers — market digests it cautiously
- ⚖️ TSLA stays trapped in the $382–$408 implied move range through the March 20 Triple Witch expiration
- 🔄 Oscillates between the $395 put gamma floor and $400–$405 call gamma ceiling
- 📉 Q1 delivery report in early April comes in below 350K — a third consecutive annual decline keeps the narrative murky
- 🐋 This multi-leg restructuring trade we just saw is not the only institution doing this — broader put roll activity keeps a lid on upside
- 💤 After April earnings (held flat or modest beat), TSLA drifts in the $390–$420 range
- The March 20 $490/$480 put buys likely expire at full intrinsic value (both are deep ITM at current $396) — a profitable near-term outcome for the buyer
Why 50%: The gamma data literally prices in a $382–$408 range this week. TSLA has bounced off $380-$395 support multiple times. Without a decisive catalyst, the path of least resistance is sideways.
📉 Bear Case — 25% Probability
Target: $350–$380
What could go wrong:
- 😰 Terafab event is poorly received — skeptics questioning Tesla's zero semiconductor experience prove right, stock sells off -5-8% on the announcement
- 🚨 Q1 deliveries come in below 340K — third consecutive annual decline accelerates the bear narrative
- ⚠️ NHTSA issues a mandatory recall or operational restriction on FSD — covering 2.88M vehicles
- 🌍 European sales remain in structural decline with no recovery signal; Norway -93% over two years, Germany -76% YTD show the brand damage is real
- 💸 Broader tech selloff — macro recession concerns drag high-multiple stocks lower; TSLA at $1.47T market cap is vulnerable to multiple compression
- 🔨 TSLA breaks below $395 gamma floor → next significant support at $390, then $380
- 📊 Break of $380 (3.9B put gamma) triggers cascade toward $370, then the implied lower range of $372 for April OPEX
Critical support floors:
- 🛡️ $395: Immediate floor (42.8B total gamma) — must hold or momentum shifts
- 🛡️ $390: Secondary support (22.5B gamma) — bounce zone
- 🛡️ $380: Major structural floor (19.9B gamma) — LINE IN THE SAND
- 🛡️ $370: Extended support (15.2B gamma) — disaster scenario
- 📉 $382.71: Implied move lower bound for this Friday's expiration
The March 27 $510 put is the most valuable position in the bear case — deep ITM at $510 with stock at $396 means this put has $113+ in pure intrinsic value per share (218 contracts = $2.47M intrinsic value) and ANY move lower just adds to the protection.
💡 Trading Ideas
🛡️ Conservative: The "Sleep Through Triple Witch" Strategy
Play: Buy a March 27 $390/$370 Put Spread
Why this works:
- ⏰ Triple Witch this Friday (March 20) creates volatility — this spread gives you NEXT week's expiration so you survive the pinning action
- 🎯 The $390 strike aligns with a significant gamma support floor, and $370 is the deeper floor below — you're paying to protect between two real support levels
- 📊 After witnessing $46.3M in institutional put restructuring, staying flat or unprotected into Terafab event is flying blind
- 💰 Defined risk (max loss is the spread width minus premium paid) — you know exactly what you're risking
- 🛡️ Mirrors the "smart money" approach: hedge first, worry about being right later
- 🔥 Post-Triple Witch, the gamma pinning effect dissolves — moves tend to accelerate after large expirations
Estimated cost: ~$4–6 net debit per spread Max profit: ~$14–16 if TSLA falls to $370 by March 27 Max loss: The debit paid (fully defined) Breakeven: ~$384–386
Risk level: Low-Moderate (defined risk, bearish directional) | Skill level: Intermediate
⚖️ Balanced: The "Terafab Straddle" — Bet on the Move, Not the Direction
Play: Buy a March 27 $400 Straddle (buy the $400 call AND the $400 put, both March 27)
Why this works:
- 🎢 Terafab launch on March 21 is a genuinely binary event — credible execution could spike TSLA $20–25 higher; a poor announcement could flush it $20 lower
- 🎯 The $400 strike is the EXACT highest gamma resistance level on the board (67B total gamma) — options activity is MOST concentrated here, meaning any move away from $400 accelerates
- 📊 Implied move for this week is ±$12.75 but the March 27 expiration gives you more room — you're paying for TWO weekends of event risk
- 🤔 When you see 8 simultaneous legs of $46.3M in repositioning, you know sophisticated players are expecting volatility — why fight that?
- ⚡ Need only a 5–7% move in either direction to break even — reasonable given Terafab and possible delivery data flow
The Risk:
- 💸 Straddles are expensive — you're paying for both sides of volatility
- ⏰ If TSLA just pins at $395–$405 through March 27, both legs lose value
- 🎯 Time decay (theta) is your enemy — you need the move to happen FAST after Terafab on March 21
Estimated cost: ~$25–30 per straddle at current implied vol Upside breakeven: ~$425–430 (roughly the $420–$430 gamma resistance zone) Downside breakeven: ~$370–375 (aligns with the implied lower range and gamma floor!) Max profit: Unlimited on the upside; substantial on the downside down to $0
Risk level: Moderate-High (can lose full premium if TSLA pinned) | Skill level: Intermediate-Advanced
🚀 Aggressive: "Roll With the Whales" — Copy the March 27 Deep ITM Put Position
Play: Buy 1–5 contracts of the March 27 $510 Put (same strike and expiration as the institutional trade)
Why this works:
- 🐋 You are literally copying ONE specific leg of a $46.3M institutional trade — the $2.8M purchase of 218 contracts at $128.44
- 🎯 With TSLA at $396.61, this put is $113.39 deep ITM — the intrinsic value alone is $113.39. You're paying $128.44, so only $15.05 is time premium ("extrinsic value")
- 📊 Deep ITM puts behave more like short stock than like regular options — delta near -0.85 to -0.95, meaning every $1 TSLA drops is nearly $1 gain on the put
- 💥 The March 21 Terafab event is your binary: bad announcement = TSLA drops, this put PRINTS. Good announcement = you lose ~$15 in time value max.
- 🔥 Risk/reward is defined: max loss is the $15 time premium per share × 100 shares = $1,505 per contract. Max gain is huge if TSLA falls to $350 or below.
Why this is "Aggressive":
- ⚠️ Deep ITM options are capital intensive — $128.44 per share × 100 = $12,844 per contract. One contract ties up significant capital.
- 🎰 If Terafab exceeds expectations and TSLA gaps to $415–$420, your time premium ($1,505/contract) is fully lost — but intrinsic value is preserved minus the move
- 😰 You're essentially betting that TSLA doesn't have a major positive catalyst in the next 11 days — possible but not certain
- ⏰ This is a short-duration, high-capital trade — you need to be RIGHT this week/next week
Estimated P&L per contract:
- TSLA at $370 by March 27: Put worth ~$140, gain = ~$11.56/share = +$1,156 per contract (+9% on capital)
- TSLA at $350: Put worth ~$160, gain = ~$31.56/share = +$3,156 per contract (+24.6% ROI)
- TSLA at $420: Put worth ~$90 (pure intrinsic $90 + small remaining time value), loss = ~$38/share = -$3,800 per contract (-29.6% ROI)
- TSLA pins at $396 at expiration: Put worth ~$114 (pure intrinsic), loss = ~$14.44 in time premium = -$1,444 per contract (-11.2%)
Position sizing: Risk only 2–3% of portfolio per contract. One contract at $12,844 is a meaningful position — size accordingly.
Risk level: High (capital intensive, short-dated, event-driven) | Skill level: Advanced
⚠️ Risk Factors
Don't ignore these potential landmines:
-
🎢 Triple Witch pinning this Friday (March 20): With the BIGGEST gamma concentration at $400 (67B total gamma) and massive expirations clearing Friday, TSLA could be artificially "pinned" near $395–$400 through the end of the week. Don't mistake pinning for true price discovery — the real move may come next week after the gamma overhang clears.
-
🚨 Terafab risk is two-way: Tesla has zero semiconductor manufacturing experience and is attempting to build a $25B+ chip fab from scratch. The market has ALREADY priced in significant AI/chip optionality into the $1.47T market cap. If the March 21 announcement is vague, overpromised, or meets immediate skepticism, the stock could easily give back $15–20.
-
📉 Q1 2026 delivery print is a known landmine: Prediction markets price 78% probability of fewer than 350K deliveries — that would be a third consecutive annual decline. Tesla's stock at $1.47T market cap requires growth acceleration, not deceleration. A weak delivery print in early April could undo any Terafab bounce.
-
🌍 European brand damage has no quick fix: 13 consecutive months of YoY European sales declines. Norway down 93% over two years. Germany down 76% in February. Europe is Tesla's second-largest market historically — structural decline here is not a short-term noise story.
-
⚖️ NHTSA investigation outcome is unresolved: The data submission deadline was March 9 (after two extensions). The investigation covers 2.88 million Tesla vehicles with 80 documented violations. A mandatory recall or operational restriction on FSD would be a major negative catalyst at any time.
-
💸 FSD safety metrics actually worsening: Waymo achieves 30,000 miles between critical disengagements vs Tesla FSD at 809 miles — a 37x gap. And the FSD disengagement rate deteriorated from 4,109 miles (v14.1) to 809 miles (v14.2). If autonomous driving is 52% of Tesla's BofA valuation model, deteriorating FSD metrics are a structural risk.
-
🏭 "Unboxed" Cybercab manufacturing is unproven at scale: Production of Cybercab has started with low-volume validation builds, but scaling to 2 million units annually using a novel manufacturing paradigm is an enormous execution risk. Any production hiccup or delay announcement could hurt sentiment.
-
📊 Valuation leaves zero margin for error: At $1.47T market cap, Tesla prices in nearly perfect execution on Cybercab, Optimus, Terafab, and energy storage simultaneously. AAII rates Tesla "Ultra Expensive" with a Value Grade of F. One stumble on any of those fronts could compress the multiple meaningfully.
-
🐋 $46.3M institutional put restructuring is a SIGNAL, not a guarantee: The smart money here is managing risk, not necessarily predicting a crash. They could be partially wrong, early, or working with specific portfolio constraints we can't see. Never blindly follow institutional flow without your own conviction.
🎯 The Bottom Line
Here's the deal: What we witnessed at 15:31:50 today is a sophisticated institutional player doing their end-of-week portfolio housekeeping — collecting premium on deep ITM puts expiring this Friday while maintaining active protection through the three most important near-term events: the Terafab launch (March 21), the Q1 delivery report (~April 2), and Q1 earnings (~April 21).
The 8-leg simultaneous execution signals one thing clearly: this player wants protection through TSLA's catalyst window but is willing to optimize and reduce cost along the way. They're not running for the exits — they're tightening their seatbelt before the turbulence ahead.
What this trade tells us:
- 📊 Institutional players still see meaningful downside risk for TSLA through Q1 delivery and earnings
- 🎯 The $490/$480 puts for THIS Friday suggest they're comfortable holding protection at those lower strikes into the Triple Witch pinning
- ⏰ The March 27 and April 17 legs show conviction that the Terafab and delivery/earnings events are binary enough to warrant maintaining deep ITM protection
- 💰 They net collected premium on the restructure — this is COST-EFFICIENT hedging, not panic hedging
If you own TSLA:
- ✅ Consider trimming 20–30% if you're up — the stock is 20% off its highs but still at $1.47T market cap, which prices in a lot of future execution
- 🛡️ The $400 gamma ceiling is real. Don't expect a V-shaped recovery this week unless Terafab DRAMATICALLY exceeds expectations
- 📅 Mark March 21 (Terafab), ~April 2 (deliveries), and ~April 21 (earnings) on your calendar — those are your decision points
- ⚠️ If TSLA breaks below $380, the gamma structure suggests there's not a lot stopping the slide to $370
If you're watching from the sidelines:
- 👀 The Terafab event on March 21 is your first entry opportunity signal — a bad reaction = potential dip-buy setup at $375–$385; a strong reaction = potential momentum entry above $410
- 🎯 The base case is TSLA stuck between $382–$408 through Triple Witch this Friday — no edge chasing that range
- 📊 Better setups available after the delivery print in early April when binary risk is clarified
If you're bearish:
- 🎯 The options market agrees with you short-term — $400 call gamma at 67B is the brick wall
- 📉 First trigger to watch: break below $395 gamma floor, then $390, then $380 (that's the line)
- ⏰ March 27 $510 put is deep ITM and highly sensitive to price movement — but it's capital intensive at $128+ per share
Mark your calendar:
- 📅 March 20 (Friday) — Triple Witch expiration; massive gamma rolls off, pinning effect ends
- 📅 March 21 (Saturday) — Terafab chip factory launch event — THE near-term binary
- 📅 ~April 2 — Q1 2026 delivery report — 78% probability of <350K
- 📅 April 17 — Monthly OPEX; April 17 $515 puts from today's trade expire
- 📅 ~April 21 — Q1 2026 Earnings Call — first read on Model Y Juniper margins
- 📅 May 27 — May 27 $470 puts from today's trade expire
Final verdict: Tesla's story remains one of the most compelling — and the most divisive — in all of mega-cap tech. Bank of America calls it the clear autonomous driving leader; Wedbush has a $600 target. But the delivery declines, the European brand crisis, the worsening FSD safety metrics, and a $25B chip fab bet in a domain Tesla has never worked in mean the bear case is real too.
The institutional player who just spent $46.3M restructuring their put book isn't panicking — they're being disciplined. That's the lesson here: manage your risk, know your catalysts, and don't let conviction turn into stubbornness.
This is a marathon, not a sprint. Protect your capital. 💪
⚠️ Disclaimer: Options trading involves substantial risk of loss and is not suitable for all investors. This analysis is for educational and informational purposes only and does not constitute financial advice. Past performance does not guarantee future results. Deep in-the-money options involve significant capital requirements and complex risk profiles that may not be appropriate for all retail investors. The institutional trade described represents a sophisticated multi-leg strategy with specific portfolio context unavailable to outside observers. Always conduct your own research and consider consulting a licensed financial advisor before trading. The Terafab event and delivery reports are binary catalysts that could result in 10–20% moves in either direction.
About Tesla, Inc.: Tesla designs, develops, manufactures, leases, and sells electric vehicles, energy generation and storage systems, and related services. With a market cap of $1.47 trillion, Tesla operates at the intersection of electric vehicles, autonomous driving, energy storage, humanoid robotics, and artificial intelligence — making it one of the most multi-faceted and catalyst-rich stocks in the market today.