💎 TSM Massive $39M Call Sale - Smart Money Taking Chips Off Table! 🛡️
📅 December 12, 2025 | 🔥 Unusual Activity Detected
🎯 The Quick Take
Someone just DUMPED $39 MILLION worth of TSM call options this morning at 10:31! This monster trade sold 7,500 contracts of February 20 $250 strike calls - locking in profits on a massive position while TSM trades at $295. With TSM up dramatically on AI chip demand and 2nm ramp expectations, an institution just decided NOW is the time to take money off the table. Translation: Smart money is cashing out before potential turbulence ahead!
📊 Company Overview
Taiwan Semiconductor Manufacturing Company (TSM) is the backbone of the global semiconductor industry:
- Market Cap: $1.58 Trillion (8th most valuable company globally)
- Industry: Semiconductor Manufacturing - Pure-Play Foundry
- Current Price: $295.39 (trading near all-time highs of $313.98)
- Primary Business: World's largest dedicated semiconductor foundry with ~70% market share, manufacturing chips for Apple, Nvidia, AMD, and virtually every major tech company
TSMC commands approximately 65% of the global foundry market as of 2024. The company produces 60% of the world's semiconductors and 92% of the world's most advanced chips (7nm and below). With customers unable to replicate TSMC's manufacturing capabilities, the company has unprecedented pricing power and serves as the critical bottleneck in the AI revolution.
💰 The Option Flow Breakdown
The Tape (December 12, 2025 @ 10:31:00):
| Time | Symbol | Side | Buy/Sell | Type | Expiration | Premium | Strike | Volume | OI | Size | Spot | Option Price |
|---|---|---|---|---|---|---|---|---|---|---|---|---|
| 10:31:00 | TSM | BID | SELL | CALL $250 | 2026-02-20 | $39M | $250 | 7,500 | 35K | 7,500 | $295.39 | $52.15 |
🤓 What This Actually Means
This is profit-taking on a massive in-the-money call position! Here's the breakdown:
- 💸 Huge cash inflow: $39M ($52.15 per contract × 7,500 contracts) going into someone's pocket
- 📊 Deep ITM calls: $250 strike is $45.39 IN THE MONEY with stock at $295.39
- 🎯 Strategic timing: 70 days to expiration, selling BEFORE Q4 earnings on January 15
- 🏦 Size matters: 7,500 contracts represents 750,000 shares worth ~$221M
- 💰 Locking in profits: These calls likely bought months ago when TSM was $200-220 range
What's really happening here: This trader accumulated a MONSTER long call position when TSM was trading much lower (probably $200-220 range based on the $250 strike selection). Now, with TSM at $295 after the massive AI-driven rally and sitting on deep ITM calls worth $52.15, they're choosing to CLOSE the position and bank the gains rather than hold through earnings volatility on January 15th.
Why sell NOW instead of holding?
- ⚠️ Earnings risk: Q4 earnings on January 15 could create volatility even if results are strong
- 💰 Already won big: If these were bought at $5-10 when TSM was lower, that's 400-900% gains - time to take chips off the table
- 📊 Technical overbought: TSM near all-time highs after parabolic rally from $270 to $313 in October
- 🇨🇳 Geopolitical risks: China-Taiwan tensions remain existential threat to 92% of production
- 🎯 Valuation stretched: After massive rally, limited near-term upside at current levels
Unusual Score: 🔥 ABOVE AVERAGE (Z-score: 1.85) - This is 2-3x larger than typical TSM call activity. While not once-in-a-lifetime, it's definitely notable enough to pay attention. The moderate OI change and similar recent trades suggest this could be part of systematic profit-taking by large holders.
📈 Technical Setup / Chart Check-Up
YTD Performance Chart
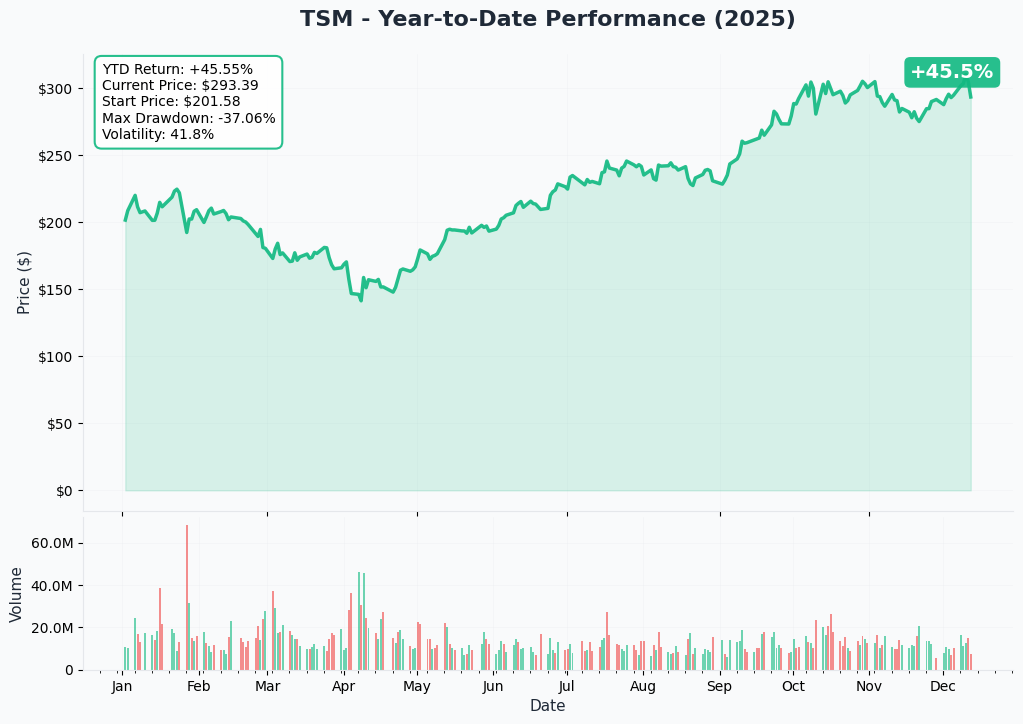
TSM is absolutely on fire this year, driven by insatiable AI chip demand and the 2nm production ramp. The stock has powered higher throughout 2025 as advanced node demand (3nm, 5nm, and upcoming 2nm) exploded.
Key observations:
- 🚀 Explosive rally: Multiple strong advances as AI chip orders accelerated
- 💪 Breakout pattern: Cleared major resistance levels as capacity constraints drove pricing power
- 📊 Volume surge: Institutional accumulation evident in October-November on OpenAI/Nvidia demand
- ⚠️ Near ATH: Current price $295 sits just below all-time high of $313.98
- 🎢 Consolidation risk: After parabolic moves, profit-taking and consolidation natural
Gamma-Based Support & Resistance Analysis
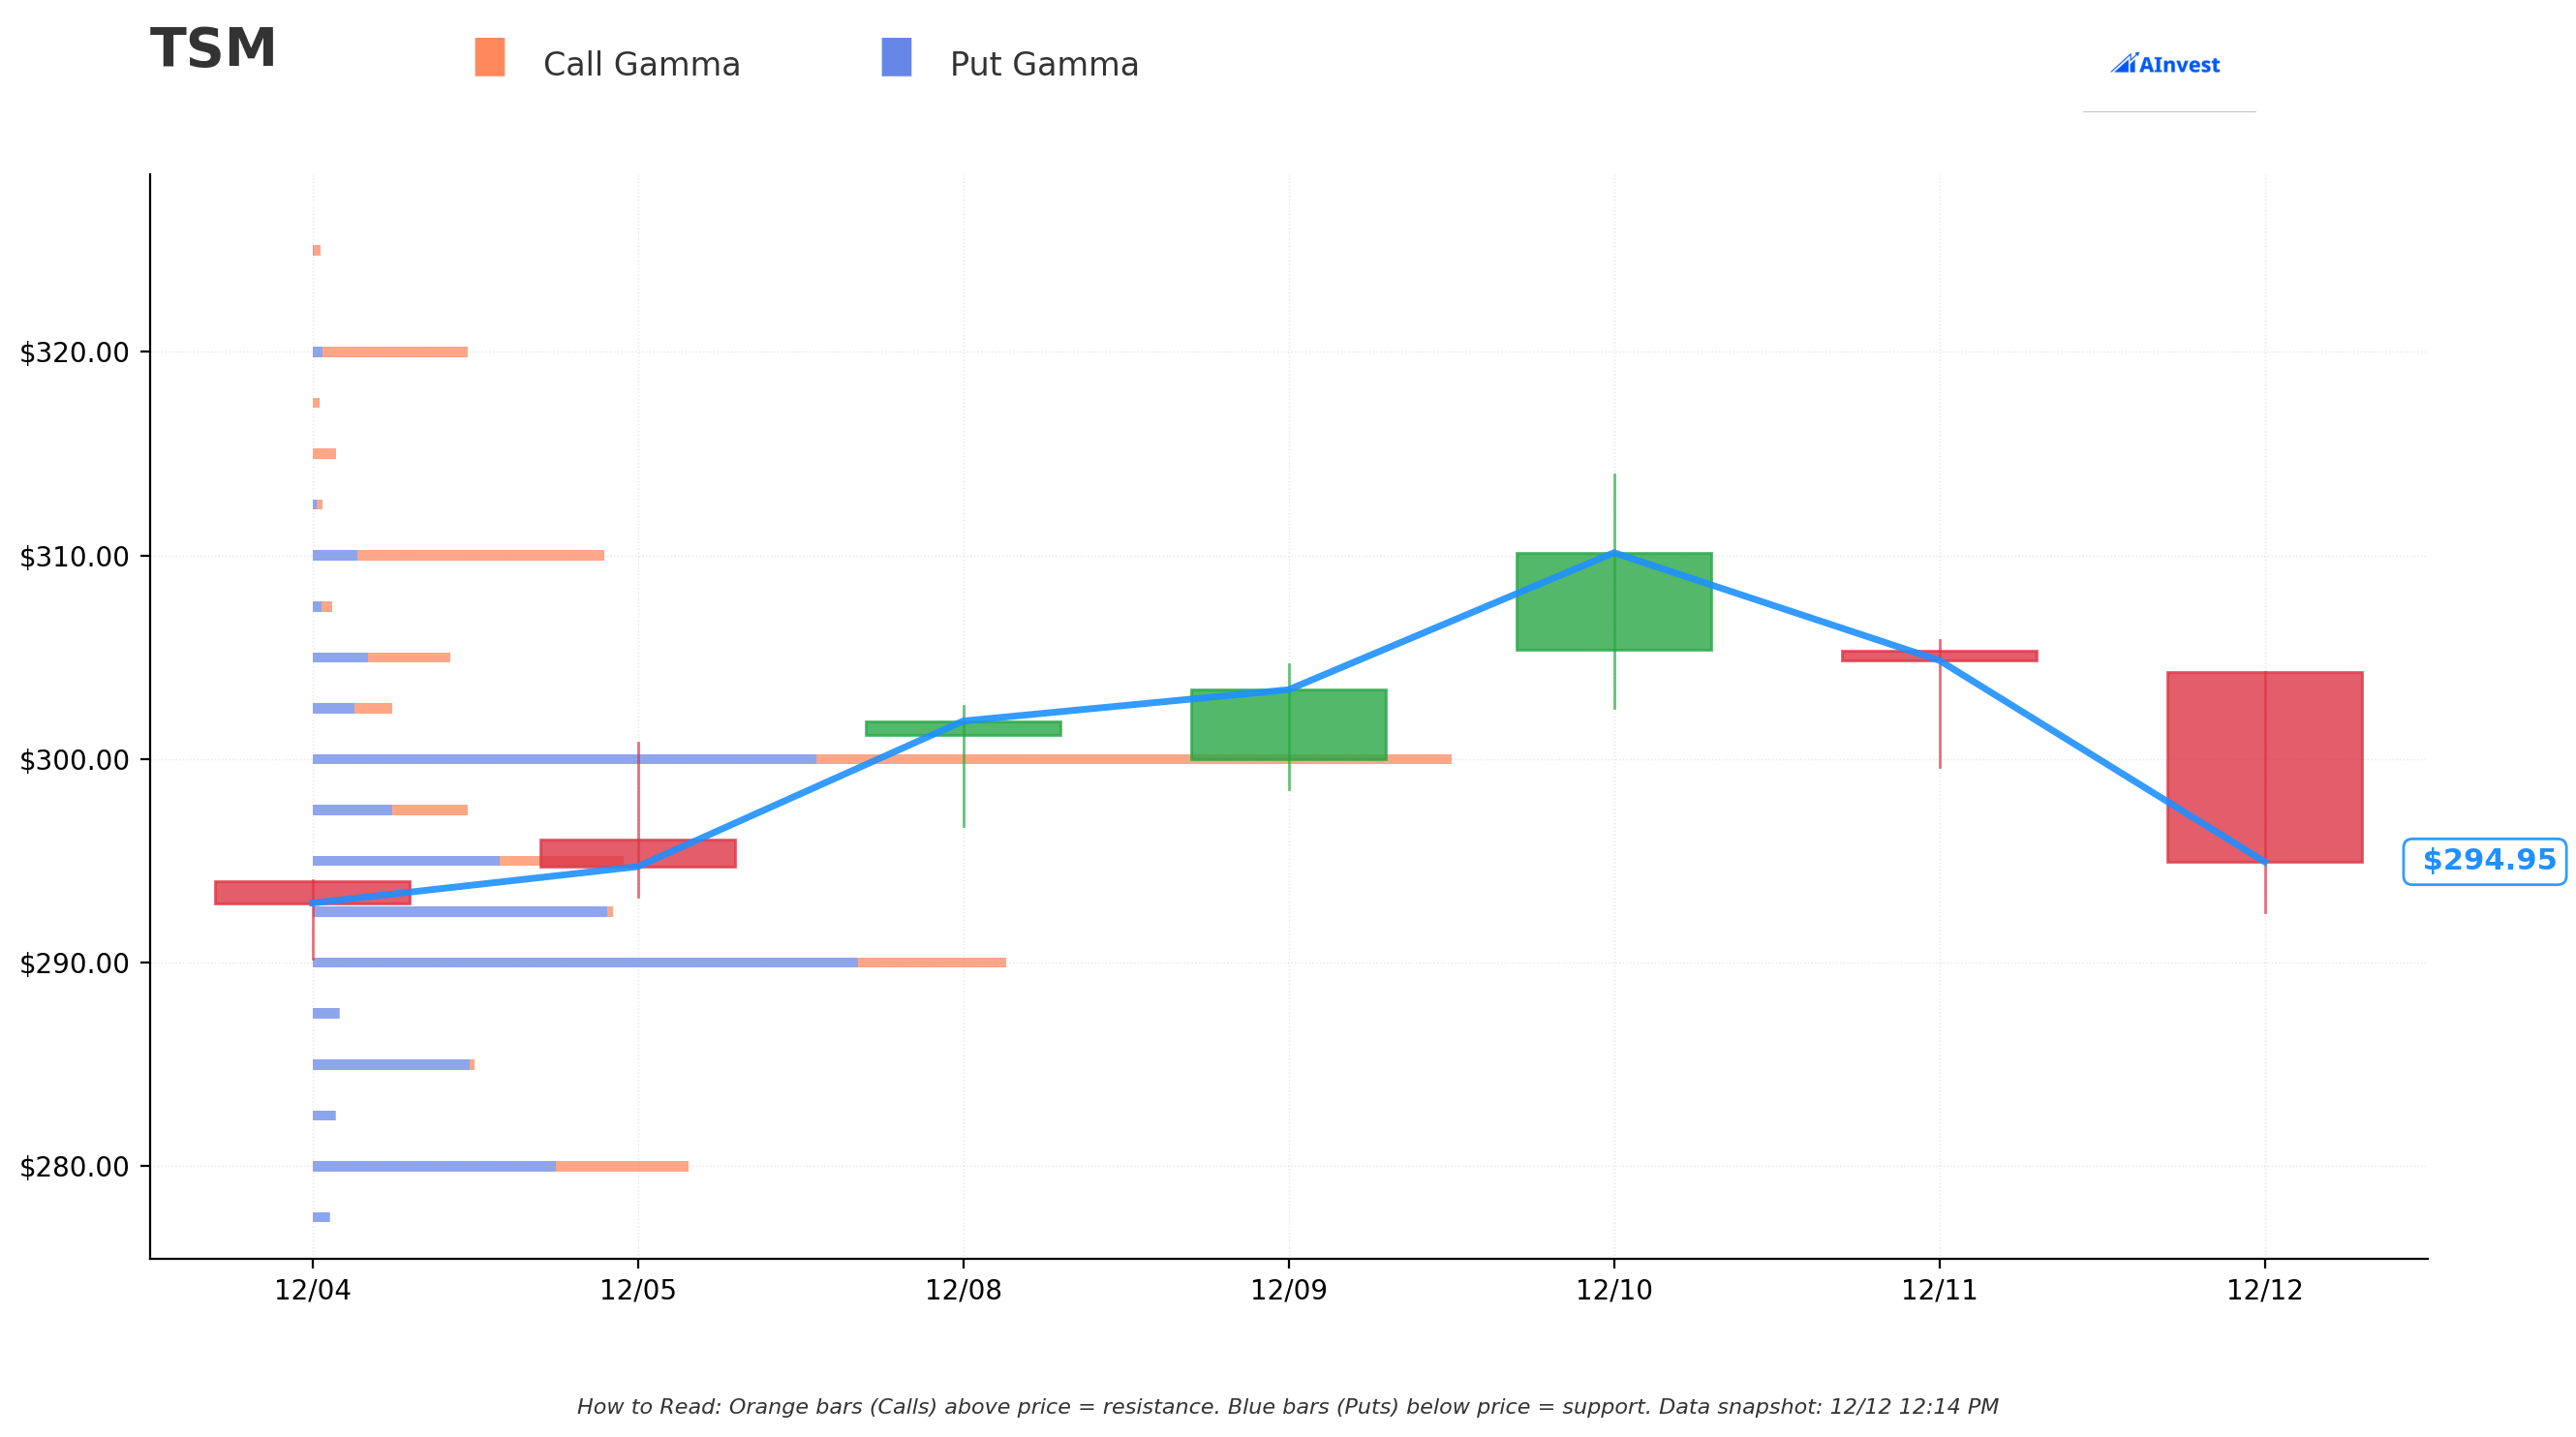
Current Price: $295.36
The gamma exposure map reveals critical price levels where options dealers will defend or challenge the stock price:
🔵 Support Levels (Put Gamma Below Price):
- $295 - Immediate support with 16.0B total gamma exposure (0.12% below current price - CRITICAL FLOOR!)
- $292.50 - Secondary support at 14.4B gamma (strong put interest here)
- $290 - Major structural floor with 34.1B gamma (STRONGEST PUT LEVEL - this is the LINE IN THE SAND)
- $280 - Deep support at 19.1B gamma (5.2% below current)
- $270 - Extended support zone with 10.2B gamma (8.6% pullback level)
- $250 - This trade's strike! 10.8B gamma (15.4% below - disaster scenario)
🟠 Resistance Levels (Call Gamma Above Price):
- $297.50 - Immediate ceiling with 8.7B gamma (dealers will sell into strength here)
- $300 - MAJOR resistance at 60.3B gamma (STRONGEST SINGLE LEVEL - massive call wall!)
- $310 - Secondary resistance at 15.2B gamma (5.0% overhead)
- $320 - Extended upside target at 8.1B gamma (8.3% rally required)
What this means for traders: TSM is trading in a tight range between $295 support and the MASSIVE $300 resistance wall (60.3B gamma - the largest concentration anywhere on the chain). This creates a natural ceiling where market makers will systematically sell to hedge their exposure. Breaking above $300 requires significant institutional buying power.
The immediate downside risk is a break of $295 support, which could lead to quick cascading to the $290 major floor. Below $290, momentum could accelerate toward $280.
Notice the trade strike? The seller closed calls struck at $250 - massively profitable at current $295 price, but also positioned at a major gamma support level. If TSM somehow crashed back to $250 (disaster scenario), that's where dealers would provide strong support.
Net GEX Bias: Bearish (148.3B put gamma vs 118.2B call gamma) - More puts than calls overall suggests defensive positioning and potential downside pressure if support breaks.
Implied Move Analysis
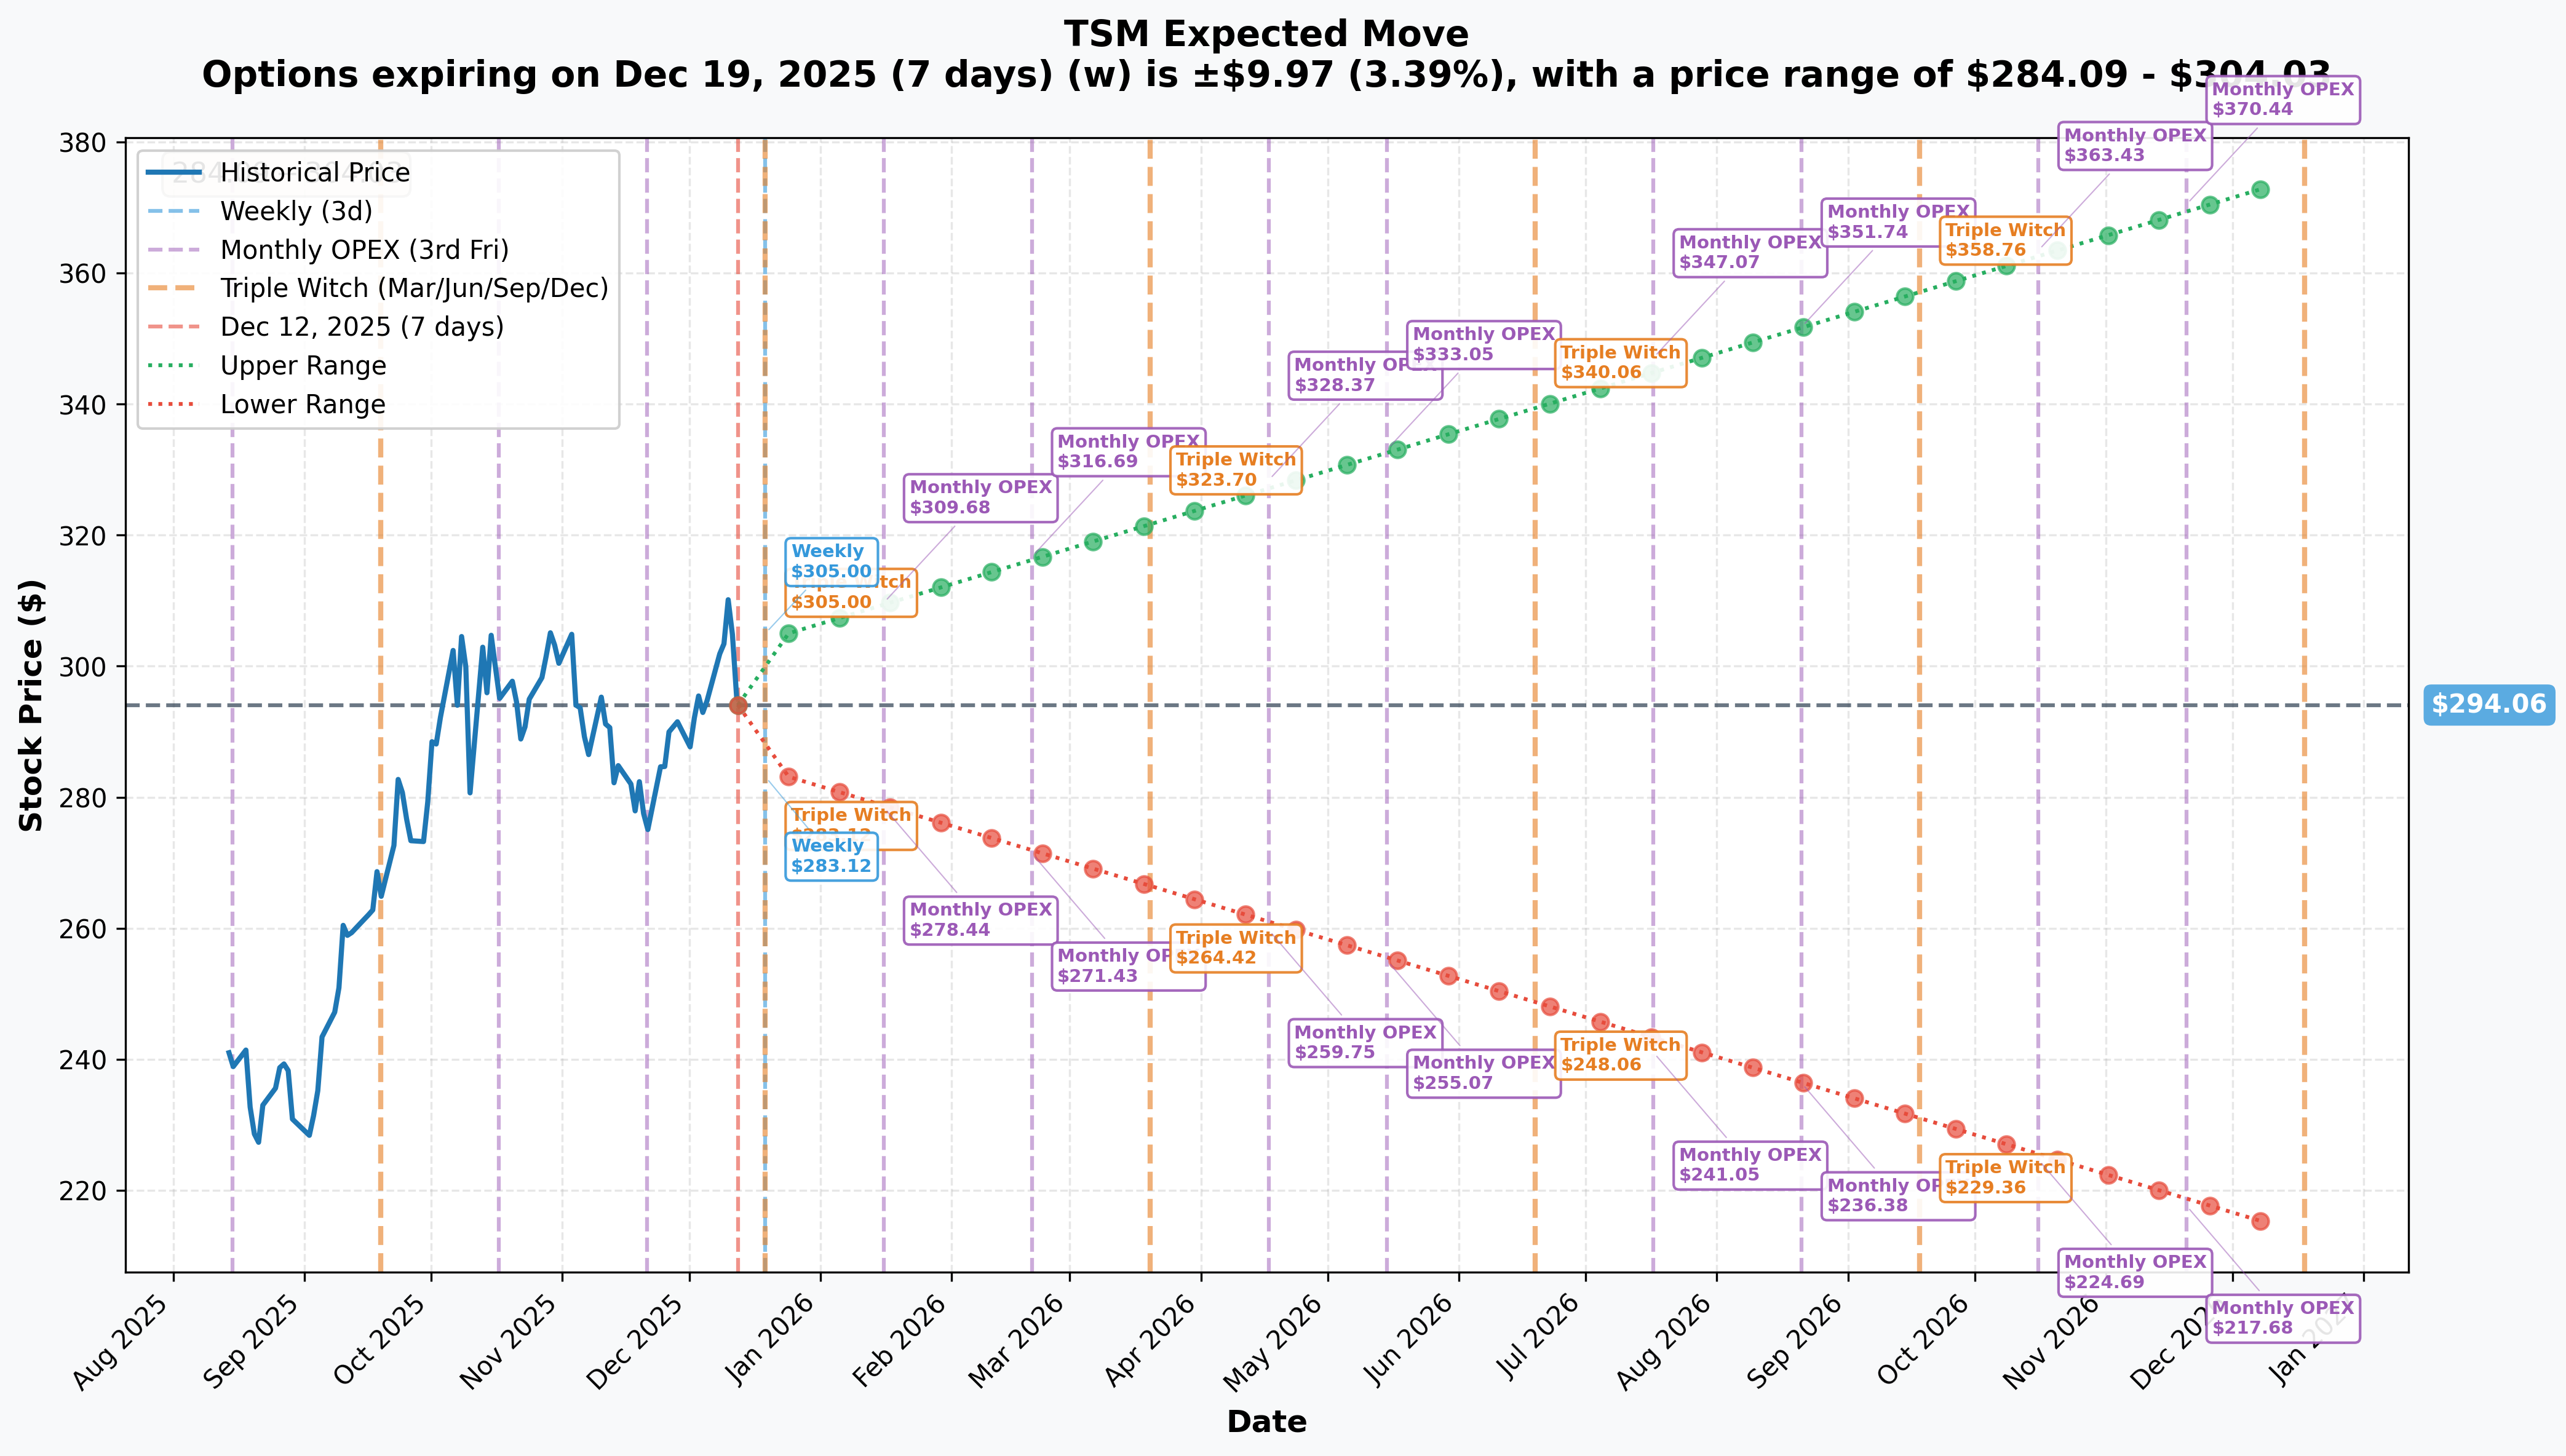
Options market pricing for upcoming expirations:
- 📅 Weekly (Dec 19 - 7 days): ±$9.97 (±3.39%) → Range: $284.09 - $304.03
- 📅 January OPEX (Jan 16 - 35 days): ±$15.64 (±5.32%) → Range: $278.44 - $309.68
- 📅 February OPEX (Feb 20 - 70 days - THIS TRADE!): ±$22.63 (±7.70%) → Range: $271.43 - $316.69
- 📅 Yearly LEAPS (Dec 18, 2026 - 371 days): ±$80.86 (±27.5%) → Range: $213.20 - $374.92
Translation for regular folks: Options traders are pricing in a 3.4% move ($10) through next week's December 19 triple witch, and a 5.3% move ($16) through January when Q4 earnings hit on January 15th. The market expects modest volatility in the near term despite the upcoming earnings catalyst.
The February 20th expiration (when the closed calls would have expired) shows a potential range of $271-$317, suggesting the market sees about 7.7% potential movement in either direction over the next 70 days.
Key insight: The relatively modest implied moves (3-5% for near-term expirations) suggest the options market expects TSM to consolidate rather than make explosive moves. This is consistent with the profit-taking trade - seller may believe the biggest gains are already captured.
🎪 Catalysts
✅ Recent Catalysts (Already Happened - Bullish Foundation)
Q3 2025 Earnings Blowout (October 17, 2025):
- Revenue: $33.1B (+10.1% QoQ, +41% YoY), slightly ahead of guidance
- EPS: $2.92 per ADR unit (NT$17.44), beating consensus by $0.30
- Gross Margin: 59.5% (+0.9pp QoQ) showing pricing power
- Advanced nodes (7nm and below): 74% of wafer revenue
- 3nm contribution: 23% of revenue (up from nearly zero in 2024)
- Full year guidance: Revenue growth "close to mid-30s percent" YoY - exceptional!
Arizona Fab Milestones (September-November 2025):
- First fab entered high-volume 4nm production in Q4 2024, with yields exceeding comparable Taiwan facilities by ~4 percentage points
- Currently producing chips for two Apple products and one AMD product
- Total Arizona investment increased from $65B to $165B (largest foreign direct investment in US history)
- CEO announced Arizona "gigafab" cluster will account for 30% of TSMC's 2nm capacity
Capacity Expansion Announcements (November 2025):
- Announced plan to build three additional 2nm fabs in Taiwan (NT$900B investment)
- CoWoS advanced packaging capacity reaching 75,000 monthly wafers in 2025 (doubling from 2024)
- Nine new facilities coming online in 2025
Price Increase Notifications (September-November 2025):
- Announced 5-10% price increases for advanced nodes (2nm, 3nm, 4nm, 5nm) beginning January 2026
- 2nm wafers expected to cost $30,000+ per wafer (50%+ premium over 3nm)
- CoWoS advanced packaging prices rising 15-20%
Analyst Activity (October-December 2025):
- Susquehanna: Raised price target to $400 from $300
- Bernstein: Raised price target to $330 from $290
- Current consensus: Average price target $371.67 (25.8% upside potential)
- Rating breakdown: 15 Buy, 1 Hold, 0 Sell (Strong Buy consensus)
🔥 Upcoming Catalysts (Next 6 Months)
Q4 2025 Earnings - January 15, 2026 (34 DAYS AWAY!) 📊
TSM reports Q4 results on Wednesday, January 15, 2026. This is THE major near-term catalyst. Wall Street consensus:
- 📊 Revenue: $32.64B (22% YoY growth)
- 💰 EPS: $2.80
- 📈 Company guidance range: $32.2B-$33.4B revenue
- 💪 Gross margin guidance: 59-61%
- 🎯 Operating margin guidance: 49-51%
Key metrics to watch:
- 3nm and 2nm adoption rates (early revenue contribution from 2nm?)
- CoWoS capacity utilization and pricing
- Arizona fab profitability trajectory
- Customer concentration changes (Apple vs Nvidia revenue mix)
- 2026 CapEx guidance and allocation
- Probability: 100% (confirmed date)
2nm Mass Production Ramp (Late 2025-Q1 2026):
- 2nm (N2) node entered mass production in late 2025
- Performance: 15% better performance or 30% lower power consumption vs 3nm
- Early customers: Apple (A20 for iPhone 18), Nvidia (exclusive A16 access), AMD, Qualcomm
- Revenue impact: Analysts estimate 2nm could contribute $8-10B in 2026
- Probability: 95%+ (mass production already initiated)
CoWoS Capacity Milestones (Q1-Q2 2026):
- Target: 125,000-150,000 wafers per month by late 2026
- Nvidia has reportedly booked over half of 2026-2027 CoWoS capacity
- Revenue impact: Advanced packaging revenue projected to grow from $2B (2024) to $5-6B (2026)
- Probability: 90% (infrastructure ahead of schedule)
Apple iPhone 18 / A20 Chip Orders (Q2 2026):
- Apple securing more than half of TSMC's initial 2nm supply for A20 chipsets
- Expected order volume: 80-100M A20 chips for iPhone 18 launch cycle
- Revenue impact: $6-8B incremental from Apple 2nm migration
- Probability: 95% (Apple historically first to adopt new nodes)
Nvidia Blackwell/Rubin Production Expansion (Q1-Q2 2026):
- Nvidia poised to overtake Apple as TSMC's largest customer in 2025
- Secured exclusive access to TSMC's A16 process node
- Revenue impact: Nvidia orders projected at $15-18B annually by 2026
- Probability: 85% (subject to AI demand sustainability)
Price Increase Implementation (January 1, 2026):
- 5-10% increases across advanced nodes take effect
- Expected customer acceptance: high (capacity fully booked through H1 2026)
- Revenue impact: $2-3B incremental annual revenue from pricing alone
- Probability: 95% (customers already notified)
Japan Fab Pivot to 4nm (December 2025):
- Japanese fab pivoting to advanced 4nm production from mature nodes due to AI demand
- Revenue impact: $500M-$1B incremental high-margin revenue
- Probability: 90% (recently announced)
⚠️ Risk Catalysts (What Could Go Wrong)
Geopolitical Risks (HIGH SEVERITY):
- TSMC's Taiwan operations represent 92% of production capacity
- Potential military conflict could cause $2.5T in annual global economic losses
- US export controls to China could impact 7-15% of TSMC revenue
2nm Yield Ramp Risk:
- Technology transition to Gate-All-Around architecture
- Customer dependence on timely ramp for 2026 product launches
- Impact: 1-2 quarter revenue delay if yields below 70%
Competitive Risks:
- China investing $70B in domestic foundry capacity
- Samsung/Intel attempting technology catch-up
- Potential market share erosion if competitors achieve yield parity
🎲 Price Targets & Probabilities
Based on gamma levels, implied move data, and catalyst analysis through February 20 expiration:
📈 Bull Case (30% probability)
Target: $310-$330
How we get there:
- 💪 Q4 earnings CRUSH with revenue at high end of guidance ($33B+) and margins expanding
- 🚀 2nm ramp accelerating faster than expected with multiple customer design wins announced
- 🤖 AI chip demand remains insatiable - CoWoS capacity sold out through all of 2026
- 📊 Price increases stick without customer pushback (pricing power confirmed)
- 🎯 January price increases add immediate boost to gross margins (60%+ achieved)
- 📈 Breakthrough above $300 gamma resistance triggers technical rally
- 🌍 Geopolitical tensions ease (positive Taiwan developments)
Key metrics needed:
- Q4 revenue >$33B (upper guidance)
- 2nm revenue contribution visible in Q1 2026 guidance
- Gross margins sustaining 59-61% despite Arizona dilution
- CapEx guidance manageable ($40-45B for 2026)
Probability: 30% because TSMC already near all-time highs at premium valuation. Massive $300 gamma wall creates resistance. Requires continued perfect execution.
🎯 Base Case (50% probability)
Target: $280-$305 range (CONSOLIDATION)
Most likely scenario:
- ✅ Solid earnings meeting consensus (~$32.5-33B revenue, $2.75-2.85 EPS)
- 📱 2nm ramp progressing on track but not spectacular
- ⚖️ Guidance in-line (normal visibility, no major surprises)
- 🤖 AI demand solid but growth rate moderating from parabolic 2025
- 🇨🇳 Geopolitical status quo - tensions simmering but not boiling over
- 🔄 Trading range-bound between $290 support and $300 resistance for weeks
- 💤 Volatility normalizes post-earnings
- 📊 Market digests 2025 gains, waits for 2026 proof points
This is the profit-taker's view: The February $250 calls were massively profitable. Better to lock in gains at $295 than risk holding through earnings and potential consolidation. Even if stock stays elevated, the $52.15 sale price was excellent.
Why 50% probability: Stock at equilibrium - neither clearly breaking out nor breaking down. Fundamentals excellent but valuation fair. Most institutions will hold and see how 2nm ramp develops.
📉 Bear Case (20% probability)
Target: $260-$280
What could go wrong:
- 😰 Earnings miss or disappointing guidance on conservative outlook
- 🚨 2nm yield issues emerge - production delays announced
- ⏰ Major customer (Apple/Nvidia) reduces orders due to end-demand weakness
- 🇨🇳 Escalation in China-Taiwan tensions creates uncertainty
- 💸 Broader market correction drags mega-cap tech stocks lower
- 📊 Competitors (Samsung) announce breakthrough causing concern
- 🤖 AI spending slowdown fears emerge (cloud CapEx reductions)
- 💰 Margin pressure from Arizona fab costs worse than expected
- 🔨 Break below $290 support triggers cascade to $280
Critical support levels:
- 🛡️ $295: Current support (16.0B gamma) - must hold or momentum shifts
- 🛡️ $290: Major floor (34.1B gamma) - THE critical level
- 🛡️ $280: Deep support (19.1B gamma) - extended pullback zone
Probability: Only 20% because TSMC's fundamentals remain exceptional (70% market share, 100% capacity utilization, pricing power, 2nm launch). Would require multiple negative catalysts to align.
Why the call seller is smart even in bull case: Deep ITM calls at $52.15 are mostly intrinsic value with little upside leverage remaining. If TSM goes to $310, calls only worth ~$60 (+15% gain). Better to take $52.15 now and potentially re-enter with at-the-money options if bullish thesis remains.
💡 Trading Ideas
🛡️ Conservative: Cash Secure Puts at Support
Play: Sell cash-secured puts at major gamma support after earnings clarity
Structure: Sell $290 puts (February 20 expiration - same as closed calls)
Why this works:
- ⏰ Wait for January 15th earnings volatility to pass before initiating
- 📊 $290 represents major gamma support (34.1B - strongest put level)
- 💰 Collect premium for obligation to buy TSM at $290 (1.8% below current price)
- 🎯 If assigned, buying world's best semiconductor company at 2% discount is fine outcome
- 📈 If TSM stays above $290, keep full premium as profit
- 🛡️ Post-earnings IV crush makes put premium attractive (sell after IV drops)
Estimated P&L (post-earnings prices):
- 💵 Collect
$8-12 per put ($800-1,200 premium per contract) - 📈 Best case: TSM stays above $290, keep full premium (8-10% return on $29,000 cash secured)
- 📉 Assignment: Buy TSM at $290 net of premium = $278-282 effective cost (excellent entry)
- ⚠️ Worst case: TSM crashes below $270 = own stock with unrealized loss (but great long-term hold)
Position sizing: Only commit capital you're comfortable using to own TSM stock long-term
Risk level: Low-Moderate (cash secured, willing to own stock) | Skill level: Intermediate
⚖️ Balanced: Bull Put Spread Below Support
Play: Sell bull put spread betting TSM holds above major support
Structure: Sell $290 puts / Buy $280 puts (February 20 expiration)
Why this works:
- 📊 Defined risk spread ($10 wide = $1,000 max risk per spread)
- 🎯 Positioned at two major gamma support levels ($290 and $280)
- 💰 Collect premium betting TSM consolidates rather than crashes
- ⏰ 70 days to expiration provides cushion through earnings and 2nm early feedback
- 🛡️ Even if bearish scenario plays out, $280 floor provides protection
- 📉 Post-earnings entry captures better pricing after IV crush
Estimated P&L (enter after earnings):
- 💵 Collect
$3-4 net credit per spread ($300-400 premium) - 📈 Max profit: $300-400 if TSM stays above $290 at February expiration (30-40% ROI)
- 📉 Max loss: $600-700 if TSM below $280 (defined and limited)
- 🎯 Breakeven: ~$286-287
- 📊 Probability of profit: ~65-70% (TSM stays above $290 support)
Entry timing:
- ⏰ Wait 2-3 days post-earnings (by Jan 17-18) for IV collapse
- 🎯 Only enter if stock trading $293+ (gives breathing room)
- ❌ Skip if stock already below $288 (too close to spread)
Position sizing: Risk 1-3% of portfolio per spread (can scale into multiple spreads)
Risk level: Moderate (defined risk, bullish bias) | Skill level: Intermediate-Advanced
🚀 Aggressive: Call Diagonal Spread (Income + Upside)
Play: Buy longer-dated calls, sell shorter-dated calls against them (diagonal calendar spread)
Structure:
- Buy March $300 calls (82 days out)
- Sell January $305 calls (35 days out)
Why this could work:
- 📊 Capitalizes on $300 gamma resistance keeping TSM range-bound near term
- 💰 Collect premium from short-dated calls while maintaining long-term upside
- ⏰ Short January calls capture earnings IV and theta decay
- 🎯 If TSM stays below $300 through January, short calls expire worthless, keep premium
- 🚀 March long calls provide upside if 2nm ramp accelerates and stock breaks out
- 🔄 Can repeat by selling February calls after January expiration
Estimated P&L:
- 💵 Buy March $300 calls: ~$12-15 each
- 💵 Sell January $305 calls: ~$3-4 each
- 📊 Net debit: ~$8-11 per diagonal spread
- 📈 Best case: TSM at $300-305 at January expiration = short calls expire worthless, long calls gain value
- 🚀 Breakout case: TSM rallies to $320+ = March calls worth $20+, profit even after short call assignment
- 📉 Risk case: TSM drops to $280 = lose most of $8-11 debit
Critical requirements:
- ✅ Understand call calendar spreads and early assignment risk
- ✅ Monitor daily - may need to roll short calls if TSM surges above $305
- ✅ Plan to close or roll positions, not hold to expiration
- ⏰ Strong conviction TSM consolidates below $305 through January but breaks higher later
Risk level: High (complex spread, assignment risk) | Skill level: Advanced only
⚠️ Risk Factors
Don't get caught by these potential landmines:
-
⏰ Earnings in 34 days: Results on January 15, 2026 create volatility risk. While TSMC has strong track record of meeting/beating, any disappointment in 2nm commentary, margin guidance, or CapEx outlook could trigger 5-10% pullback. Options pricing only 5.3% implied move, but actual moves could be larger.
-
🇨🇳 Geopolitical existential risk: Taiwan tensions are THE tail risk. 92% of production in Taiwan creates concentration risk. Any military escalation, even if unlikely, would be catastrophic. Arizona fab still only represents 30% of 2nm capacity long-term. "Silicon Shield" concept (TSMC's importance deters conflict) provides some protection but isn't foolproof.
-
💸 Valuation at premium levels: At $295 with $1.58T market cap, TSMC trades at premium to historical norms reflecting AI boom expectations. Any slowdown in AI chip demand (cloud CapEx optimization, oversupply concerns) would pressure multiple. Stock near all-time highs leaves little margin for error.
-
📊 $300 gamma wall: Massive 60.3B call gamma at $300 creates natural ceiling. Market makers will systematically sell into rallies above $300 to hedge exposure. Breaking through requires sustained institutional buying - not guaranteed even on good news.
-
⚖️ 2nm execution risk: New node transition always carries yield risk. Gate-All-Around architecture is complex. Any delays or yield issues would impact 2026 revenue projections. Customers (Apple, Nvidia) depend on timely ramp for their product launches.
-
🏭 Arizona fab margin dilution: Construction costs 4-5x higher than Taiwan facilities. Management guides 1-2% margin dilution from overseas fabs. Could be worse if yield/efficiency issues emerge.
-
🤖 AI demand sustainability: 80%+ of growth driven by AI/HPC demand. If AI infrastructure investment slows (cloud providers optimize spending, model training efficiency improves reducing GPU needs), TSMC's growth trajectory would decelerate sharply.
-
💰 Customer concentration: Nvidia becoming largest customer (
$15B), Apple second ($14B). Heavy dependence on two customers creates risk if either pulls back orders. -
🔧 Competitive catch-up attempts: Samsung ramping 2nm with GAA, Intel 18A featuring backside power delivery. While TSMC maintains lead, any competitive breakthrough would pressure pricing power and market share.
🎯 The Bottom Line
Real talk: Someone just took $39 MILLION off the table by closing deep in-the-money call options on TSM. This isn't bearish on TSMC's incredible long-term story - it's smart profit management after massive gains.
What this trade tells us:
- 🎯 Sophisticated player made HUGE money on TSM rally (probably 400-900% gains on these calls)
- 💰 Choosing to bank gains at $295 rather than hold through earnings volatility on January 15
- ⚖️ The timing (34 days before earnings) shows preference for certainty over potential additional upside
- 📊 Deep ITM calls have limited upside leverage remaining - better to lock in $52.15 now
- ⏰ February 20 expiration would have captured earnings but seller wants out before that risk
This is NOT a "sell everything" signal - it's a "take profits after huge gains" signal.
If you own TSM:
- ✅ Consider trimming 20-30% at current levels if you've got big gains (lock in profits, reduce risk)
- 📊 If holding through earnings, set mental stop at $290 (major gamma support) to protect position
- ⏰ TSMC is a fantastic long-term hold - but after big rallies, taking some chips off the table is prudent
- 🎯 If earnings beat AND stock breaks $305, could reload trimmed shares on momentum
- 🛡️ Core long-term holders should stay put - TSMC's multi-year growth story intact
If you're watching from sidelines:
- ⏰ January 15, 2026 is the key date - wait for earnings clarity before entering
- 🎯 Pullback to $280-290 post-earnings would be excellent entry (major gamma support)
- 📈 Looking for confirmation of: 2nm ramp on track, margins sustaining 59%+, strong Q1 guidance
- 🚀 Longer-term (12-24 months), 2nm dominance, price increases, and AI demand support $320-350 targets
- ⚠️ Current $295 offers limited margin of safety - better entries likely after earnings volatility
If you're bearish:
- 🎯 Wait for earnings before initiating shorts - fighting momentum into ATH is dangerous
- 📊 First support at $295, major support at $290 (34.1B gamma wall)
- ⚠️ Put spreads after earnings offer defined-risk way to play consolidation
- 📉 Break below $290 would be trigger for deeper pullback toward $280
- ⏰ Better risk/reward shorting after rallies above $305 (gamma resistance)
Mark your calendar - Key dates:
- 📅 December 19, 2025 - Weekly/monthly/quarterly triple witch expiration
- 📅 January 1, 2026 - 5-10% price increases take effect
- 📅 January 15, 2026 (Wednesday) - Q4 FY2025 earnings report (THE KEY CATALYST!)
- 📅 January 16, 2026 - Monthly OPEX
- 📅 February 20, 2026 - This trade's expiration date (if held)
- 📅 Mid-2026 - Apple A20 (iPhone 18) production ramp
- 📅 Q2 2026 - CoWoS capacity reaching 125K-150K wafers/month
Final verdict: TSMC's long-term story is EXCEPTIONALLY compelling - 70% foundry market share, 2nm mass production launch, pricing power, and position as the indispensable backbone of AI infrastructure. BUT, at $295 near all-time highs after 2025's massive rally, the $39M profit-taking trade sends a clear message: smart money is banking gains rather than pressing bets.
The right move? Wait for earnings clarity on January 15. Let the dust settle. Look for better entry points $280-290 if profit-taking accelerates. The AI revolution and 2nm ramp will still be here in 6 weeks, and you'll sleep better buying the dip than chasing at all-time highs.
Be patient. Protect capital. The best opportunities come to those who wait. 💪
Disclaimer: Options trading involves substantial risk of loss and is not suitable for all investors. This analysis is for educational purposes only and not financial advice. Past performance doesn't guarantee future results. The above-average unusual score reflects this specific trade's size relative to recent TSM history - it does not guarantee market direction. Always do your own research and consider consulting a licensed financial advisor before trading. Earnings create binary event risk with potential for 5-10% moves either direction. The call seller may have complex portfolio needs not applicable to retail traders.
About Taiwan Semiconductor Manufacturing Company: TSMC is the world's largest dedicated semiconductor foundry, commanding approximately 70% market share. The company manufactures advanced semiconductors for Apple, Nvidia, AMD, and virtually every major tech company, with market cap of $1.58 trillion in the Semiconductor Manufacturing industry.