💎 TSM Massive $28M Call Sale - Smart Money Cashing Out AI Chip Rally! 💰
📅 December 30, 2025 | 🔥 Unusual Activity Detected
🎯 The Quick Take
Someone just dumped $28 MILLION worth of TSM call options this morning at 10:43:03! This massive exit sold 5,100 contracts of $250 strike calls expiring February 20th - closing a deeply profitable long position with TSM trading at $302.19. With TSM up +43% YTD and sitting at all-time highs as the AI chip manufacturing king, smart money is taking $28M in profits off the table just 16 days before the critical Q4 earnings release. Translation: Institutions made a fortune on the AI boom and are locking in gains before potential volatility!
📊 Company Overview
Taiwan Semiconductor Manufacturing Company (TSM) is the undisputed global leader in chip manufacturing, commanding 72% of the foundry market:
- Market Cap: $1.56 Trillion (world's 10th most valuable company)
- Industry: Semiconductors - Foundry Services
- Current Price: $302.19 (near all-time high of NT$1,530 / ~$305 USD)
- Primary Business: Manufactures chips for Apple, Nvidia, AMD, Qualcomm - essentially the entire AI/smartphone/computing ecosystem
- Competitive Moat: Only foundry with volume 2nm production, 1-2 year technology lead on all competitors
💰 The Option Flow Breakdown
The Tape (December 30, 2025 @ 10:43:03):
| Time | Symbol | Side | Buy/Sell | Type | Expiration | Premium | Strike | Volume | OI | Size | Spot | Option Price |
|---|---|---|---|---|---|---|---|---|---|---|---|---|
| 10:43:03 | TSM | ASK | SELL | CALL $250 | 2026-02-20 | $28M | $250 | 5.1K | 30K | 5,000 | $302.19 | $55.20 |
🤓 What This Actually Means
This is profit-taking on a massive winning position! Here's what went down:
- 💸 Huge exit: $28M ($55.20 per contract × 5,100 contracts) in premium collected
- 🎯 Deep in-the-money: $250 strike is $52+ below current price ($302.19) - these calls are LOADED with intrinsic value
- ⏰ Strategic timing: 52 days to expiration, exiting just 16 days before Q4 earnings (Jan 15, 2026)
- 📊 Size matters: 5,100 contracts represents 510,000 shares worth ~$154M at current prices
- 🏦 Institutional lock-in: This trader is cashing out profits accumulated during TSM's explosive AI-driven rally
What's really happening here: This trader likely bought these $250 calls months ago when TSM was trading near $250-260 (early Q4 2025). With TSM now at $302 after the massive Q3 earnings beat and 2nm production ramp, each call has gained ~$52 in intrinsic value PLUS time value. At $55.20 per contract, they're walking away with roughly $28M in CASH rather than gambling on earnings volatility. Think of it like selling your winning lottery ticket before the next draw - you've already won, why risk giving it back?
Unusual Score: 🔥 ABOVE AVERAGE (1.24x Z-score) - This is the 3rd largest similar trade in recent TSM history. While not once-in-a-lifetime, it's definitely institutional-scale positioning with $28M flowing out in a single block. The volume of 5,100 contracts against only 30,000 open interest means this represents 17% of ALL open interest at this strike - that's material!
📈 Technical Setup / Chart Check-Up
YTD Performance Chart
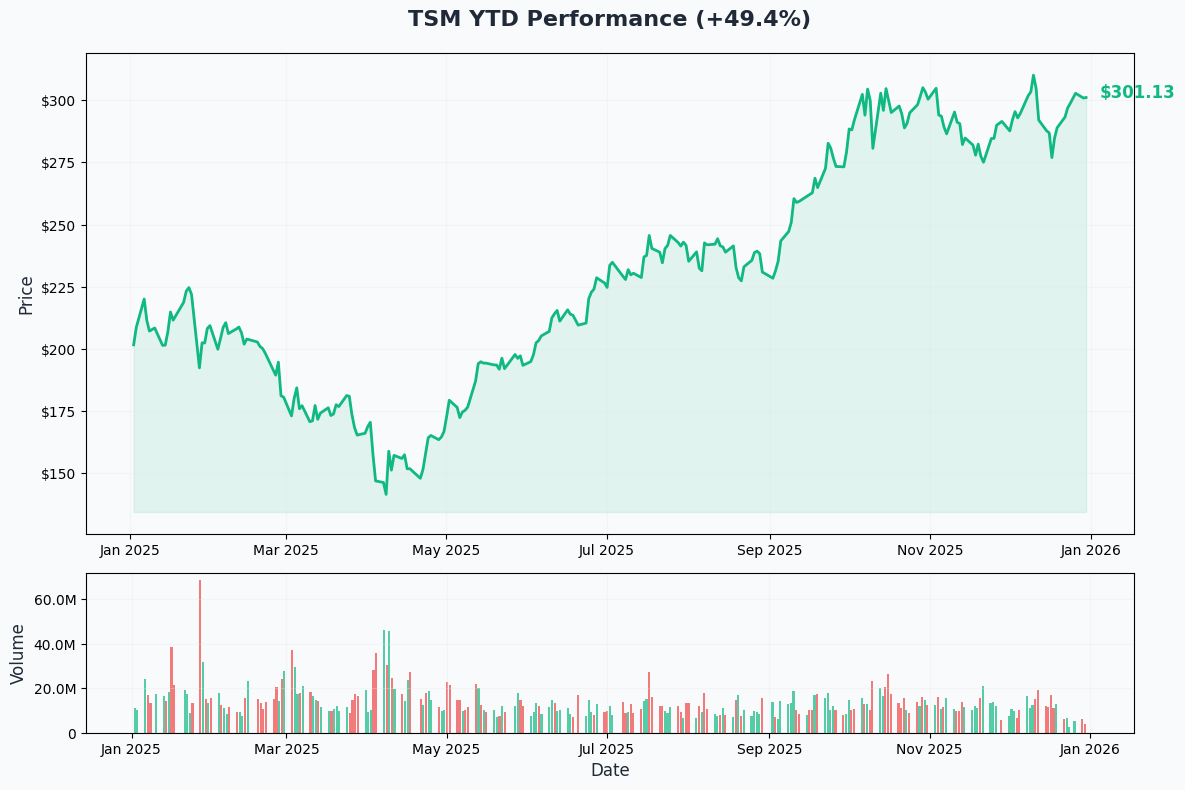
TSM is absolutely crushing it - up +43% YTD with current price of $302.19 hitting fresh all-time highs. The chart tells the AI manufacturing dominance story - the stock broke out from the $200-220 consolidation zone in early Q4 2025 and hasn't looked back, powered by record Q3 earnings with 40% YoY profit growth and the successful 2nm (N2) production launch.
Key observations:
- 🚀 Breakout confirmed: Explosive move from $260 to $305+ in Q4 2025 on AI demand acceleration
- 📈 All-time high territory: TSM hit NT$1,530 (record high) on December 29, 2025 - literally the peak!
- 🎢 Steady grind higher: Unlike volatile AMD, TSM's rally has been more controlled and institutional
- 📊 Volume surge: Massive accumulation in December as analysts raised price targets to $330-400 range
- ⚠️ Extended technically: After 43% YTD gain with earnings in 16 days, near-term consolidation or pullback risk elevated
Gamma-Based Support & Resistance Analysis
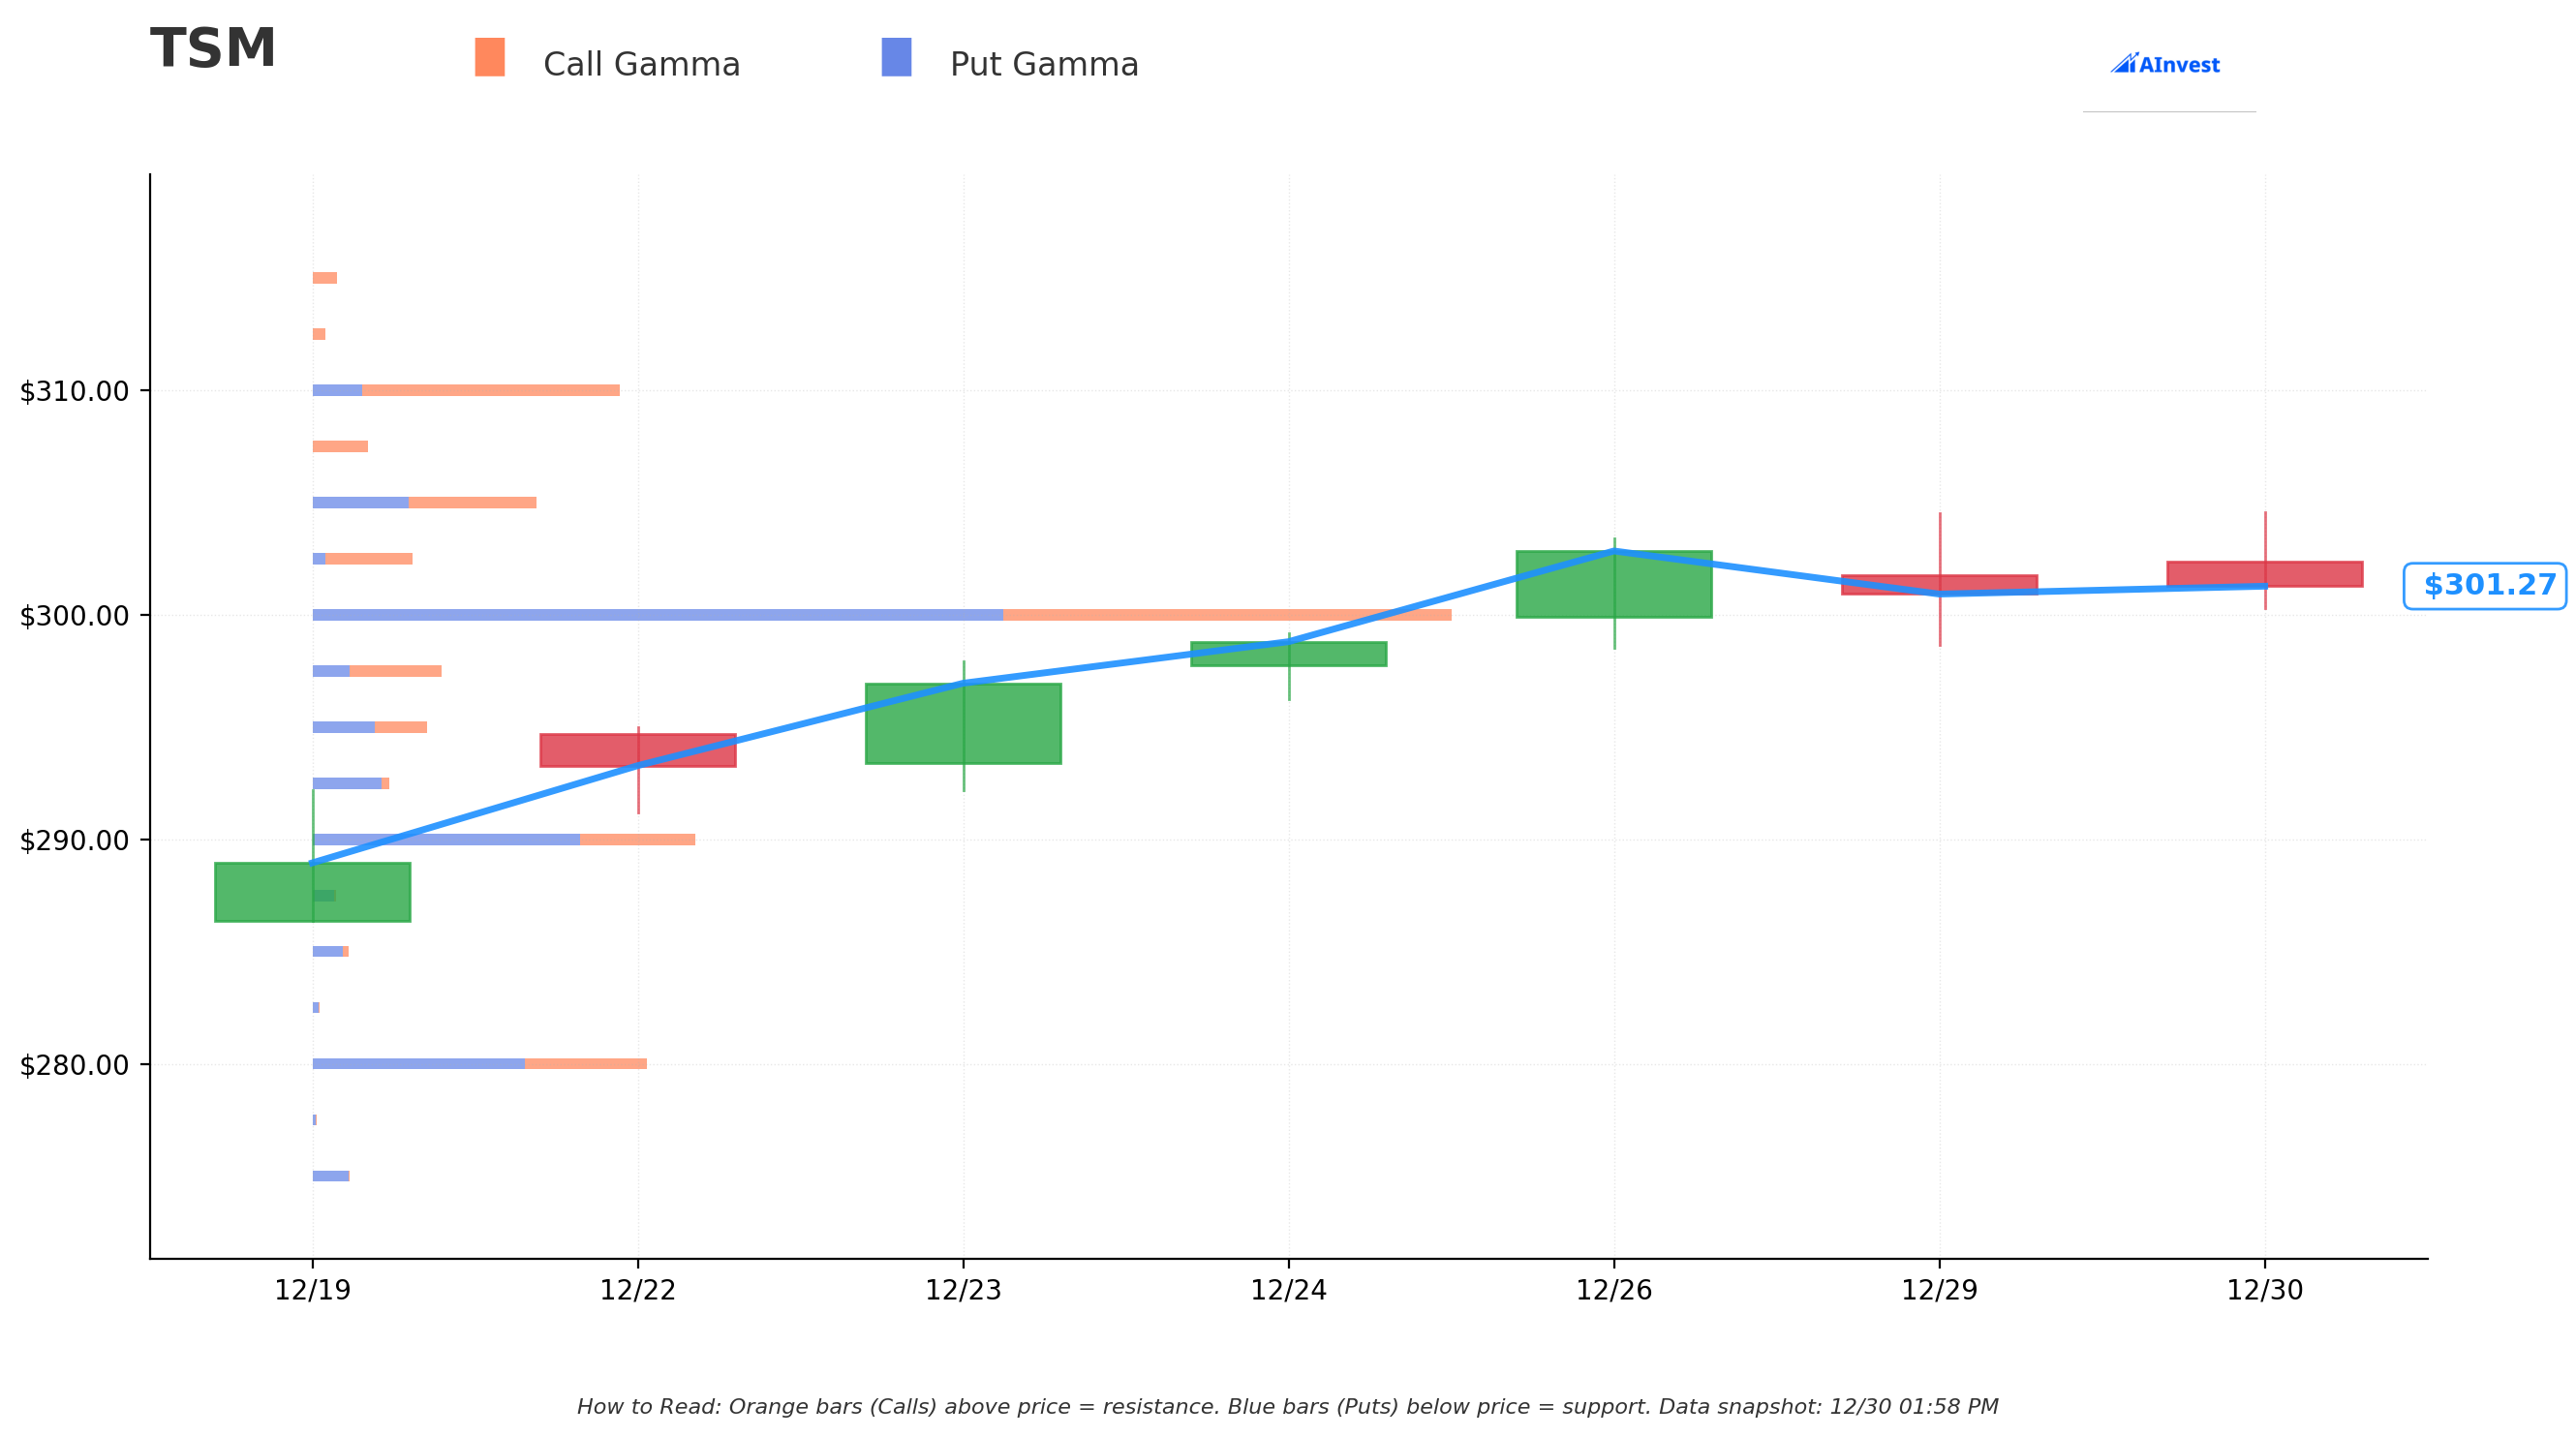
Current Price: $301.25
The gamma exposure map reveals critical price magnets that will govern TSM's near-term action:
🔵 Support Levels (Put Gamma Below Price):
- $300 - MASSIVE support with 55.5B total gamma exposure (STRONGEST FLOOR BY FAR!)
- $297.50 - Secondary support at 6.3B gamma (just below current price)
- $295 - Additional floor with 5.6B gamma
- $290 - Major structural support with 18.8B gamma (2nd strongest level overall)
- $280 - Deep support at 16.3B gamma (10% below current price)
- $270 - Extended support zone with 9.0B gamma
- $260 - Far support at 5.9B gamma
- $250 - Disaster floor at 8.2B gamma (exactly where this trade is struck!)
🟠 Resistance Levels (Call Gamma Above Price):
- $305 - Immediate ceiling with 10.9B gamma (very strong resistance just 1.2% overhead)
- $310 - Major resistance at 15.0B gamma (strongest overhead barrier - 2.9% above)
- $320 - Secondary ceiling with 8.8B gamma (6.2% rally required)
- $330 - Extended upside target at 7.0B gamma (9.5% above current)
What this means for traders: TSM is trading in a POWERFUL support zone right at the $300 level with absolutely MASSIVE 55.5B gamma - this is the single strongest level on the entire gamma map! Market makers are holding enormous positions here, creating a natural floor. However, overhead resistance at $305 (10.9B) and especially $310 (15.0B) will make further upside challenging in the near term. This setup suggests consolidation in the $300-305 range until earnings provides the next catalyst.
Notice anything? The call seller struck at $250 where there's 8.2B gamma support - this was WAY out-of-the-money when they originally bought it, but now it's $52 in-the-money! They rode the entire rally from $250 to $302 and are taking profits at the very top, protected by the massive $300 gamma wall.
Net GEX Bias: Strongly Bullish - Call gamma dominates with resistance levels stacking up above, but the sheer magnitude of $300 support (55.5B) suggests this is a major accumulation zone. Overall positioning remains constructive for bulls.
Implied Move Analysis
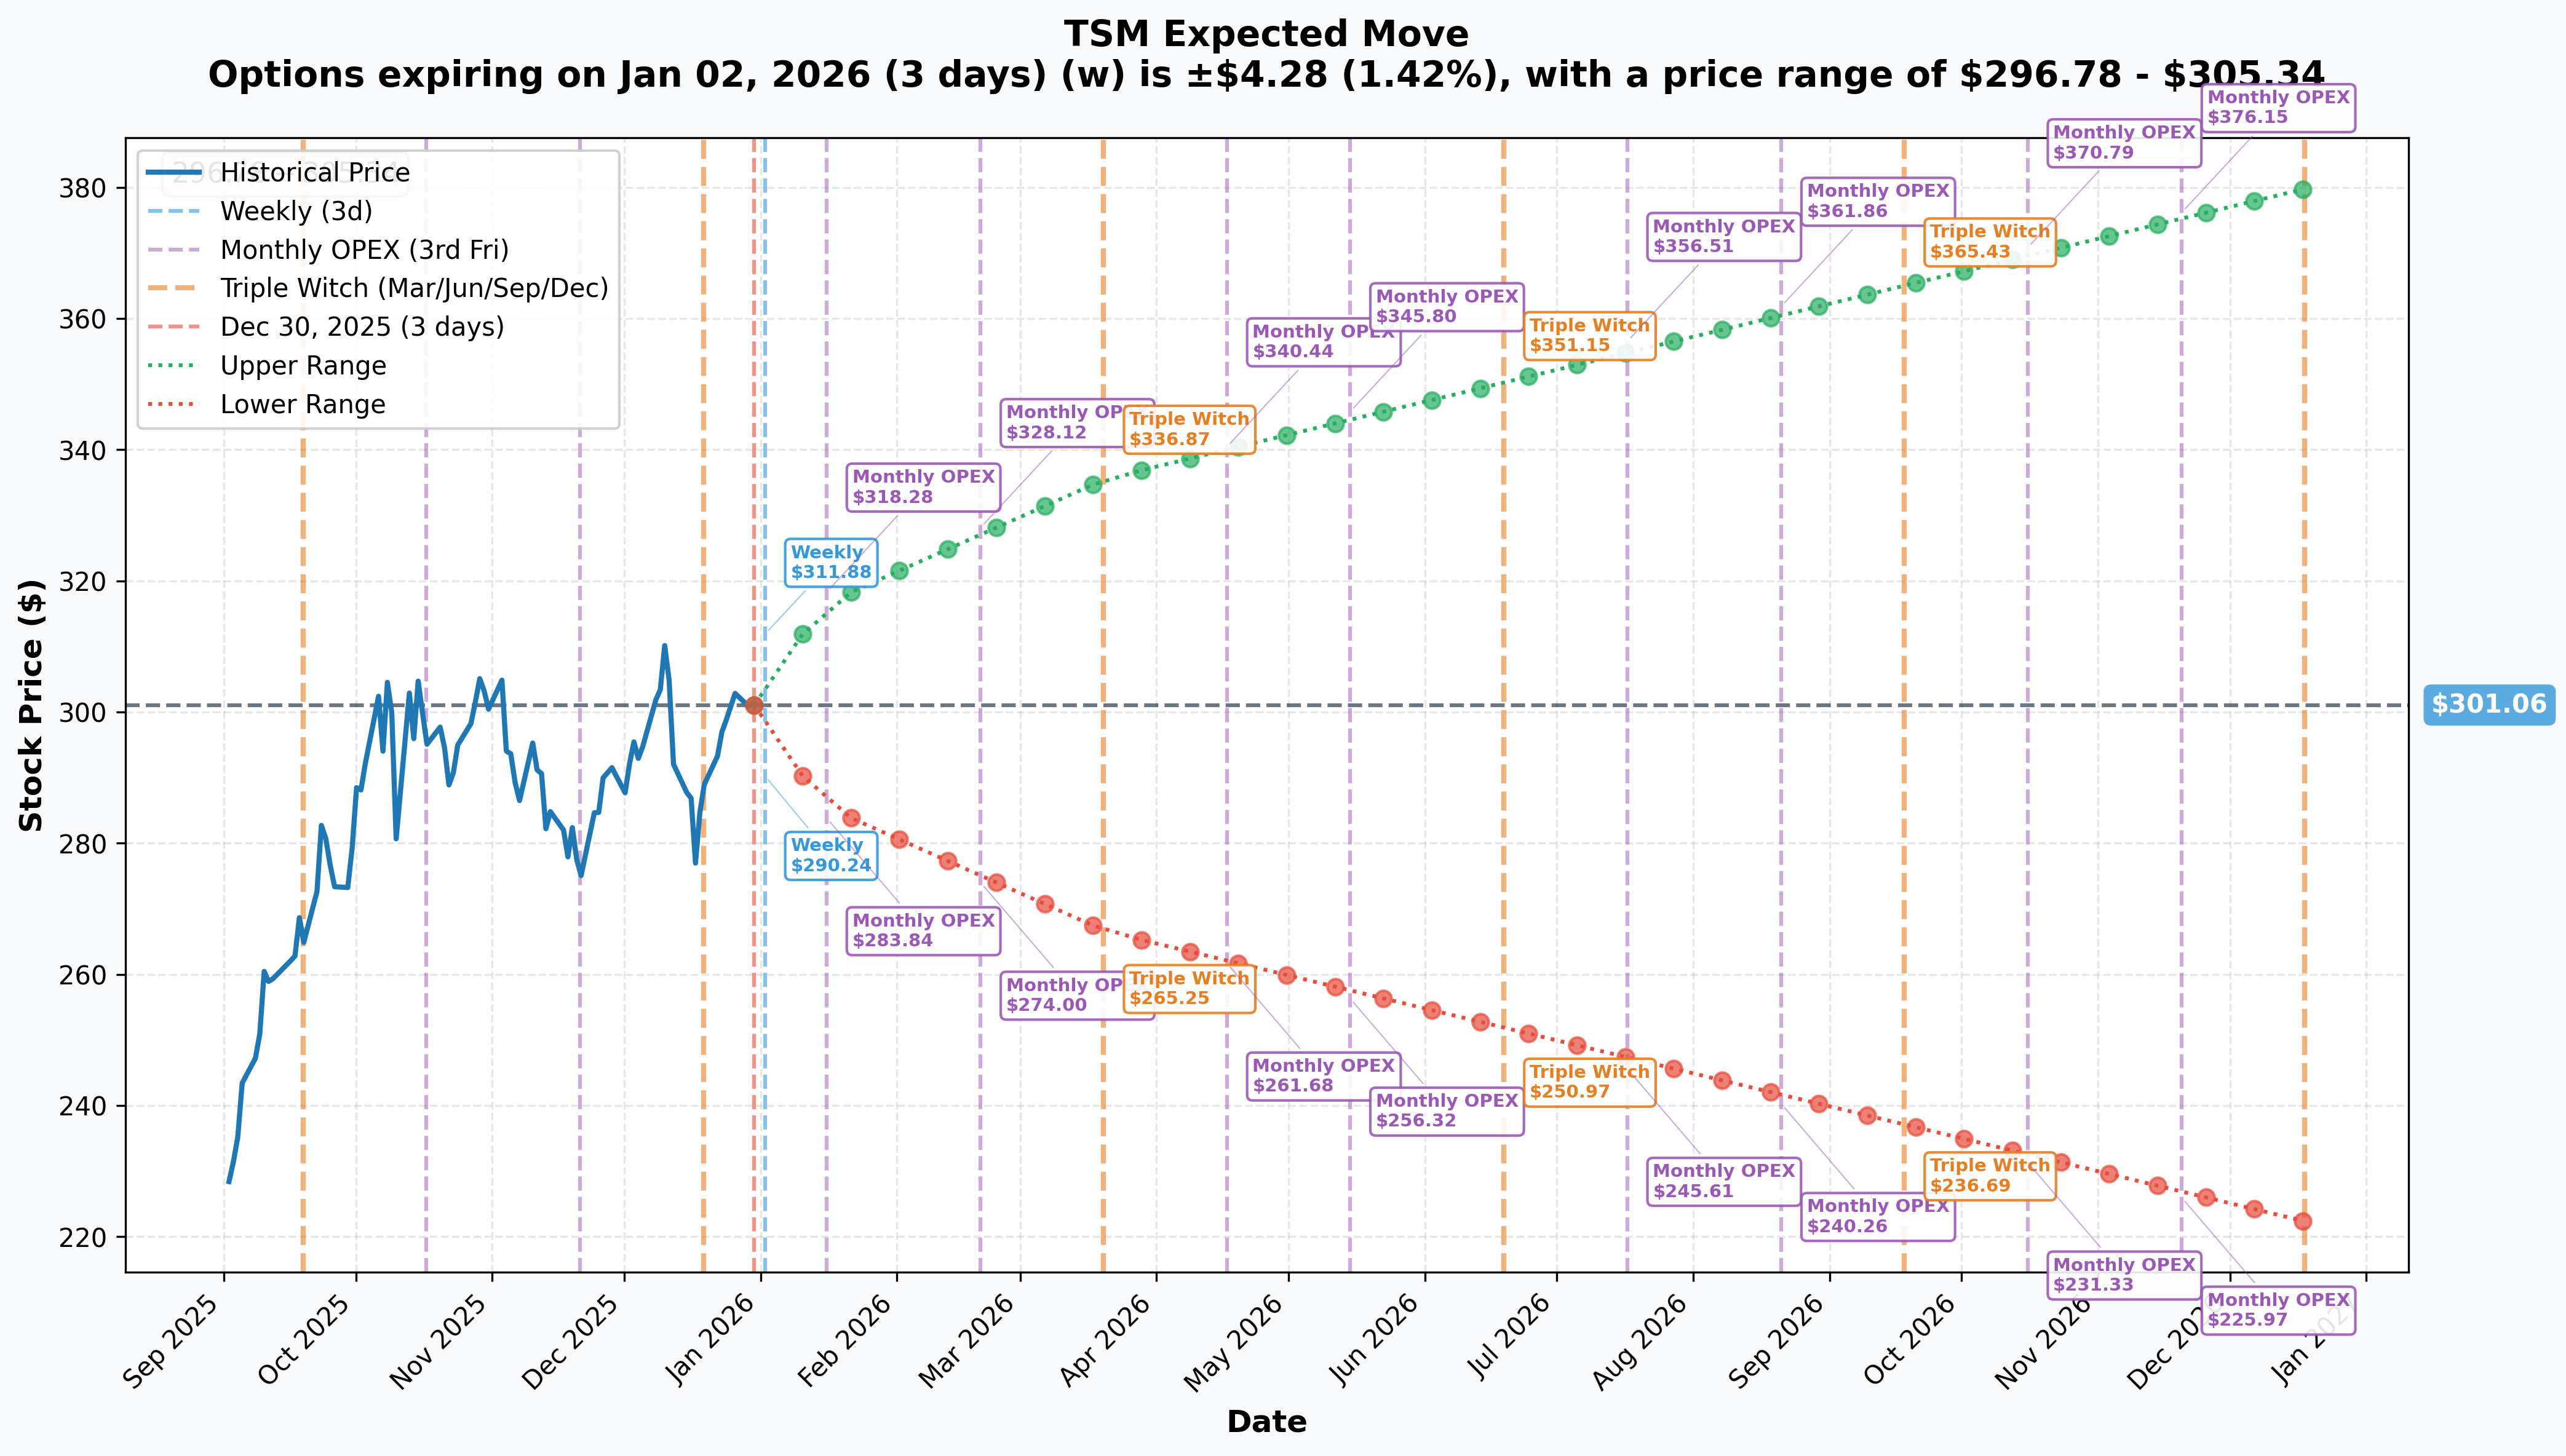
Options market pricing for upcoming expirations:
- 📅 Weekly (Jan 2 - 3 days): ±$4.28 (±1.42%) → Range: $296.78 - $305.34
- 📅 Monthly OPEX (Jan 16 - 17 days): ±$15.72 (±5.22%) → Range: $285.33 - $316.79
- 📅 Quarterly Triple Witch (Mar 20 - 80 days): ±$34.51 (±11.46%) → Range: $266.55 - $335.57
- 📅 Yearly LEAPS (Dec 18 - 353 days): ±$78.82 (±26.18%) → Range: $222.24 - $379.88
Translation for regular folks: Options traders are pricing in a 1.4% move ($4) by Friday for year-end positioning, but a significant 5.2% move ($16) through January OPEX which includes the critical Q4 earnings on January 15th. The market expects moderate volatility for earnings - notably LESS than the wild 11% moves priced for AMD, reflecting TSM's larger market cap ($1.56T) and more stable institutional ownership.
The February 20th expiration (when this $28M trade expires) implies a range of $274-328 over the next 52 days. This aligns with the call seller's thesis: they've captured the $250→$302 rally and see limited upside beyond $305-310 resistance in the near term. Why hold through earnings uncertainty when you've already banked massive gains?
Key insight: The relatively modest 5.2% earnings move (compared to 11%+ for high-beta semis) reflects TSM's blue-chip status and predictable business model. Smart money knows TSM will likely beat earnings (they always do), but upside surprise potential is limited given already-strong valuations and well-telegraphed AI demand.
🎪 Catalysts
🔥 Immediate Catalysts (Next 30 Days)
Q4 2025 Earnings - January 15, 2026 (16 DAYS AWAY!) 📊
TSMC reports fiscal Q4 2025 results on Wednesday, January 15, 2026 before market open (Taiwan time = Tuesday evening US EST). This is THE catalyst that will determine if TSM continues its march higher or consolidates gains. Wall Street consensus and key expectations:
- 📊 Revenue: $32.8B (midpoint of $32.2B-33.4B guidance, +22% YoY) vs $26.9B last year - driven by AI accelerator production
- 💰 EPS: ~$2.80 (consensus) vs $2.13 last year (+31% YoY)
- 🤖 HPC/AI Revenue: Expected to remain at 57%+ of total wafer revenue (continuing Q3's record mix)
- 💻 Gross Margin: Target 59-61% range (continuing expansion trend from Q3's 59.5%)
- 📈 Full Year 2025: Expected to confirm ~$120B total revenue (+33% YoY growth vs 2024's $90.08B)
- 🏭 2nm Ramp Update: Critical commentary on N2 production volumes and customer adoption
Upside surprise potential: Analysts expect strong 2026 guidance with 3-10% price increases across advanced nodes taking effect. CoWoS packaging capacity doubling to 75,000 wafers/month and Nvidia booking over 50% of 2026 capacity provide visibility.
Downside risk factors: Any disappointment in N2 yield rates, Arizona fab productivity concerns, or conservative 2026 CapEx guidance (currently $40-42B) could trigger profit-taking given 43% YTD gain. Geopolitical tensions around Taiwan export controls (VEU status revoked for Nanjing fab effective Dec 31, 2025) may get questions.
Historical precedent: TSM typically beats earnings expectations and provides conservative guidance, leading to initial positive reaction followed by consolidation. Post-earnings moves have historically been 3-7% for mega-cap TSM (vs 10-15% for higher-beta peers).
🚀 Near-Term Catalysts (Q1-Q2 2026)
2nm (N2) Production Ramp - THE Game-Changer 🏭
TSMC officially began volume production of N2 process chips in Q4 2025, marking the company's first gate-all-around (GAA) nanosheet transistor technology:
- 💪 N2 offers ~10% performance improvement, ~20% power reduction, and ~15% density improvement vs. N3E
- 🎯 Capacity fully booked through 2026 with initial 40,000 wafer-per-month capacity ramping to 100,000 by end of 2026
- 🍎 Apple secured >50% of initial N2 capacity for 2026 iPhone chips
- 🚀 This solidifies TSMC's 1-2 year technology lead over Samsung and Intel - no competitor has volume GAA production yet
- 💰 Pricing power: N2 wafers commanding 20-30% premium over N3, driving gross margin expansion
Why this matters for the call trade: If N2 ramp encounters ANY yield issues, delays, or customer adoption problems, it could stall TSM's momentum. The call seller is exiting BEFORE we get detailed N2 update at earnings, suggesting they want to lock in profits rather than bet on perfect execution.
CoWoS Advanced Packaging Expansion - The Nvidia Money Machine 💵
- 🏭 Monthly CoWoS capacity reached record 75,000 wafers in 2025 (nearly doubled from 38,000 in 2024)
- 🎮 Nvidia booked >50% of 2026 CoWoS capacity (~400,000-425,000 wafers) for Blackwell Ultra and Rubin GPUs
- 📈 Target: 120,000-130,000 wafers/month by end of 2026 (+60-73% YoY growth!)
- 🏢 New facilities: Zhunan (AP6B permit received Dec 3), Taichung (AP5B in H1 2026), Tainan (AP8 online end of 2025)
- 💰 CoWoS revenue growing at 50%+ CAGR - highest margin business segment
The bottleneck premium: Demand for CoWoS exceeds supply by ~3x, forcing spillover to OSAT partners. TSMC can charge premium pricing and lock customers into multi-year contracts.
Arizona Fab Expansion - Derisking Geopolitical Premium 🇺🇸
TSMC's $165 billion Arizona investment represents the largest foreign direct investment in US history:
- ✅ Fab 21 Phase 1 (4nm): Achieved 92% yield rate - surpassing Taiwan fabs by ~4%! Mass producing Nvidia AI chips by early 2026
- 🏗️ Fab 21 Phase 2 (3nm): Equipment installation to begin Q3 2026, production targeted 2027 (ahead of original 2028 schedule)
- 🚀 Fab 21 Phase 3 (2nm/A16): Construction began April 2025; production before end of decade
- 💵 Total investment increased from initial $12B (2020) to $165B - signal of commitment
- 🎯 Planning expansion to 6 fabs, 2 advanced packaging facilities, and R&D center
Why Arizona matters: Reduces "Taiwan risk premium" that has historically kept TSM valuation suppressed vs peers. Successful US manufacturing proves technology transfer capability and derisks geopolitical scenarios.
📊 Upcoming Technology Milestones (H1-H2 2026)
N2P & A16 Launches - Next-Gen Nodes
- N2P (Performance-Enhanced 2nm): Volume production targeted H2 2026 with further performance/power benefits over standard N2
- A16 (Backside Power Delivery): Volume production H2 2026 featuring Super Power Rail (SPR) technology - critical for large AI/HPC processors
- CoWoS Evolution: Scaling to 5.5x reticle size interposers in 2026 (9.5x in 2027) to accommodate 12 HBM stacks + 4 AI accelerators
Customer Dynamics Expected:
- Nvidia: Rubin GPU tape-out using TSMC's SoIC packaging; mass production of Blackwell Ultra continuing
- Apple: Expected to be first major N2 customer with 2026 iPhone chips (A20 processor)
- AMD: Continued 3nm/4nm orders for MI300-series AI accelerators and next-gen Ryzen
- Qualcomm/MediaTek: Flagship mobile SoCs on N3/N2 nodes
Pricing Power Locked In:
- 3%-10% Price Increases effective 2026 across advanced nodes due to supply-demand imbalance
- Average wafer prices increased >15% annually since 2019
- Gross margins expanded 3.3x in 2025 alone - pricing power intact despite competition fears
⚠️ Risk Catalysts (Negative)
Taiwan Strait Geopolitical Tensions 🇹🇼
The elephant in the room that keeps TSM's P/E ratio suppressed vs mega-cap tech peers:
- 🚨 China conducted "Justice Mission 2025" large-scale military drills simulating Taiwan blockade scenarios
- ⚖️ "Gray zone" military incursions around Taiwan increasingly frequent
- 🌊 TSMC headquarters located <100 miles from Chinese coast - entire global tech supply chain at risk
- 📊 Research suggests Taiwan supply chain vulnerable to quarantine scenarios before 2027
- 💰 "Taiwan risk premium" historically discounts TSM 20-30% vs theoretical fair value
Mitigation efforts: $165B Arizona investment, Japan/Germany fab diversification, but these remain <5% of total capacity through 2027. Any conflict would be catastrophic for global chip supply regardless of geographic diversification.
US Export Controls Tightening 🇺🇸
TSMC's Nanjing fab loses "VEU" (Validated End User) status effective December 31, 2025:
- 📜 Requires individual approvals for US equipment shipments (vs previous expedited status)
- 🏭 Nanjing operations represent ~3% of total production capacity - limited direct financial impact
- ⚠️ Policy escalation risk: Trump Administration added 65+ PRC entities to export Entity List in 2025
- 🇨🇳 China accounts for historical 15-20% of TSMC revenue - further restrictions could materialize
TSMC Statement: "No risk of supply chain disruption; applying for approvals item-by-item" - downplaying impact but adds bureaucratic friction.
Competitive Technology Risks (Low Probability, High Impact)
- 🔬 Intel 18A targeting 10% transistor density advantage vs TSMC equivalents (unproven; Intel must execute flawlessly)
- 🏭 Samsung accelerating GAA development with potential hyperscaler partnerships
- 🇨🇳 SMIC gaining share despite US restrictions; domestic China demand resilient
Reality check: TSMC's lead has never been wider - 72% foundry market share vs Samsung's 7.2% and SMIC's 6%. Technology gap of 1-2 full nodes. Competitive risk is theoretical, not imminent.
🎲 Price Targets & Probabilities
Using gamma levels, implied move data, and upcoming catalysts, here are the scenarios through February 20th expiration:
📈 Bull Case (30% probability)
Target: $320-335
How we get there:
- 💪 Earnings CRUSH with revenue toward $33.4B high-end and Q1 2026 guidance surprising to upside ($34B+)
- 🏭 N2 production update shows yields exceeding expectations; capacity ramp ahead of schedule
- 🤖 2026 CapEx guidance increases toward $50B (vs current $40-42B) signaling aggressive capacity expansion
- 💰 Gross margin guidance 60%+ for 2026 (pricing power narrative strengthens)
- 🍎 Major customer wins announced (Apple committing to N2P for 2027 products, additional Nvidia capacity locks)
- 🇺🇸 Arizona Fab 21 Phase 1 producing Nvidia chips at scale by February; Phase 2 timeline pulled forward
- 📈 Breakout above $310 gamma resistance triggers technical rally to $320-330 range (implied move upper bound)
Key metrics needed:
- HPC/AI revenue mix sustaining 55%+ levels
- CoWoS capacity expansion timeline confirmed (target 130,000 wafers/month by end 2026)
- No major geopolitical escalation
- Continued market share gains (maintain 72%+ foundry share)
Probability assessment: 30% because it requires strong execution AND multiple positive surprises. TSM already trades at $302 (+43% YTD) with Street expecting solid results - upside beyond $320 needs truly exceptional news. Gamma resistance at $310 (15.0B) and $320 (8.8B) creates natural headwinds.
🎯 Base Case (50% probability)
Target: $290-310 range (CONSOLIDATION)
Most likely scenario:
- ✅ Solid earnings slightly beating consensus (~$33.0B revenue, $2.85-2.90 EPS)
- 📱 N2 ramp progressing on schedule but not spectacular - meeting expectations without fireworks
- ⚖️ Guidance in-line with Street expectations (Q1 2026: $33-34B revenue, maintaining gross margin 59-61% range)
- 🤖 AI/HPC demand narrative intact but no dramatic upside revision
- 🇹🇼 Geopolitical concerns persist but no major escalation (status quo)
- 🔄 Trading within gamma support ($300 massive floor at 55.5B) and resistance ($310 at 15.0B) bands for weeks
- 📊 Market digests YTD gains, waits for N2P/A16 launches and Arizona Phase 2 proof points
- 💤 Volatility moderates post-earnings (IV normalizes from current elevated levels)
This is the call seller's likely view: Stock consolidates in $290-310 range, option value decays from $55.20 toward intrinsic value ($52 at current price), time value erodes. Rather than hold through earnings and risk giving back gains if stock pulls back to $290-295 on "good but not great" results, they're banking $28M in cash today. Smart risk management.
Why 50% probability: TSMC is a high-quality business with predictable earnings trajectory. Barring geopolitical shock, stock likely trades sideways-to-up modestly. The $300 gamma wall (55.5B - largest level) should provide strong support. Most institutions will hold through earnings expecting modest beat, then reassess based on 2026 guidance quality.
📉 Bear Case (20% probability)
Target: $270-290 (TEST SUPPORT LEVELS)
What could go wrong:
- 😰 Earnings miss or weak guidance disappoints - even small revenue miss to $32.5B could trigger -5-8% gap down
- 🚨 N2 yield rates below expectations or production ramp delayed (capacity targets pushed to H2 2026 vs H1)
- ⏰ 2026 CapEx guidance conservative ($38-40B vs Street expecting $42-45B) - signals demand concerns
- 🇹🇼 Geopolitical escalation: China military exercises intensify or new US export restrictions announced
- 💸 Broader tech selloff drags mega-cap semis lower (Nvidia/AMD weakness spreads to TSMC)
- 📊 Competitive pressure: Samsung announces GAA breakthrough or Intel 18A wins major customer
- 🤖 AI CapEx slowdown concerns emerge (hyperscalers guiding lower 2026 spending)
- 💰 Margin compression from aggressive capacity additions or pricing environment shifts
- 🔨 Break below $300 gamma support triggers cascade to $290, potentially $280
Critical support levels:
- 🛡️ $300: MASSIVE gamma floor (55.5B) - MUST HOLD or sentiment shifts
- 🛡️ $290: Major support (18.8B gamma) - likely strong buying here
- 🛡️ $280: Deep support (16.3B gamma) - pullback scenario
- 🛡️ $270: Extended floor (9.0B gamma) - Bear case target
Probability assessment: Only 20% because TSMC's fundamentals are exceptionally strong (72% market share, 2nm technology lead, pricing power intact) and the company has a 30-year track record of consistent execution. Geopolitical risk is the primary bear thesis, which is low-probability but high-impact. The call seller's exit may signal they see earnings as "sell the news" event even on a beat.
Call P&L in Bear Case:
- Stock at $280 on Feb 20: Calls worth $30.00, current holder loses from intrinsic decay (but seller already locked $55.20)
- Stock at $270 on Feb 20: Calls worth $20.00, significant give-back from current $55.20
- Stock at $250 on Feb 20: Calls worth $0 (at-the-money), catastrophic scenario
The seller is avoiding this tail risk entirely by exiting at $302 near all-time highs.
💡 Trading Ideas
🛡️ Conservative: Follow Smart Money - Take Profits
Play: If you own TSM shares or calls, consider trimming 30-50% at current $300+ levels
Why this works:
- ⏰ Earnings in 16 days creates binary event risk with ±5.2% implied move ($16 swing possible)
- 💸 Stock at all-time highs after 43% YTD gain - you've already won! Protect gains.
- 📊 $28M institutional exit signals smart money is derisking before volatility
- 🎯 Better re-entry likely post-earnings if stock consolidates back to $290-295 support
- 📉 "Good but not great" earnings could trigger profit-taking even on a beat (classic sell-the-news)
- 🤔 Massive $300 gamma support (55.5B) means downside limited, but upside also capped by $310 resistance
Action plan:
- 👀 Sell 30-50% of TSM position at $300-305 levels (lock in 40%+ YTD gains)
- 🎯 Keep core position if you're long-term holder, but take some chips off the table
- ✅ If earnings beat and stock rallies to $315-320, don't chase - wait for pullback
- 📊 If earnings disappoint and stock drops to $285-295, consider re-buying what you sold
- ⏰ For call holders: Consider rolling Feb $250 calls to later dates (Mar/Apr) at higher strikes if you want to stay long
Risk level: Minimal (preserving gains) | Skill level: Beginner-friendly
Expected outcome: Avoid potential -8-10% drawdown if earnings disappoint. Still participate if stock grinds higher. Sleep better at night.
⚖️ Balanced: Post-Earnings Put Spread (Defined Risk Hedge)
Play: After earnings volatility settles, sell put spread to generate income in consolidation range
Structure: Buy $295 puts, Sell $285 puts (March 20 expiration - Quarterly OPEX)
Why this works:
- 🎢 IV crush after earnings makes put spreads more attractive (implied vol drops from elevated pre-earnings levels)
- 📊 Defined risk spread ($10 wide = $1,000 max risk per spread)
- 🎯 Targets gamma support zone at $285-295 where institutions have positioned
- 🤝 Selling premium in expected consolidation range post-earnings
- ⏰ 80 days to expiration (Mar 20) gives time for any post-earnings volatility to settle
- 🛡️ Protects against "good news priced in" scenario where stock drifts lower even after beating
Estimated P&L (adjust after seeing post-earnings IV):
- 💰 Collect ~$2-3 net credit per spread post-earnings (sell $285 put for ~$5-6, buy $295 put for ~$8-9)
- 📈 Max profit: $200-300 if TSM above $295 at March expiration (keep entire credit)
- 📉 Max loss: $700-800 if TSM below $285 (defined and limited to spread width minus credit)
- 🎯 Breakeven: ~$292-293
- 📊 Probability of profit: ~60-65% (TSM staying above $292-293 through March)
Entry timing:
- ⏰ Wait 2-3 days post-earnings (by Jan 18-20) for full IV collapse
- 🎯 Only enter if stock trading $298+ (gives cushion to breakeven)
- ❌ Skip if stock already below $290 (too close to short strike)
Position sizing: Risk only 3-5% of portfolio (this is income generation with defined risk)
Risk level: Moderate (defined risk, neutral-to-bullish) | Skill level: Intermediate
🚀 Aggressive: Earnings Straddle ONLY IF You Believe In Volatility Surprise
Play: Buy straddle betting earnings move exceeds 5.2% implied move (ADVANCED ONLY!)
Structure: Buy $300 calls + Buy $300 puts (January 16 expiration - day after earnings)
Why this could work:
- 💥 Implied move only 5.2% but geopolitical risk could cause 8-10% spike on ANY Taiwan news
- 🎰 N2 production update could dramatically surprise (either way) - yields way ahead OR behind schedule
- 📊 At all-time highs, stock could EXPLODE on blowout guidance OR crater on disappointment
- 🚀 2026 CapEx guidance surprise (major increase to $50B+ OR cut to $38B) moves stock significantly
- ⚡ Only need stock to move >6-7% either way to profit after IV crush
- 📈 Betting the Street is UNDERPRICING earnings volatility risk given geopolitical backdrop
Why this could blow up (SERIOUS RISKS):
- 💸 EXPENSIVE: Straddle costs ~$16-18 ($1,600-1,800 per straddle at current IV levels)
- ⏰ TIME DECAY BRUTAL: Theta burns -$80-100/day as earnings approaches
- 😱 IV CRUSH KILLER: Even if stock moves 4-5%, IV collapse could still result in LOSS on both legs
- 📊 Narrow profit zone: Stock could stay in $295-305 range (solid beat, in-line guidance) and you lose most of premium
- 🎢 Need 7%+ move to breakeven after factoring IV crush ($280 downside or $320+ upside)
- ⚠️ TSM is mega-cap with stable institutional base - unlikely to see 15% gap like smaller semis
Estimated P&L:
- 💰 Cost: ~$16-18 per straddle (using Jan 16 expiration to capture earnings + immediate reaction)
- 📈 Profit scenario: Stock moves to $320 or $280 (6.5-7% move) = $3-5 gain (18-30% ROI)
- 🚀 Home run: Stock moves to $330 or $270 (10%+ move on geopolitical shock) = $15+ gain (90%+ ROI)
- 📉 Loss scenario: Stock ends $295-305 range = lose $10-14 (60-80% loss)
- 💀 Total loss: Stock flat at $300 = lose entire $16-18 (100% loss)
Breakeven points:
- 📈 Upside breakeven: ~$317-318 (need 5.5%+ rally)
- 📉 Downside breakeven: ~$282-283 (need 6%+ drop)
CRITICAL WARNING - DO NOT attempt unless you:
- ✅ Have traded earnings straddles before and understand IV crush mechanics
- ✅ Can afford to lose ENTIRE premium (real possibility given TSM's stability!)
- ✅ Understand you're betting AGAINST the options market's 5.2% implied probability
- ✅ Can monitor position Wednesday morning (Taiwan earnings = Tuesday night US) and take profits quickly
- ✅ Accept that even if you're RIGHT on direction, IV crush could still cause loss
- ⏰ Plan to close position within 12-24 hours post-earnings (don't hold to expiration)
Risk level: EXTREME (can lose 100% of premium) | Skill level: Advanced only
Probability of profit: ~35-40% (lower than coin flip due to IV crush and TSM's lower volatility profile vs high-beta semis)
⚠️ Risk Factors
Don't get caught by these potential landmines:
-
⏰ Earnings binary event in 16 days: Results Wednesday January 15th before market open (Taiwan = Tuesday evening US EST) create MATERIAL volatility risk. Stock could gap 5-8% either direction based on revenue ($32.8B vs $33.2B makes difference), N2 commentary (yields, capacity ramp timeline), and 2026 guidance (CapEx, gross margin, revenue growth). Even on beats, TSM has history of "sell the news" if guidance conservative.
-
🇹🇼 Taiwan geopolitical risk - THE permanent overhang: China conducted large-scale military drills simulating Taiwan blockade scenarios in 2025. This is NOT theoretical - it's the #1 reason TSM trades at 24.8x forward P/E vs Nvidia's 40x+ despite superior business quality. "Gray zone" military incursions increasingly frequent. ANY escalation causes 10-20% immediate drop regardless of fundamentals. $165B Arizona investment helps but remains <5% of capacity through 2027.
-
💸 Valuation at premium levels after 43% YTD run: Trading at 29.6x trailing P/E and 24.8x forward P/E near all-time highs. While justified by dominant market position, stock is priced for PERFECT execution. Requires 2026 revenue growth of 20%+ and gross margins sustaining 59-61% to justify current multiple. Zero margin of safety at $302 - any stumble magnified.
-
🇺🇸 US Export Controls tightening: Nanjing fab loses VEU status effective December 31, 2025 - requires individual approvals for US equipment shipments. While Nanjing is only 3% of capacity, policy escalation risk remains as Trump Administration added 65+ PRC entities to export list in 2025. Further restrictions could remove 15-20% revenue opportunity if China business curtailed.
-
🏭 N2 execution risk with industry-first GAA technology: TSMC's 2nm production is first-ever volume GAA (Gate-All-Around) nanosheet transistors. While initial yields reportedly strong, this is unproven at scale. ANY yield issues, customer qualification delays, or production bottlenecks would be catastrophic for growth narrative. Capacity fully booked through 2026 leaves NO room for error.
-
🐋 Smart money exiting $28M position at peak: This institutional call sale signals sophisticated players are TAKING PROFITS rather than holding through earnings. When funds managing hundreds of millions sell $28M in winning positions 16 days before earnings (rather than holding for potential further upside), it's a caution flag. They've captured the $250→$302 rally and see risk/reward unfavorable.
-
📊 Gamma ceiling at $310 creates natural resistance: 15.0B call gamma at $310 (strongest overhead level) means market makers will systematically SELL into rallies above $305 to hedge exposure. This creates mechanical selling pressure making breakouts difficult. Would need sustained institutional buying to overcome. Current $302 price sitting at upper end of $300-305 consolidation zone.
-
🇨🇳 China competitive threat (long-term): SMIC gaining foundry share despite US restrictions; domestic demand resilient. While TSMC maintains massive technology lead (2nm vs SMIC's 7nm), Chinese government investing heavily in semiconductor self-sufficiency. Long-term (5-10 years) could erode TSMC's market share in China.
-
💰 AI CapEx cycle risk: HPC/AI now 57% of TSM revenue - massive concentration risk. If hyperscalers (Microsoft, Google, Meta, Amazon) signal ANY slowdown in 2026 AI infrastructure spending, TSM's growth narrative craters. Current valuation assumes AI CapEx boom continues unabated through 2026-2027.
-
⚡ Energy security concerns: Taiwan's last nuclear reactor decommissioned May 2025, exacerbating grid concerns. Power outages pushed reserve capacity below mandated thresholds. Semiconductor manufacturing is energy-intensive - ANY major grid disruptions impact production.
🎯 The Bottom Line
Real talk: Someone just cashed out $28 MILLION in winning TSM call options 16 days before the most anticipated semiconductor earnings of Q1 2026. This isn't bearish on TSM's long-term dominance - it's textbook profit-taking by institutions who've made MASSIVE money on the 43% YTD rally and don't want to risk giving it back on earnings volatility.
What this trade tells us:
- 🎯 Sophisticated player rode the entire rally from $250 to $302 and is LOCKING IN PROFITS at all-time highs
- 💰 They're banking $55.20 per contract rather than gambling on earnings potentially delivering $60-65 (limited upside) vs risk of decay to $45-50 (meaningful downside)
- ⚖️ The timing (16 days pre-earnings) shows they see asymmetric risk - potential gains don't justify holding through volatility
- 📊 Exit at $250 strike (deep ITM) represents full profit-taking after massive rally - they got EXACTLY what they wanted
- ⏰ February 20th expiration would capture Q4 earnings AND early N2 production feedback, but they're not waiting
This is NOT a "sell everything and run" signal - it's a "you've won, protect your gains" signal.
If you own TSM:
- ✅ Consider trimming 30-40% at $300-305 levels (lock in 40%+ YTD gains before earnings risk)
- 📊 If holding through earnings, set MENTAL STOP at $290 (major gamma support at 18.8B) to protect position
- ⏰ Don't get greedy - up 43% YTD is INCREDIBLE for a $1.56T mega-cap! Taking profits is smart portfolio management.
- 🎯 If earnings beat and stock rallies to $315-320, you still own 60-70% - you'll participate!
- 🛡️ Massive $300 gamma support (55.5B - largest level on map) should provide floor, but upside also limited by $310 resistance
If you're watching from sidelines:
- ⏰ Wednesday January 15th before market open (Tuesday evening US time) is the moment of truth - DO NOT enter before earnings!
- 🎯 Post-earnings pullback to $285-295 would be EXCELLENT entry (5-8% off highs with gamma support)
- 📈 Looking for confirmation of: N2 yields on track, CoWoS capacity ramp to 130K wafers/month by end 2026, 2026 CapEx guidance $42-45B+, gross margins 60%+
- 🚀 Longer-term (6-12 months), Arizona Fab expansion, N2P/A16 launches, and Nvidia Rubin production ramp are legitimate catalysts for $320-330+
- ⚠️ Current valuation (24.8x forward P/E) requires flawless execution AND no geopolitical shocks
If you're bearish:
- 🎯 Wait for earnings before initiating shorts - fighting 43% momentum into all-time highs is dangerous
- 📊 First major support at $300 (55.5B gamma wall), deeper support at $290 (18.8B gamma), extended floor at $280 (16.3B)
- ⚠️ Post-earnings put spreads ($305/$295 or $300/$290) offer defined-risk way to play consolidation after IV crush
- 📉 Watch for break below $300 - that's the trigger for potential cascade to $290, then $280
- ⏰ Timing is EVERYTHING: Premature bearish positioning risks getting steamrolled; post-earnings offers better risk/reward
Mark your calendar - Key dates:
- 📅 January 15 (Wednesday) before market open - Q4 FY2025 earnings report (16 DAYS!)
- 📅 January 16 (Thursday) - Post-earnings price action and analyst reactions (Monthly OPEX)
- 📅 February 20 - Expiration of this $28M call trade (Monthly OPEX)
- 📅 March 20 - Quarterly triple witch (±11.46% implied move window)
- 📅 H1 2026 (Apr-Jun) - N2P performance-enhanced 2nm volume production
- 📅 H2 2026 (Jul-Dec) - A16 backside power delivery production, Arizona Fab Phase 2 equipment installation
Final verdict: TSM's long-term competitive moat remains UNASSAILABLE - 72% foundry market share, exclusive volume 2nm production, pricing power with 3-10% increases locked for 2026, and irreplaceable role as AI chip manufacturer for the world. BUT, at $302 after 43% YTD gain with earnings in 16 days, the risk/reward is NO LONGER compelling for aggressive new positioning. The $28M institutional call exit is a CLEAR signal: smart money is banking profits at the peak.
Be patient. Let earnings clear. Look for pullback to $285-295 support. The AI revolution will still need TSM's chips in 2-3 months, and you'll get better risk/reward buying at $290 instead of $302.
This is a marathon, not a sprint. Protect your capital. 💪
Disclaimer: Options trading involves substantial risk of loss and is not suitable for all investors. This analysis is for educational purposes only and not financial advice. Past performance doesn't guarantee future results. The 1.24x Z-score reflects this specific trade's size relative to recent TSM history - it does not imply the trade represents a bearish view or that you should follow it. The seller may be taking profits on a long-held winning position for portfolio management reasons not applicable to retail traders. Always do your own research and consider consulting a licensed financial advisor before trading. Earnings create binary event risk with potential for 5-8% gaps either direction. Taiwan geopolitical risk represents ongoing overhang that could cause 10-20%+ declines on adverse developments regardless of fundamentals.
About Taiwan Semiconductor Manufacturing Company: Taiwan Semiconductor Manufacturing Company is the world's largest dedicated chip foundry with 72% market share, manufacturing advanced semiconductors for clients including Apple, Nvidia, and AMD across AI, mobile, automotive, and computing markets, with a market cap of $1.56 trillion in the Semiconductors - Foundry Services industry.