🐋 TSM $53M Deep ITM Call - Whale Bets BIG on Semiconductor Giant Post-Earnings! 🚀
📅 January 15, 2026 | 🔥 Unusual Activity Detected
🎯 The Quick Take
Someone just dropped $53 MILLION on deep in-the-money TSM calls right after TSMC crushed Q4 2025 earnings with record profits! This is NOT your average options trade - 8,500 contracts at the $290 strike with the stock trading at $349, meaning they paid $61.80 per contract (mostly intrinsic value) for February 20th expiration. Translation: An institutional player just deployed synthetic stock exposure worth over $850M notional to ride the AI chip wave through the next month. This trade has a Z-score of 2.73, classified as HIGHLY UNUSUAL - this level of conviction happens only a few times per year.
📊 Company Overview
Taiwan Semiconductor Manufacturing Company (TSM) is the undisputed king of chip manufacturing, controlling 71% of the global foundry market:
- Market Cap: $1.792 Trillion USD (7th most valuable company globally)
- Industry: Semiconductor Manufacturing - Contract Foundry Services
- Current Price: $349.18 (near 52-week high of $336.42)
- Primary Business: World's largest contract chip manufacturer producing semiconductors for Apple, Nvidia, AMD, Qualcomm, and virtually every major tech company
- Key Advantage: 2nm process technology leadership, advanced packaging (CoWoS), and irreplaceable position in AI chip supply chain
💰 The Option Flow Breakdown
The Tape (January 15, 2026 @ 12:19:11):
| Time | Symbol | Side | Buy/Sell | Type | Expiration | Premium | Strike | Volume | OI | Size | Spot | Option Price |
|---|---|---|---|---|---|---|---|---|---|---|---|---|
| 12:19:11 | TSM | MID | BUY | CALL $290 | 2026-02-20 | $53M | $290 | 8,700 | 36,000 | 8,500 | $349.18 | $61.80 |
🤓 What This Actually Means
This is a MASSIVE bullish position using deep in-the-money calls as synthetic stock. Let me break down what's happening:
- 💸 Premium paid: $53M ($61.80 per contract x 8,500 contracts)
- 📊 Deep ITM: Strike $290 vs Spot $349 = ~$59 intrinsic value already built in
- 🎯 Time premium: Only ~$2.80 in extrinsic value - minimal theta decay risk
- 📈 Delta exposure: ~0.95+ delta means 8,500 contracts control ~850,000 shares worth $297M at current prices
- ⚡ Leverage: $53M controls what would cost $297M in stock outright (5.6x leverage)
- 🏦 Vol/OI ratio: 0.242 shows moderate activity relative to existing positions
Why deep ITM calls instead of stock?
This is a classic institutional move for several reasons:
- Capital efficiency: Control $297M of stock exposure with only $53M tied up
- Limited downside: Maximum loss is the $53M premium (though that's still enormous!)
- Tax advantages: Options can offer different tax treatment than stock
- Conviction signal: Deep ITM calls are NOT for speculation - this is a high-conviction directional bet
- February expiration: 36 days to capture continued AI momentum without excessive time decay
Unusual Score: 🔥 HIGHLY UNUSUAL (Z-Score: 2.73) - This level of single-trade conviction in TSM happens only a few times per year. The combination of massive premium and strategic timing right after earnings is a clear signal of institutional confidence.
📈 Technical Setup / Chart Check-Up
YTD Performance Chart
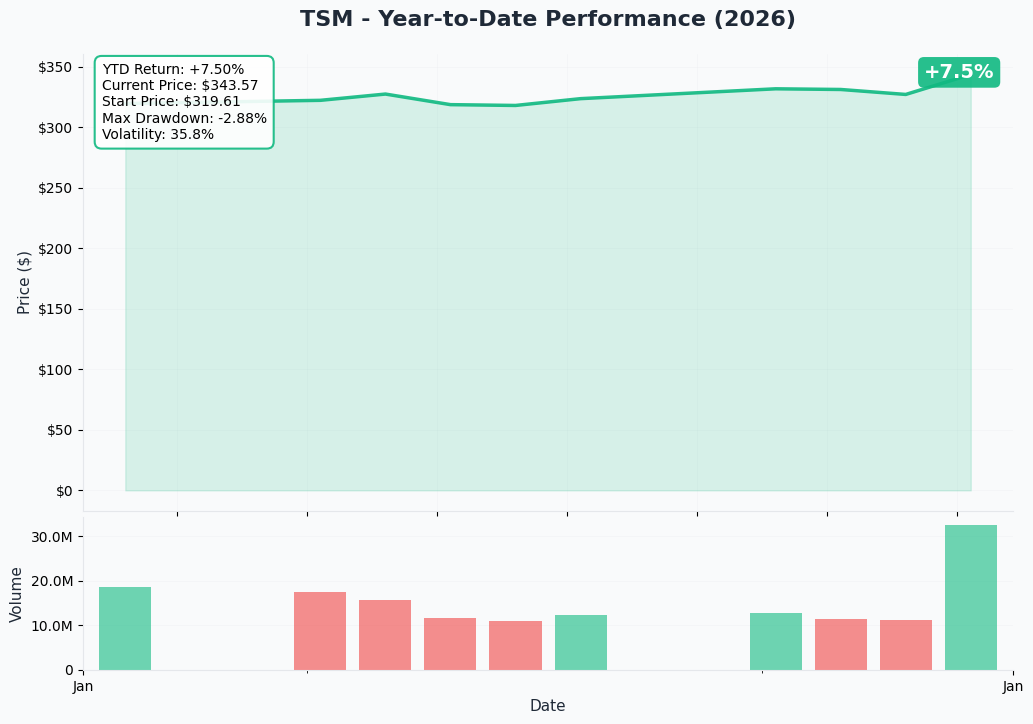
TSM has been on an absolute tear - up +58.18% YTD from $206.80 last January to current levels around $349. The chart tells the story of AI infrastructure spending in full force. After consolidating around $200-220 in early 2025, the stock broke out decisively and has barely looked back.
Key observations:
- 🚀 Strong uptrend: Consistent higher highs and higher lows throughout 2025
- 📈 Breakout confirmed: Smashed through $300 psychological resistance in Q4
- 🎢 Momentum intact: Recent earnings beat providing fresh fuel for the rally
- 📊 Volume confirmation: Heavy institutional buying on up days
- ⚠️ Extended territory: Trading near all-time highs requires continued earnings execution
Gamma-Based Support & Resistance Analysis
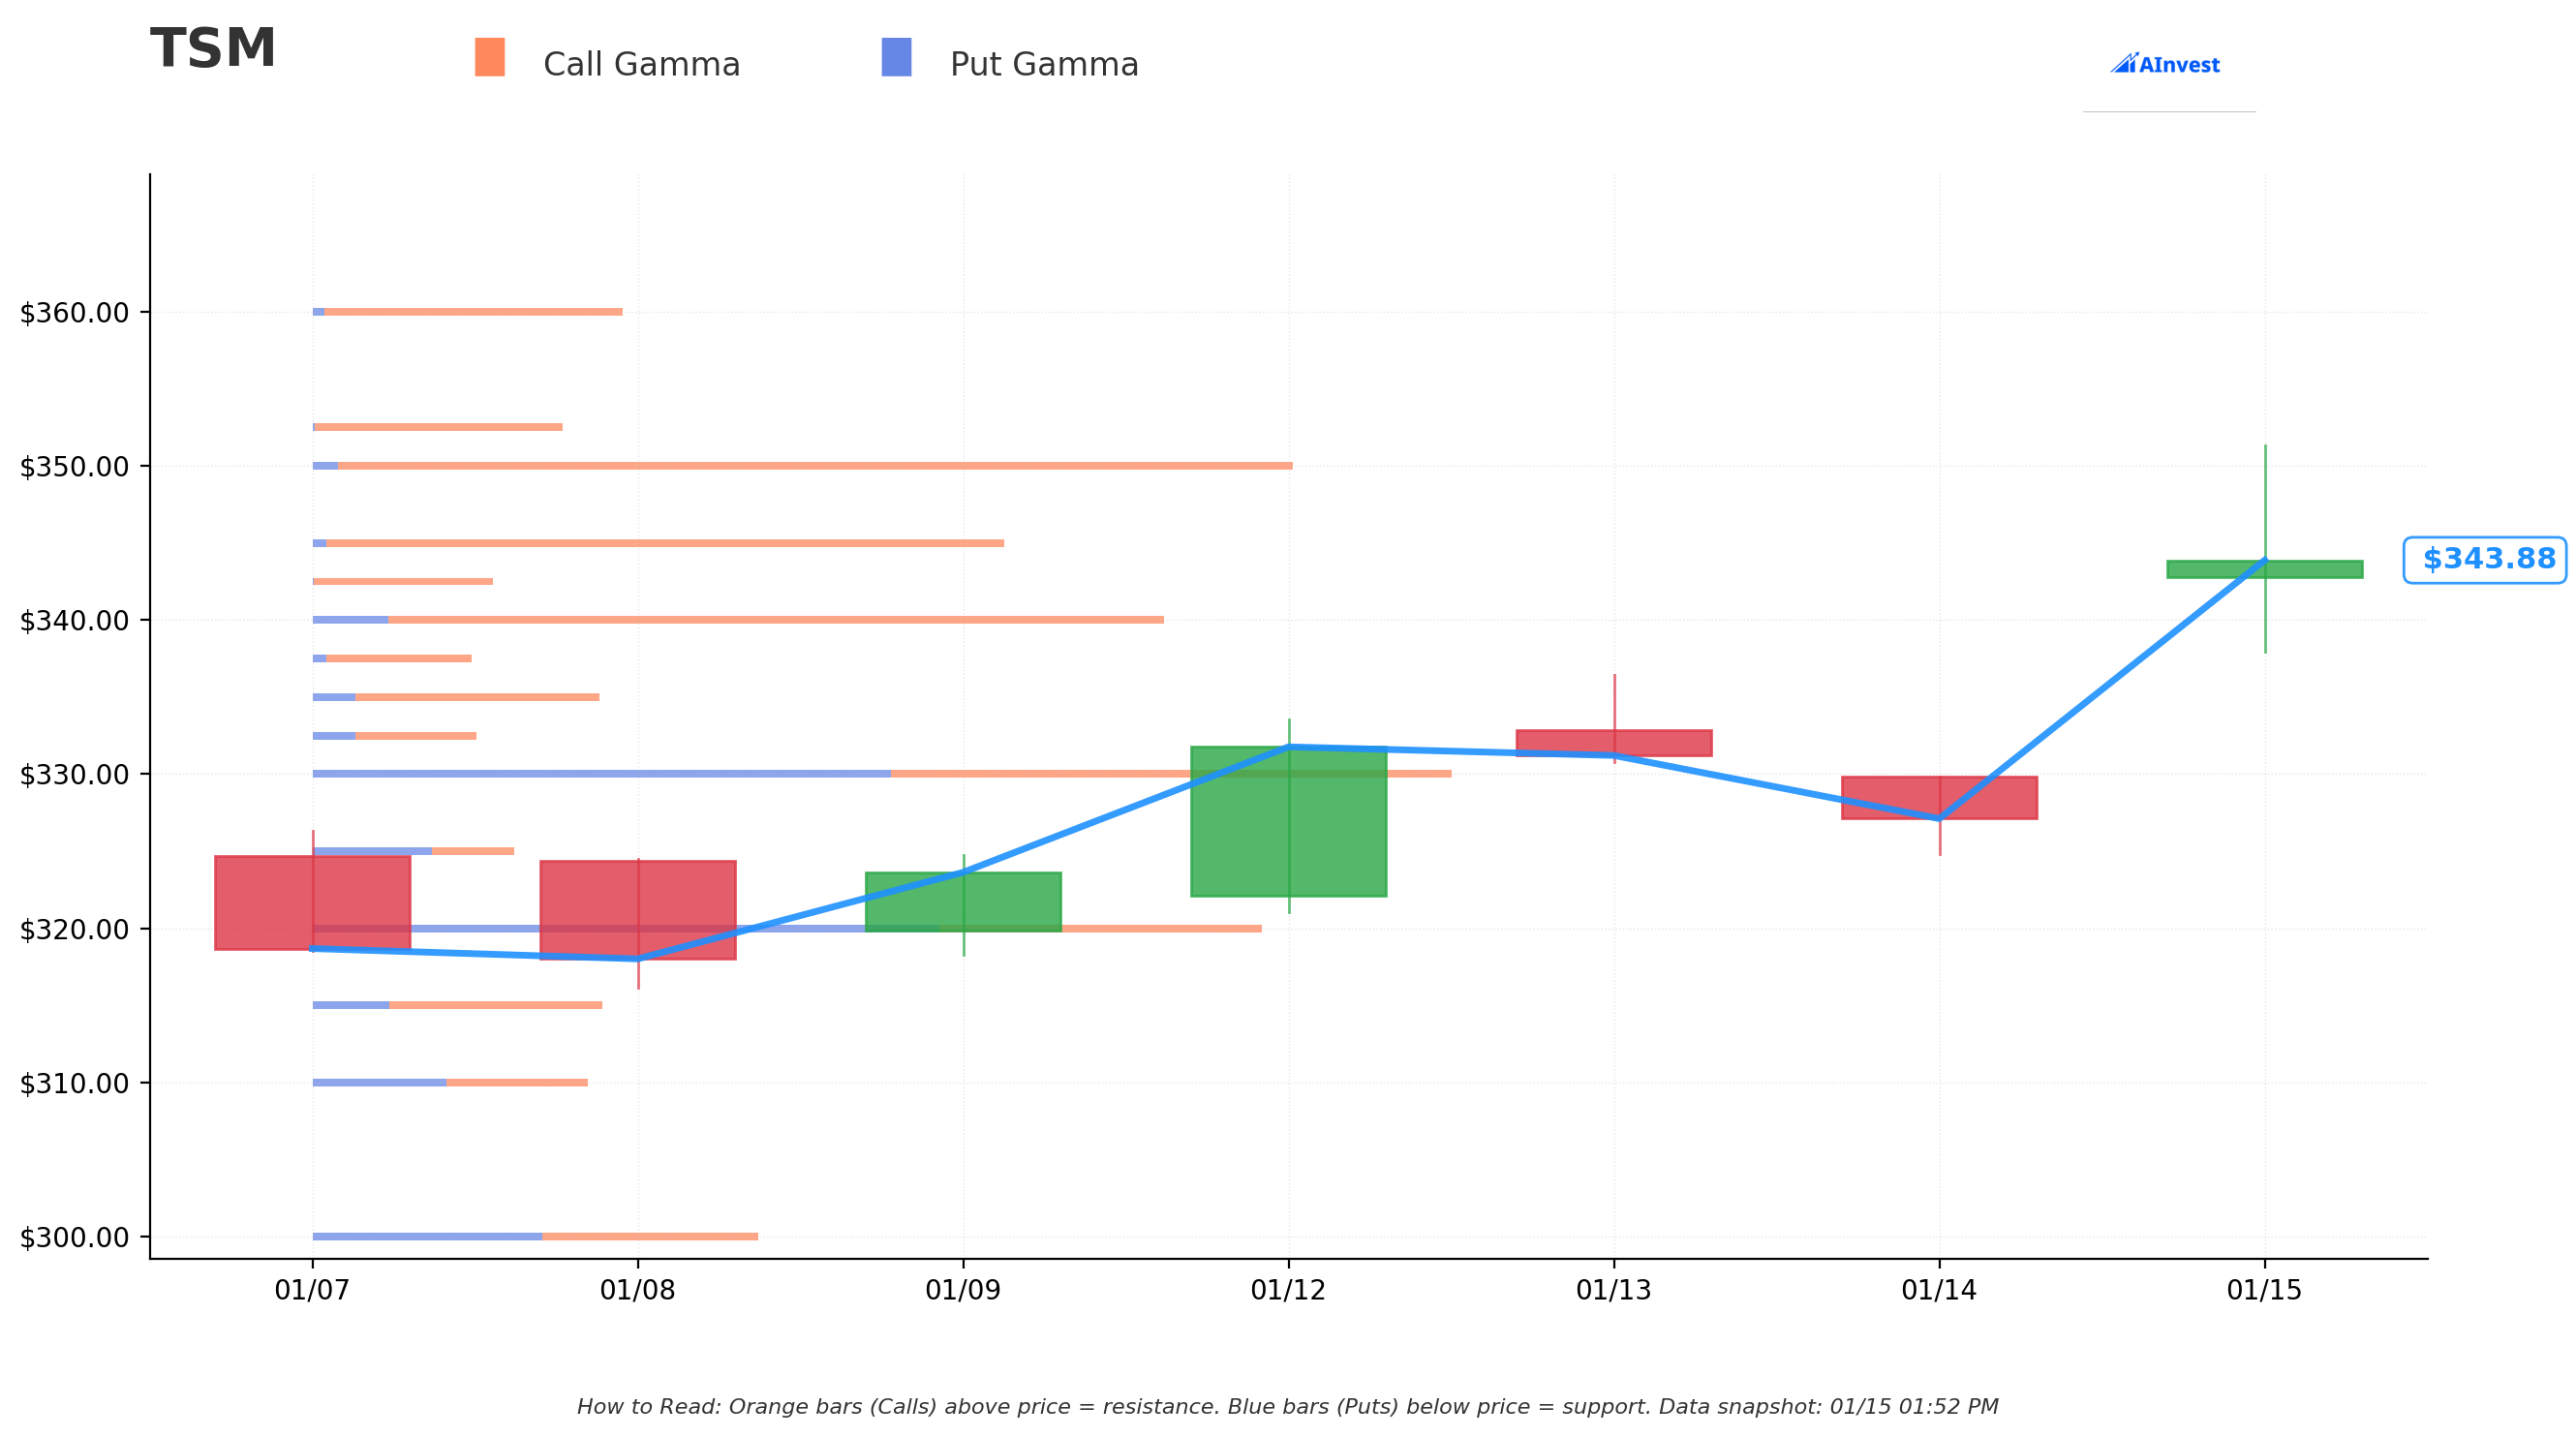
Current Price: $343.84
The gamma exposure map reveals critical price magnets that will govern near-term price action:
🔵 Support Levels (Put Gamma Below Price):
- $340 - Strongest immediate support with 16.4B total gamma exposure (1.1% below current)
- $335 - Secondary support at 5.6B gamma (2.6% below current)
- $330 - Major structural floor with 22.8B gamma - heavy open interest concentration
- $320 - Deep support at 18.4B gamma (6.9% below current)
- $310 - Extended floor at 5.4B gamma
- $300 - Psychological support with 8.7B gamma
- $290 - THIS TRADE'S STRIKE! 7.1B gamma here (15.7% below current)
🟠 Resistance Levels (Call Gamma Above Price):
- $345 - Immediate ceiling with 13.7B gamma (0.3% overhead)
- $350 - Major resistance at 19.3B gamma - round number psychological level
- $360 - Extended resistance at 6.0B gamma (4.7% above current)
What this means for traders: TSM is trading just below immediate resistance at $345, with the massive $350 gamma wall looming overhead. The net GEX bias is Bullish (126.9B call gamma vs 60.7B put gamma), meaning market makers are positioned for continued upside. The $340 support level is the immediate floor if we see profit-taking.
Notice the strike selection: The $290 call buyer is positioned well below all major support levels - they're essentially getting stock-like exposure without the risk of a 15%+ crash taking them underwater. Even if TSM pulls back to $320, their calls still have significant intrinsic value.
Implied Move Analysis
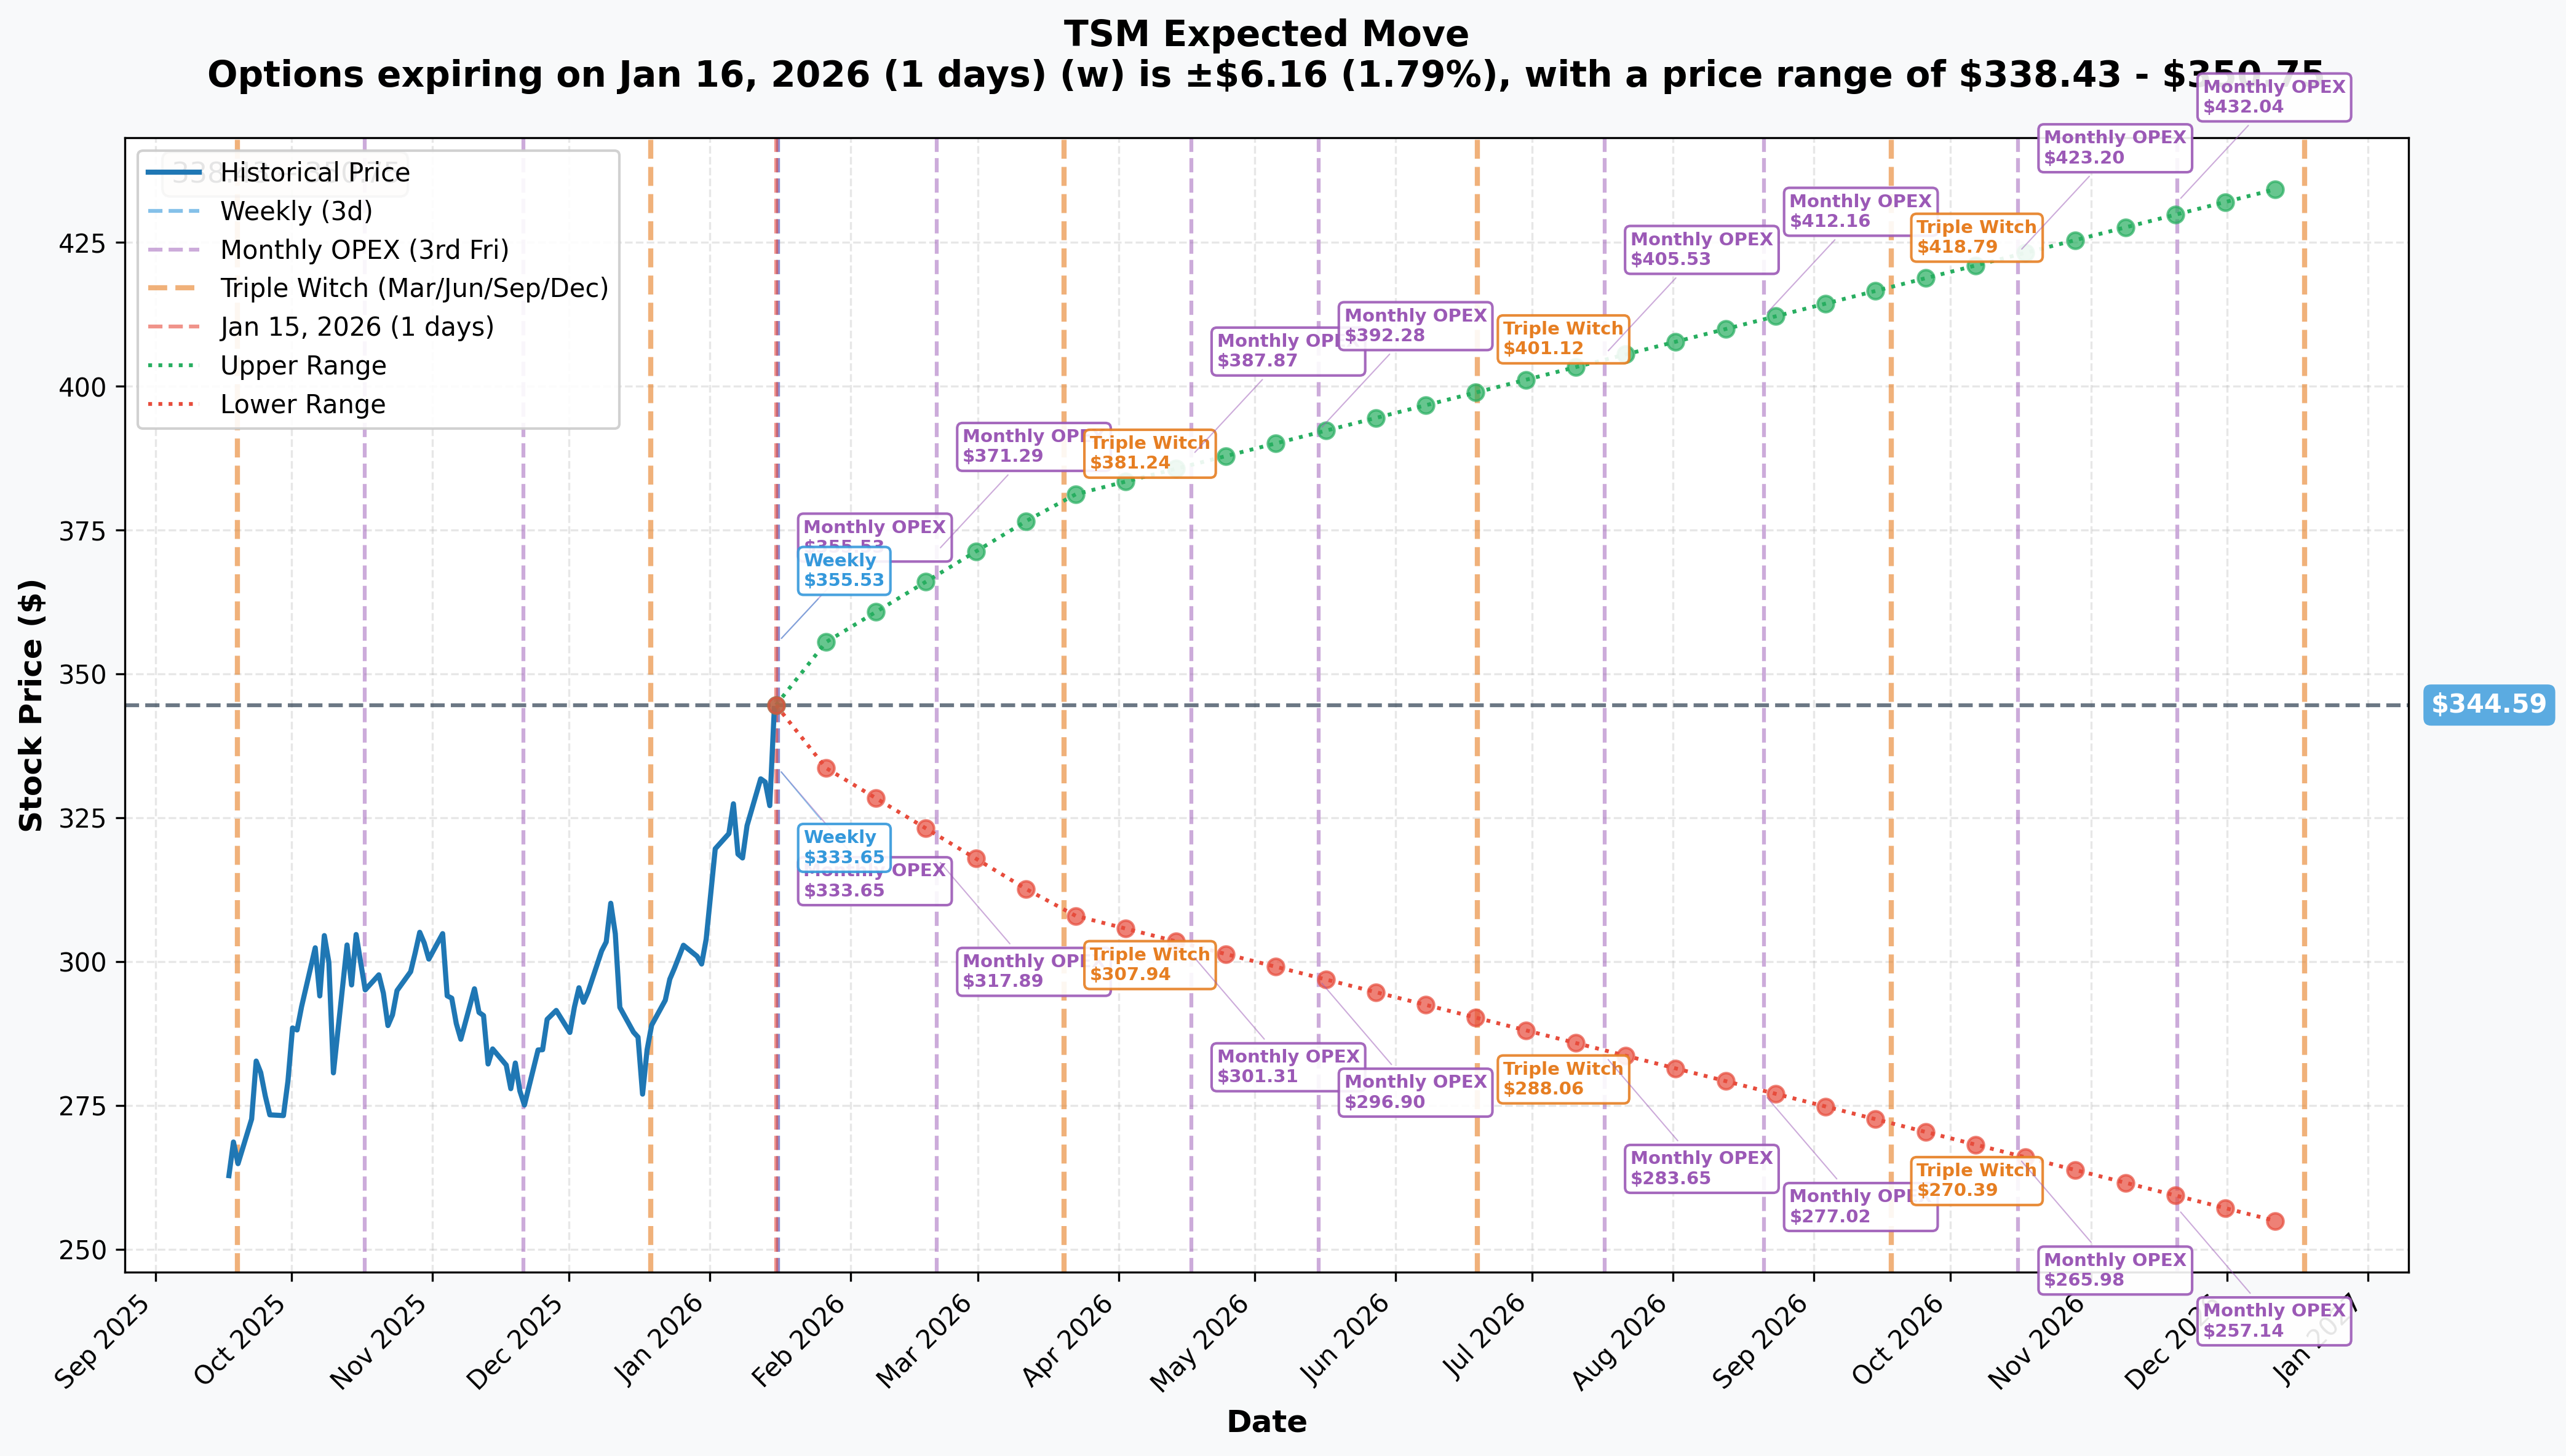
Options market pricing for upcoming expirations:
- 📅 Weekly (Jan 16 - 1 day): +/-$6.16 (+/-1.79%) -> Range: $338.43 - $350.75
- 📅 February OPEX (Feb 20 - THIS TRADE!): +/-$26.70 (+/-7.75%) -> Range: $317.89 - $371.29
- 📅 Quarterly Triple Witch (Mar 20): +/-$36.25 (+/-10.52%) -> Range: $308.34 - $380.84
- 📅 Yearly LEAPS (Dec 18): +/-$91.06 (+/-26.42%) -> Range: $253.53 - $435.65
Translation for regular folks: Options traders are pricing in a 7.75% potential move (~$27) by February 20th - the exact expiration of this $53M trade. The upper range of $371.29 suggests potential for another 6%+ rally, while the lower range of $317.89 is well above the $290 strike, giving this trade a massive cushion.
Key insight: The February implied range ($317.89 - $371.29) shows this $290 call has a high probability of remaining deep in-the-money at expiration. The trader is essentially betting TSM stays above $290 while capturing any continued upside with leveraged exposure.
🎪 Catalysts
🔥 Just Happened - Q4 2025 Earnings (Today - January 15, 2026)
TSMC just delivered a BLOCKBUSTER quarter that exceeded guidance across every metric:
Financial Highlights:
- 📊 Revenue: NT$1,046B ($33.73B USD), up 20.5% YoY - exceeding guidance of $32.2-33.4B
- 💰 Net Income: NT$505.74B, up 35% YoY to a new quarterly record
- 📈 Gross Margin: 62.3%, up 2.8 percentage points sequentially
- 🏭 Operating Margin: 54%, up 3.4 percentage points sequentially
- 🤖 HPC Revenue: 55% of total - AI chips driving the majority of growth
Full Year 2025:
- Total revenue of NT$3,809B, up 31.6% YoY
- Advanced nodes (7nm and below) contributed 74% of full-year revenue
This $53M call trade happened AFTER earnings - the buyer saw the results and decided to pile in. That's serious conviction!
🚀 Upcoming Catalysts (Next 6 Months)
2nm Mass Production Ramp - Throughout 2026
TSMC's 2nm production expansion represents the most significant catalyst for 2026:
- 🏭 Current capacity: ~35,000-40,000 wafers/month
- 🎯 End of 2026 target: 80,000-100,000 wafers/month
- 📊 2nm revenue projected to surpass cumulative 3nm and 5nm revenue by Q3 2026
- 💪 All 2026 capacity already fully booked - Apple securing >50% of initial allocation
Q1 2026 Guidance - Strong Forward Outlook
Management provided robust Q1 2026 guidance during today's earnings call:
- 📈 Revenue: $34.6-35.8B (4% sequential increase, 38% YoY growth)
- 💰 Gross Margin: 63-65% - further expansion expected
- 🤖 CEO C.C. Wei stated: "We believe the AI is real. Not only real, it is starting to grow into our daily life."
Full Year 2026 Outlook
- 📊 Revenue Growth: ~30% in USD terms, above Street consensus of 25%
- 💸 Capital Expenditure: $52-56B, up from $40.9B in 2025
- 🎯 70-80% of capex allocated to advanced technologies
Arizona Fab Acceleration
TSMC announced accelerated timelines for Arizona:
- 🇺🇸 Fab 21 Phase 2 equipment installation: Q3 2026 (ahead of schedule)
- 📅 3nm production targeted 2027 instead of 2028
- 🏭 Plans for up to 12 fabs in Arizona forming a "gigafab cluster"
CoWoS Advanced Packaging Expansion
- 🔧 End 2026 target: ~130,000 wafers/month
- 🎯 Nvidia commanding >60% of 2026 CoWoS capacity
Analyst Price Target Increases
Following Q4 results, multiple analysts raised targets:
- 🎯 Needham: $410 (Street High) - 25.3% upside
- 🎯 Susquehanna: $400 - 22.3% upside
- 🎯 Goldman Sachs: NT$2,600 (~12% upside)
- 🎯 Citi: $388 - 18.8% upside
🎲 Price Targets & Probabilities
Using gamma levels, implied move data, and the Q4 earnings beat, here are the scenarios through February 20th expiration:
📈 Bull Case (40% probability)
Target: $370-$400
How we get there:
- 💪 Q1 2026 revenue comes in above $35.8B high-end guidance
- 🚀 2nm production ramp exceeds expectations with strong Apple/Nvidia orders
- 🤖 AI demand remains insatiable - Nvidia Blackwell and Rubin demand continues accelerating
- 📊 Gross margins expand toward 65% as advanced nodes scale
- 🇺🇸 Arizona fab progress announcements boost U.S. investor confidence
- 📈 Breakout above $350 gamma resistance triggers technical rally to $370-380
- 🎯 Street price targets catch up to $410 Needham call
The $53M call position P&L:
- Stock at $380: Calls worth $90, profit = $28.20/contract x 8,500 = $24M gain (45% ROI)
- Stock at $400: Calls worth $110, profit = $48.20/contract x 8,500 = $41M gain (77% ROI)
Why 40% probability: Post-earnings momentum is real, guidance is strong, and AI demand shows no signs of slowing. The compressed implied move suggests the market may be underestimating upside potential.
🎯 Base Case (45% probability)
Target: $340-$370 range (CONSOLIDATION)
Most likely scenario:
- ✅ TSM digests Q4 earnings beat and consolidates gains
- 📊 Stock trades between gamma support ($340) and resistance ($350-360)
- 🤖 AI demand remains strong but no major positive surprises
- ⚖️ Market awaits Q1 2026 results for next catalyst (mid-April)
- 🔄 Trading range-bound as investors process the massive 2025 gains
- 📈 Implied volatility slowly declines as time decay works against options
The $53M call position P&L:
- Stock at $350: Calls worth $60, loss = -$1.80/contract x 8,500 = $15.3M loss (29% loss on time value)
- Stock at $360: Calls worth $70, profit = $8.20/contract x 8,500 = $7M gain (13% ROI)
Why 45% probability: This is the put buyer's "acceptable" scenario - stock consolidates after a massive run, calls retain most intrinsic value, and position can be rolled or adjusted as needed.
📉 Bear Case (15% probability)
Target: $300-$340
What could go wrong:
- 😰 Broader market selloff drags semiconductors lower
- 🇨🇳 China tensions escalate - Taiwan geopolitical risk premium increases
- ⏰ 2nm yield issues emerge, delaying production ramp
- 🤖 AI spending slows faster than expected (bubble concerns)
- 📉 Break below $340 gamma support triggers cascade to $330, then $320
- 💸 Profit-taking after 58% YTD gains accelerates
Critical support levels:
- 🛡️ $340: Strongest immediate support (16.4B gamma) - MUST HOLD
- 🛡️ $330: Major floor with 22.8B gamma concentration
- 🛡️ $320: Extended support at 18.4B gamma
- 🛡️ $290: This call's strike - 7.1B gamma
The $53M call position P&L:
- Stock at $320: Calls worth $30, loss = -$31.80/contract x 8,500 = $27M loss (51% loss)
- Stock at $300: Calls worth $10, loss = -$51.80/contract x 8,500 = $44M loss (83% loss)
- Stock at $290: Calls worth ~$2-3, loss = ~-$59/contract x 8,500 = $50M loss (94% loss)
Why only 15% probability: Q4 earnings exceeded all expectations, guidance is strong, AI demand is verified, and there's no near-term catalyst for a major pullback. However, geopolitical risk is always present with Taiwan.
💡 Trading Ideas
🛡️ Conservative: Buy Stock on Pullback to $340
Play: Wait for pullback to gamma support and buy shares
Why this works:
- 📊 $340 is the strongest gamma support level - dealers will defend this
- 💰 5-6% discount from current levels provides margin of safety
- 🎯 Post-earnings consolidation is normal after strong beats
- ⏰ Q1 2026 earnings (April) provides next catalyst for re-acceleration
- 🛡️ Stop-loss at $330 limits downside to ~3% from entry
- 📈 Target $370-380 for 9-12% gain potential
Entry criteria:
- 👀 Wait for stock to pull back to $340-345 range
- ✅ Confirm $340 support holds with buying volume
- 📊 Look for RSI to cool from overbought levels
Position sizing: 5-10% of portfolio max
Risk level: Low | Skill level: Beginner-friendly
⚖️ Balanced: February Call Spread Copying The Whale
Play: Buy $350/$380 call spread expiring February 20th
Structure: Buy $350 calls, Sell $380 calls (February 20 expiration - SAME as the $53M trade)
Why this works:
- 🎯 Targets the same expiration as institutional flow
- 📊 Defined risk spread ($30 wide = $3,000 max risk per spread)
- 💰 Cheaper than buying stock or single calls
- 🤝 Aligns with the whale's bullish thesis but with defined risk
- ⏰ 36 days to expiration captures continued post-earnings momentum
- 📈 Benefits from breakout above $350 resistance
Estimated P&L:
- 💰 Cost: ~$8-10 net debit per spread
- 📈 Max profit: $20-22 per spread if TSM above $380 at expiration (100-150% ROI)
- 📉 Max loss: $8-10 per spread if TSM below $350 at expiration
- 🎯 Breakeven: ~$358-360
Position sizing: Risk only 2-5% of portfolio
Risk level: Moderate | Skill level: Intermediate
🚀 Aggressive: Follow The Whale with Smaller Size
Play: Buy February $320 calls (slightly less deep ITM for better leverage)
Structure: Buy $320 calls expiring February 20th
Why this could work:
- 🐋 Directly following institutional conviction - they just bet $53M
- 📊 $320 strike provides ~$29 intrinsic value (less capital tied up than $290 calls)
- 💪 Still deep ITM with high delta (~0.90) for stock-like exposure
- 📈 Benefits from any continued rally with leverage
- 🎯 Breakeven around $358-365 depending on entry price
Why this could hurt:
- 💸 Deep ITM calls still expensive (~$35-40 per contract)
- ⏰ Only 36 days to expiration - limited time for thesis to play out
- 📉 If stock pulls back to $320, lose significant premium
- 🎢 Less margin of safety than the whale's $290 strike
Estimated P&L:
- 💰 Cost: ~$35-40 per contract
- 📈 Stock at $380: Calls worth ~$60, profit = $20-25/contract (50-70% ROI)
- 📉 Stock at $330: Calls worth ~$15, loss = $20-25/contract (50-60% loss)
CRITICAL WARNING - DO NOT attempt unless you:
- ✅ Can afford to lose entire premium
- ✅ Understand deep ITM call mechanics
- ✅ Have conviction in post-earnings momentum continuing
- ✅ Can monitor position and exit if thesis breaks down
Risk level: HIGH | Skill level: Advanced
⚠️ Risk Factors
Don't get caught by these potential landmines:
-
🇹🇼 Geopolitical risk remains real: Taiwan Strait tensions could escalate at any time. Chinese military activities around Taiwan are increasingly frequent. Even without conflict, headline risk can trigger 10%+ drawdowns overnight. TSMC produces ~90% of the world's most sophisticated chips - any supply disruption would be catastrophic globally.
-
📊 Valuation is stretched: At 32.8x trailing P/E and 25.8x forward P/E after 58% YTD gains, TSM is priced for continued flawless execution. The market expects 30% revenue growth in 2026 - any disappointment could trigger significant multiple compression.
-
🤖 AI spending sustainability questions: While current demand is strong, questions remain about AI spending sustainability beyond 2026. If hyperscalers pull back on capex, TSMC would feel the impact quickly.
-
💾 Memory inflation could pressure margins: Memory inflation (HBM driving 55-60% DRAM price increases) could pressure smartphone segment demand (32% of revenue) as device costs rise.
-
🏭 2nm execution risk: While 2nm is ramping, yields must meet customer expectations at scale. Any production issues could delay the revenue trajectory.
-
🇨🇳 China export uncertainty: The U.S. export license for TSMC's China operations requires annual renewal. Policy changes could impact ~2.4% of revenue.
-
📉 Customer concentration: Nvidia is emerging as TSMC's largest customer at ~20% of revenue, while Apple's share is declining to ~16%. Heavy dependence on AI chip demand creates cyclical risk.
🎯 The Bottom Line
Real talk: A sophisticated institutional player just deployed $53 MILLION into deep ITM TSM calls immediately after TSMC delivered a record-breaking Q4 earnings report. This isn't speculation - this is a high-conviction bet that the AI infrastructure buildout continues through February.
What this trade tells us:
- 🎯 The buyer has EXTREME confidence in TSM staying above $290 (16% below current price)
- 💰 They're paying ~$62 per share for exposure to potentially $350-400 upside
- ⚖️ Deep ITM calls provide stock-like exposure with limited downside (max loss = $53M premium)
- 📊 The Z-score of 2.73 (HIGHLY UNUSUAL) means this level of conviction is rare
- ⏰ February expiration captures post-earnings momentum without excessive time decay
This IS a "buy the earnings beat" signal - smart money is leaning in.
If you want exposure to TSM:
- ✅ Consider waiting for a 3-5% pullback to $340 gamma support for better entry
- 📊 February call spreads offer defined-risk way to participate
- ⏰ Don't chase at all-time highs - be patient for dips
- 🎯 Target $370-380 for February, $400+ by mid-year if execution continues
If you already own TSM:
- ✅ HOLD - earnings beat validates thesis
- 📊 Consider selling covered calls at $380 to generate income
- 🛡️ Set mental stop at $330 gamma support to protect gains
- 📈 Add on pullbacks to $340
If you're watching from sidelines:
- 🎯 Q4 earnings remove near-term uncertainty
- 📊 Wait for consolidation to $340-350 range for entry
- ⏰ Q1 2026 earnings (April) is next major catalyst
- 🚀 Long-term thesis (2nm ramp, AI demand, Arizona expansion) remains compelling
Mark your calendar - Key dates:
- 📅 February 20, 2026 - Expiration of this $53M call trade
- 📅 Mid-April 2026 - Q1 2026 earnings release
- 📅 Q2-Q3 2026 - 2nm revenue acceleration expected
- 📅 Q3 2026 - Arizona Fab 21 Phase 2 equipment installation
- 📅 Mid-July 2026 - Q2 2026 earnings release
Final verdict: TSMC just proved it's the irreplaceable backbone of the AI revolution. With 71% foundry market share, 2nm technology leadership, fully booked capacity through 2026, and projected 30% revenue growth, the fundamental story has never been stronger. The $53M institutional call buy right after earnings is a clear signal: smart money believes the run isn't over.
At current prices, wait for pullbacks to build positions. The AI infrastructure buildout is a multi-year theme, and TSMC sits at the center of it all.
The whale saw the earnings, crunched the numbers, and bet $53M that TSM keeps climbing. Are you paying attention? 💪
Disclaimer: Options trading involves substantial risk of loss and is not suitable for all investors. This analysis is for educational purposes only and not financial advice. Past performance doesn't guarantee future results. The Z-score of 2.73 reflects this trade's unusual size relative to recent TSM history - it does not imply the trade will be profitable. Taiwan Semiconductor operates in a geopolitically sensitive region with material tail risks that cannot be hedged. Always do your own research and consider consulting a licensed financial advisor before trading. Deep ITM calls still carry significant capital at risk.
About Taiwan Semiconductor Manufacturing Company: TSMC is the world's largest dedicated semiconductor foundry, manufacturing chips designed by fabless semiconductor companies including Apple, Nvidia, AMD, Qualcomm, and Broadcom. With a market cap of $1.79 trillion, TSMC commands 71% of the global foundry market and leads the industry in advanced process technology (2nm, 3nm) and advanced packaging (CoWoS).