TSM Unusual Options Activity Analysis
February 10, 2026
Executive Summary
$18 million bullish LEAP bet detected on Taiwan Semiconductor (TSM) targeting 23.5% upside by January 2027. A single institutional buyer purchased 5,000 January 2027 $450 calls at $35.35, creating a new position that exceeds existing open interest. This aggressive long-dated bet on the world's dominant semiconductor foundry aligns with TSMC's structural AI tailwinds, fully-booked 2nm capacity, and record capex program. The 11-month timeframe provides optionality through multiple earnings catalysts and the 2nm production ramp.
| Key Metric | Value |
|---|---|
| Premium Deployed | $18,000,000 |
| Strategy | Long Call (LEAP) |
| Breakeven | $485.35 (+33.2% from spot) |
| Max Profit | Unlimited |
| Max Loss | $18M (premium paid) |
| Days to Expiry | ~340 days |
Company Overview
| Attribute | Details |
|---|---|
| Company | Taiwan Semiconductor Manufacturing Company Ltd. |
| Ticker | TSM |
| Sector | Semiconductors (Foundry) |
| Market Cap | $1.84 Trillion |
| Employees | 83,825 |
| Market Share | 71-75% of global foundry |
| Key Customers | NVIDIA, Apple, AMD, Qualcomm, Broadcom |
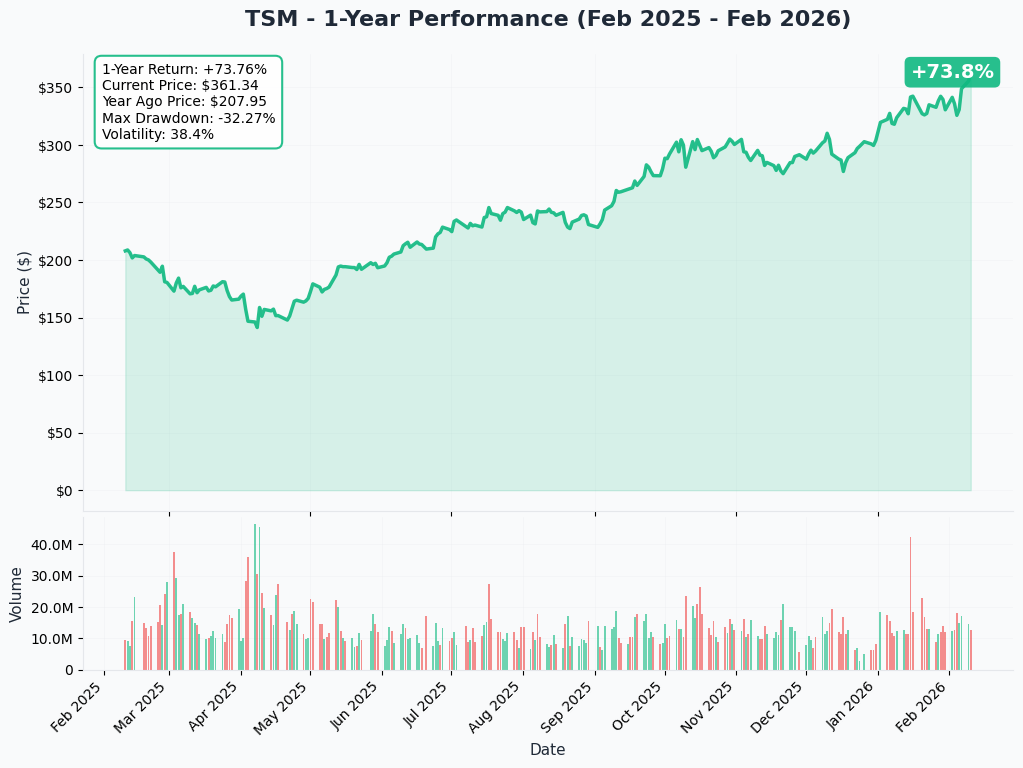
TSMC is the world's largest dedicated semiconductor foundry, controlling approximately 70-75% of the global advanced chip manufacturing market. The company's technological leadership at the 2nm node and dominance in advanced packaging (CoWoS) have made it the indispensable manufacturing partner for AI chip leaders including NVIDIA and AMD.
Trade Details
Flow Data
| Field | Value |
|---|---|
| Date | February 10, 2026 |
| Time | 14:13:03 ET |
| Symbol | TSM |
| Direction | BUY |
| Type | CALL |
| Expiration | January 15, 2027 |
| Strike | $450 |
| Premium | $18,000,000 |
| Contracts | 5,000 |
| Option Price | $35.35 |
| Spot Price | $364.26 |
| Volume | 5,000 |
| Open Interest | 4,600 |
| Vol/OI Ratio | 1.087 |
Option Contract: TSM20270115C450
Position Characteristics
| Metric | Value | Interpretation |
|---|---|---|
| Strike Distance | +23.5% OTM | Aggressive bullish conviction |
| Time to Expiry | ~340 days | LEAP position, patient capital |
| Vol/OI > 1 | 1.087x | New position opening |
| Premium Size | $18M | Institutional-scale bet |
| Delta (est.) | ~0.35-0.40 | Moderate directional exposure |
| Gamma Profile | Low | Limited near-term sensitivity |
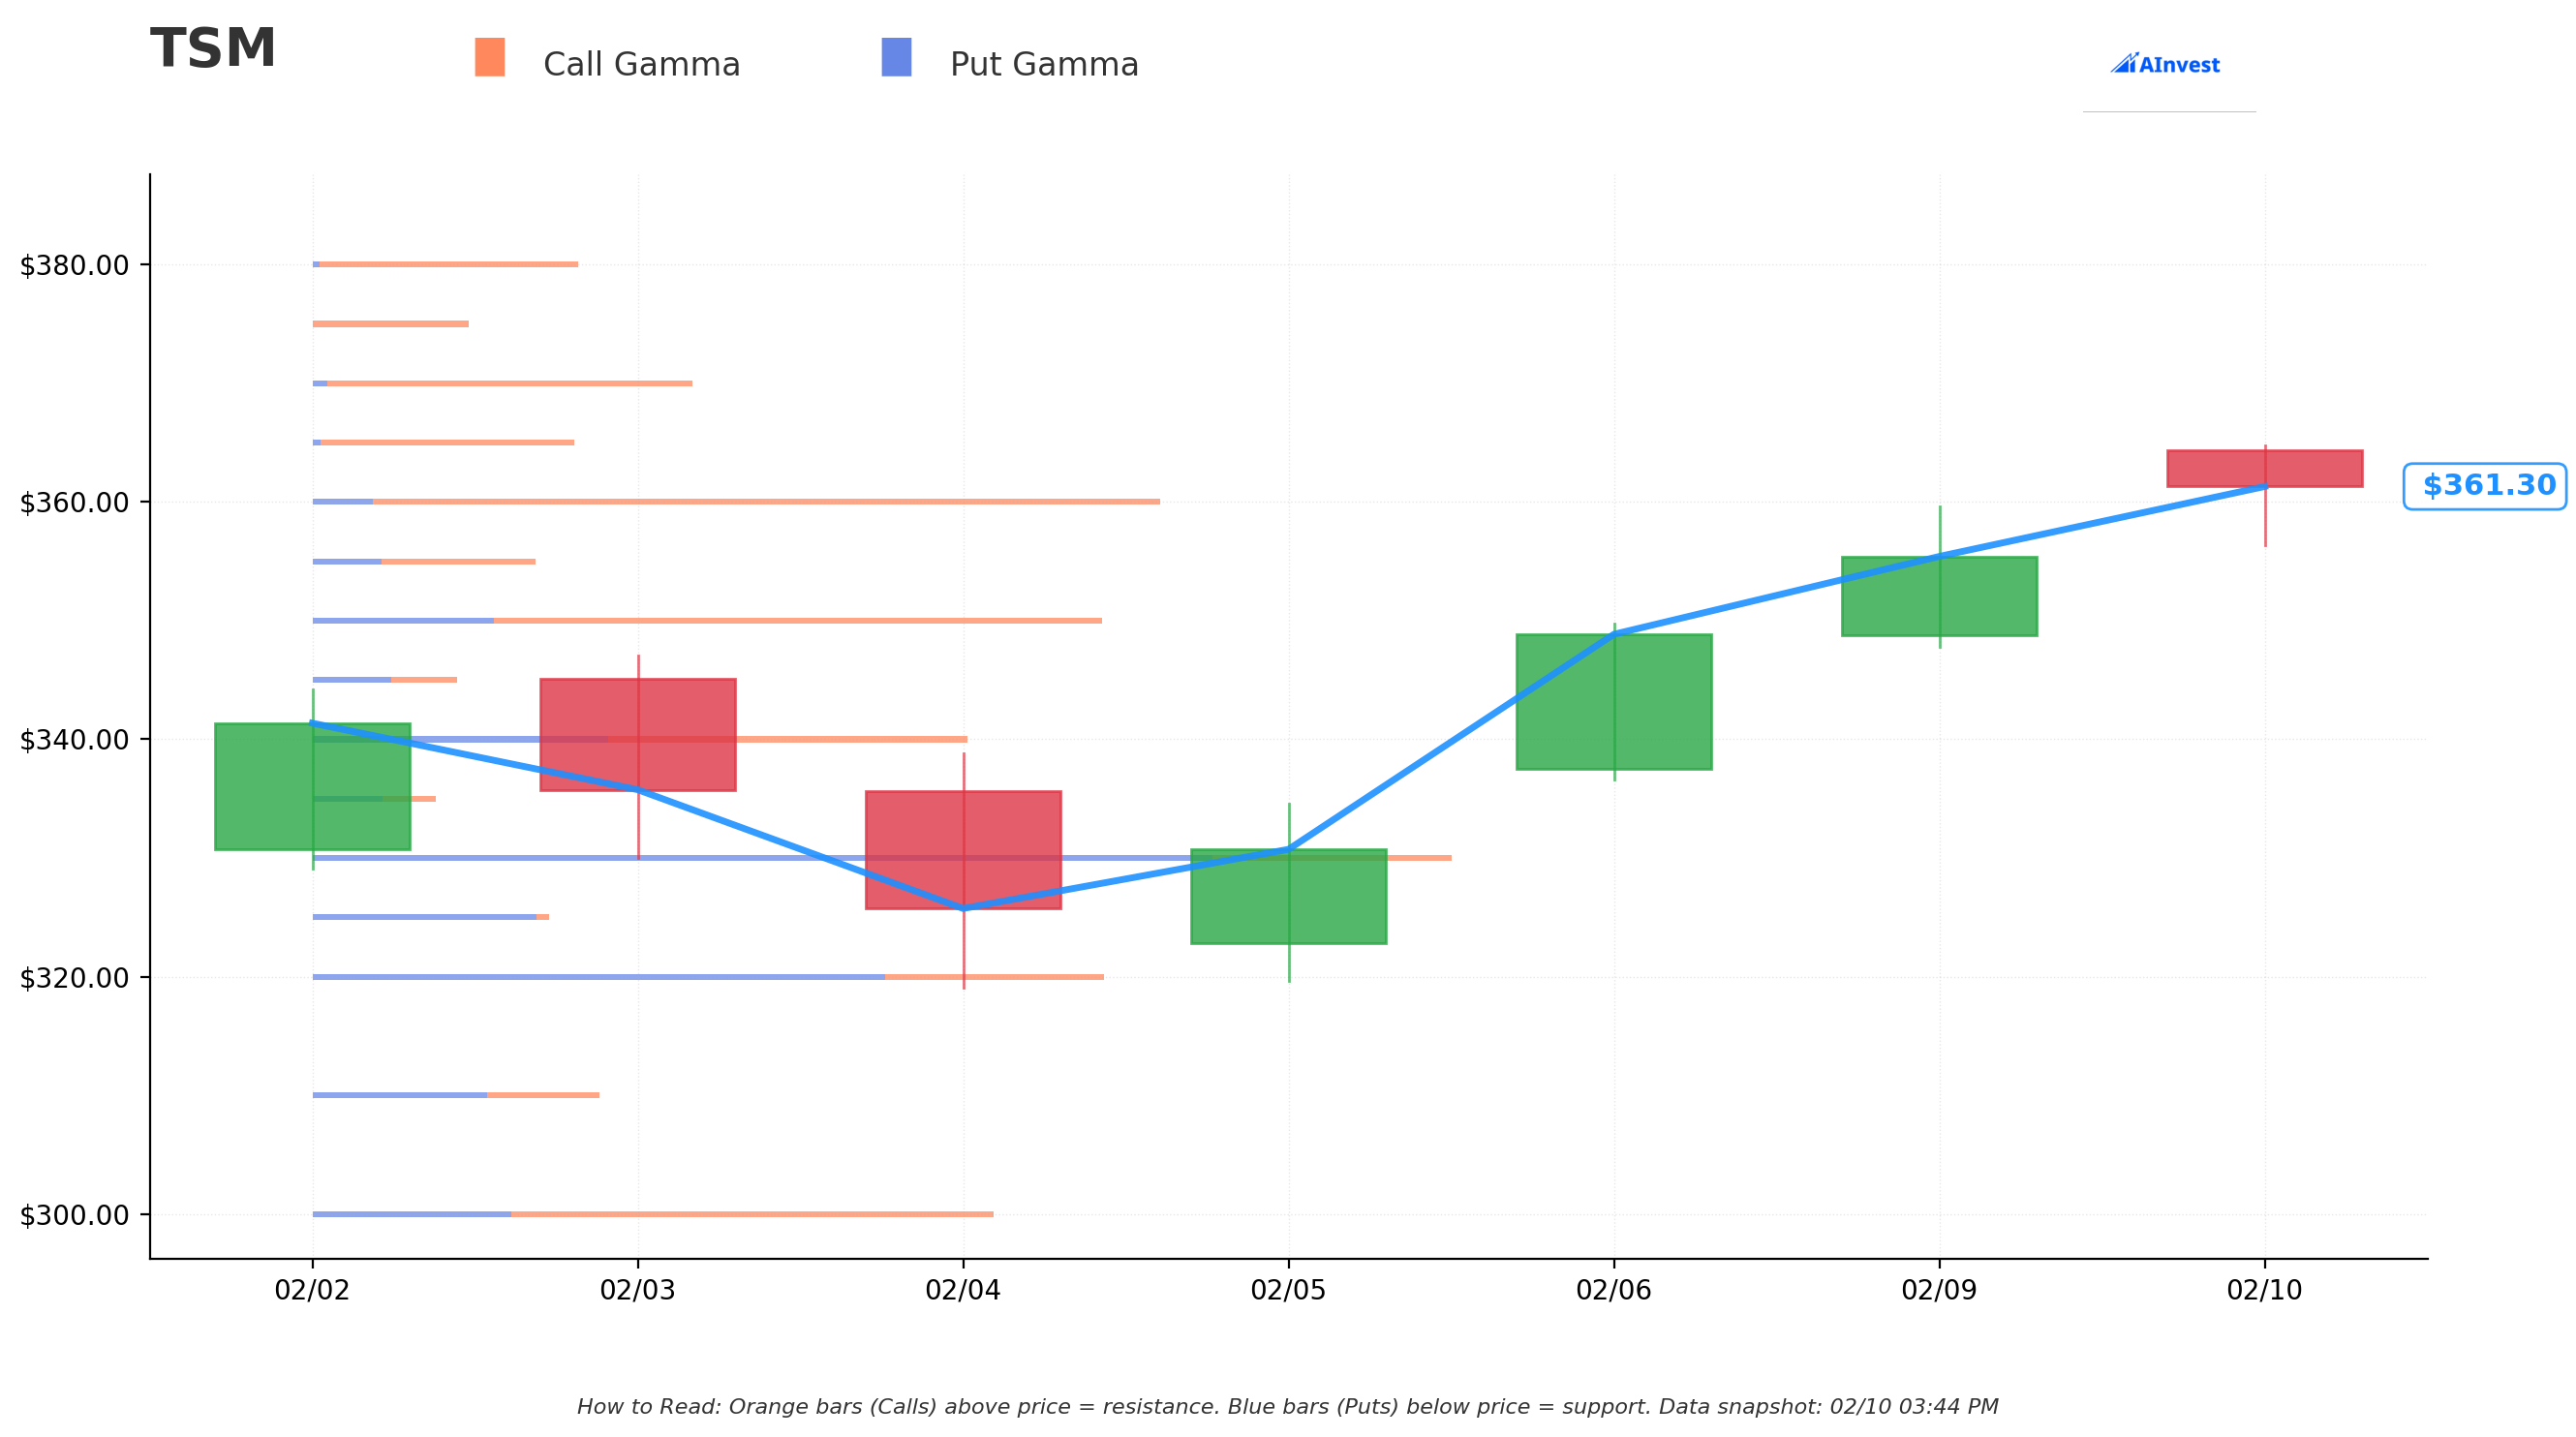
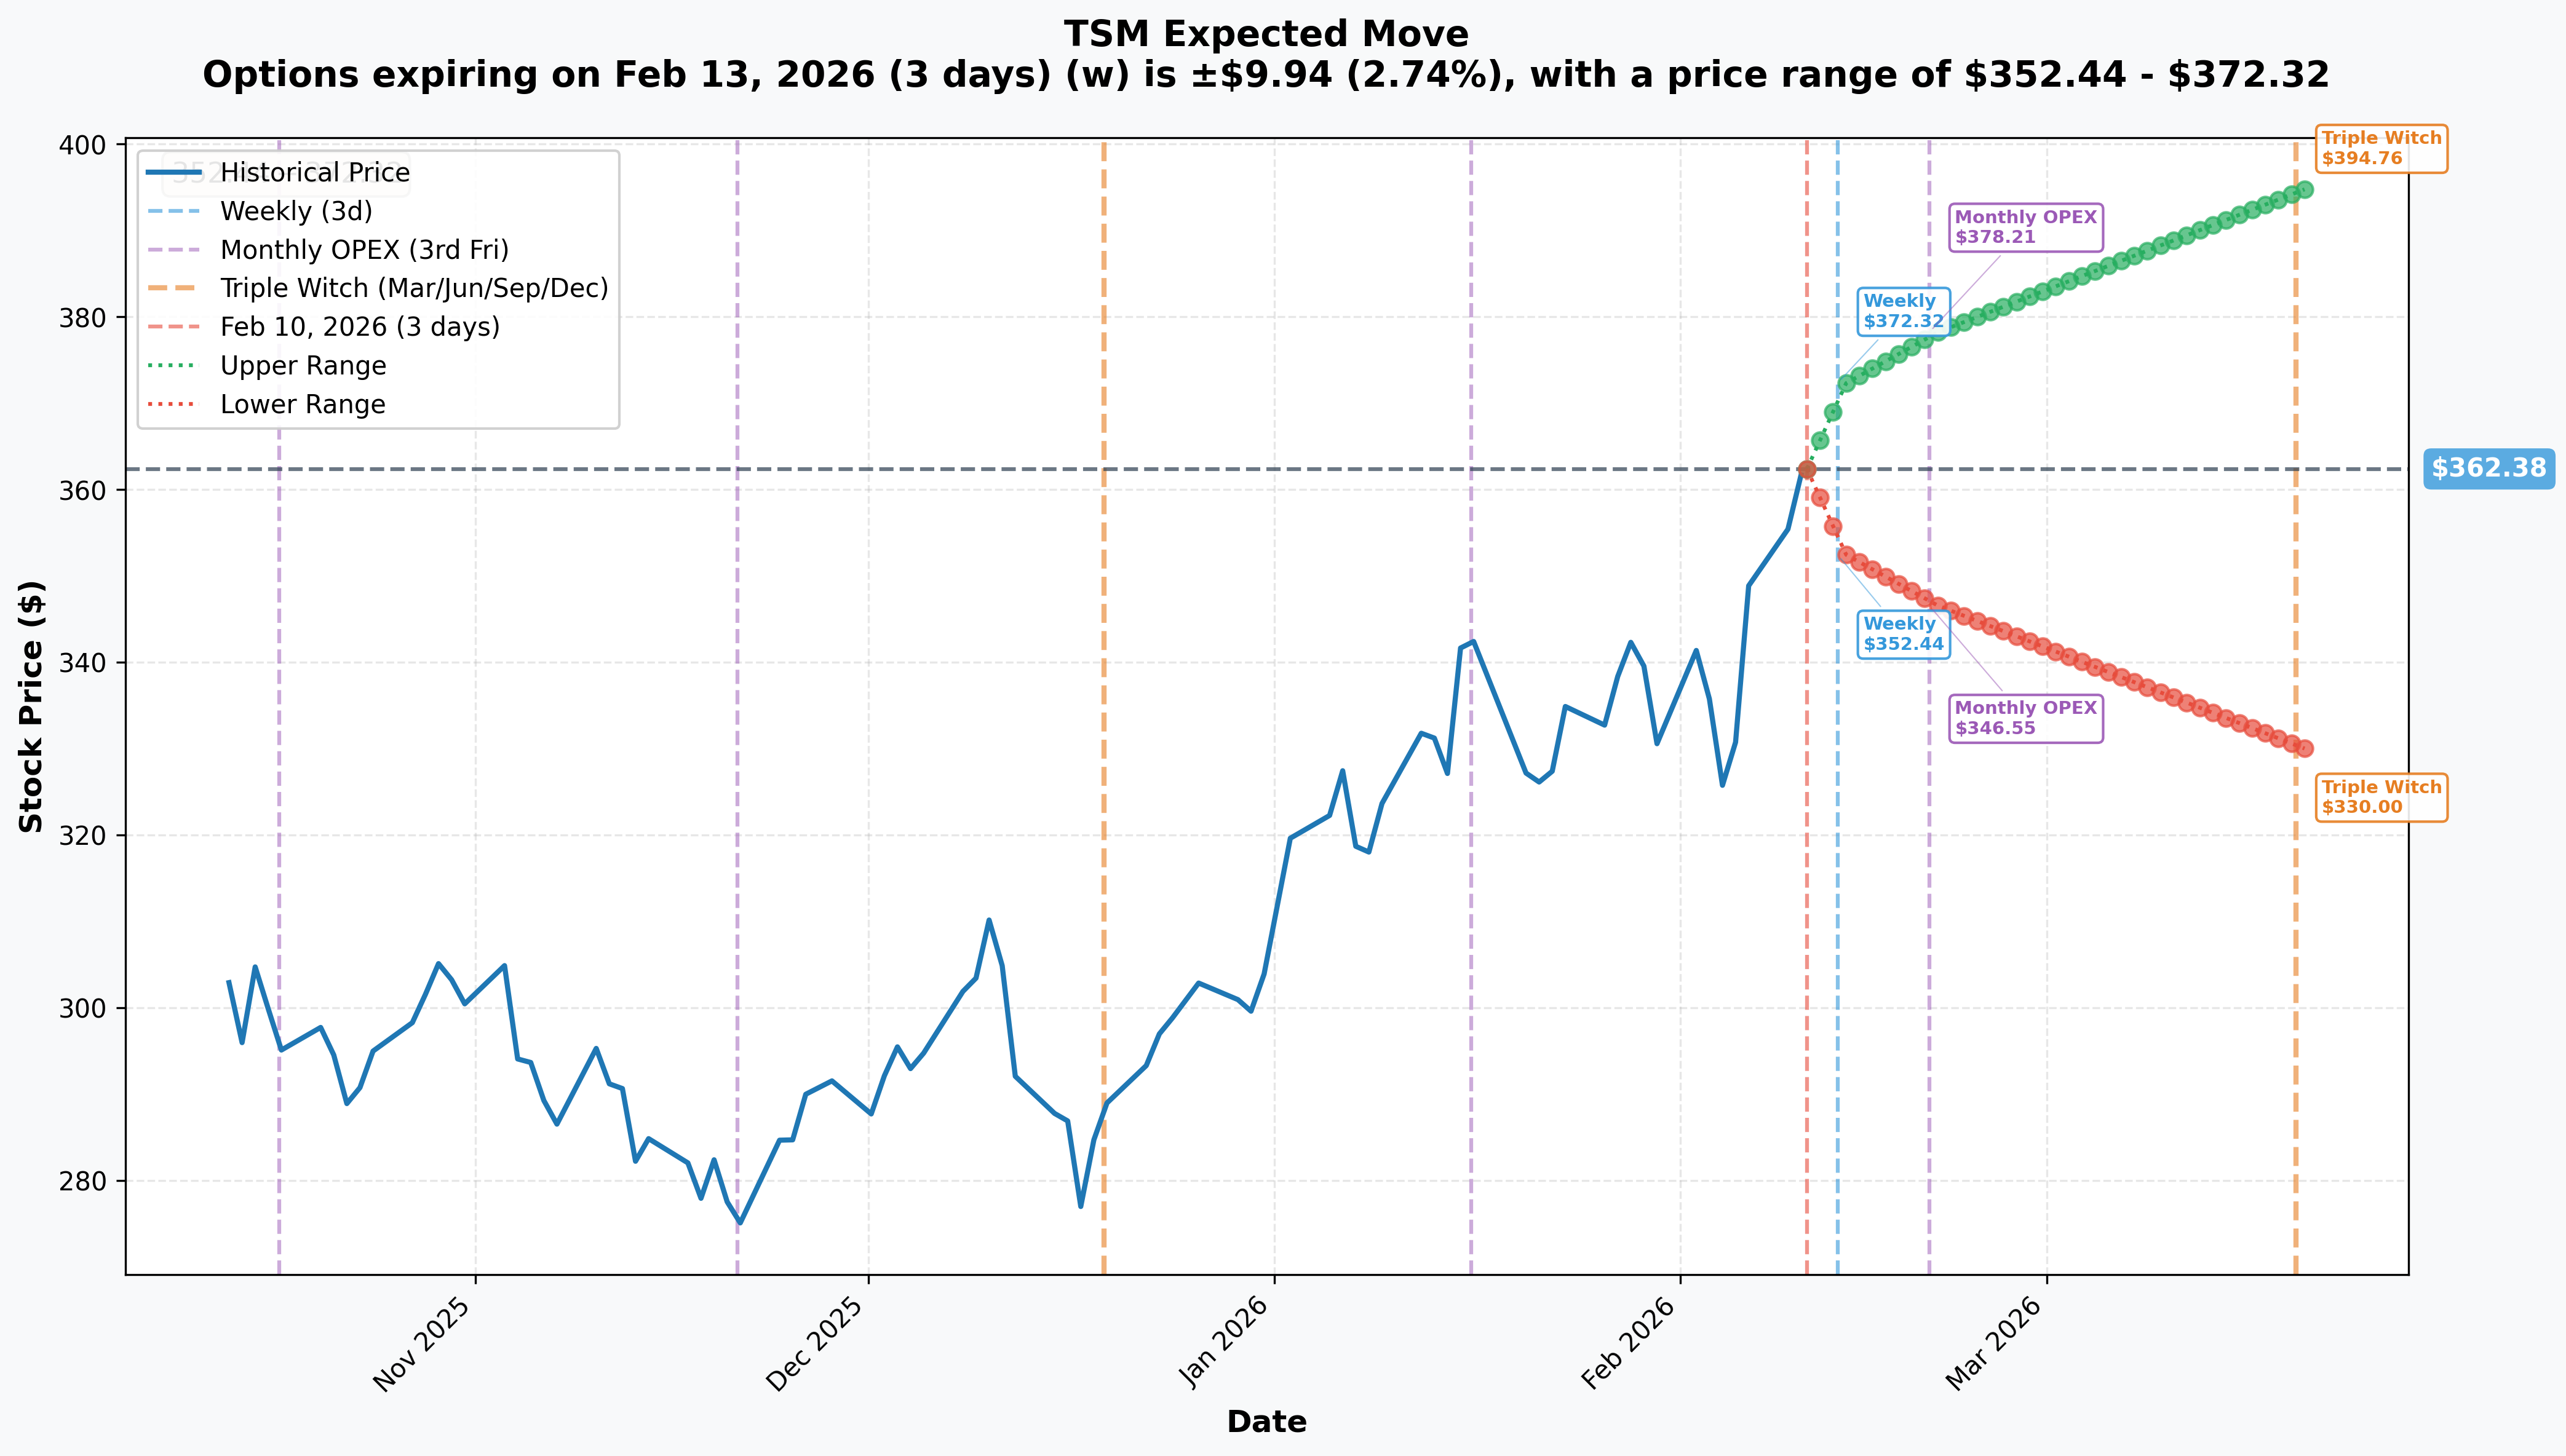
Technical Levels & Implied Move
Current Price Action
| Level | Price |
|---|---|
| Spot Price | $364.26 |
| 52-Week High | $359.60 |
| Support Zone | $348-352 |
| Resistance | $372-378 |
Options-Derived Implied Moves
| Timeframe | Expiry | Implied Move | Range |
|---|---|---|---|
| Weekly | Feb 13 | ±2.74% | $352.44 - $372.32 |
| Monthly OPEX | Feb 20 | ±4.37% | $346.55 - $378.21 |
| Triple Witch | Mar 20 | ±8.94% | $330.00 - $394.76 |
The quarterly implied move of ±8.94% suggests the market prices significant volatility through Q1 earnings (April 16), with an upper implied range of $394.76 still well below the $450 strike.
Catalyst Analysis
Near-Term Catalysts (Next 90 Days)
| Event | Date | Significance |
|---|---|---|
| Q1 2026 Earnings | April 16, 2026 | Revenue guidance $34.6-35.8B (+38% YoY); Gross margin 63-65% |
| 2nm Ramp Updates | Ongoing | 100K wafers/month target by year-end 2026 |
| Arizona Tool Install | Q3 2026 | Equipment installation begins July-September |
| CoWoS Expansion | H2 2026 | Capacity to 130K wafers/month (from 75K) |
Long-Term Catalysts (Through January 2027)
| Catalyst | Expected Impact |
|---|---|
| 2nm Revenue Ramp | 2nm projected to surpass combined 3nm/5nm revenue by Q3 2026 |
| AI Demand Continuation | NVIDIA (~20% of revenue), structural multi-year demand |
| Pricing Power | 3-10% price increases across advanced nodes |
| N2P Launch | Enhanced 2nm with backside power delivery in late 2026 |
| Arizona Phase 2 | 3nm production on track for 2027 |
Catalyst Score: 8.5/10
- Density: High - Multiple quarterly earnings, technology milestones
- Magnitude: High - AI demand structural, capacity sold out through 2026
- Probability: 95%+ for operational catalysts; 75% for sustained AI demand
Fundamental Thesis
Bull Case
-
Monopoly Position Strengthening: 71-75% foundry market share, widening vs. Samsung (6.8%) and Intel Foundry (emerging)
-
AI Demand is Structural: NVIDIA has surpassed Apple as largest customer (~20% of revenue); CoWoS capacity committed through 2027
-
2nm Fully Booked: Capacity sold out through end of 2026; GAA architecture delivering competitive yields while Samsung struggles
-
Margin Expansion: Gross margins expanding to 63-65% despite overseas fab dilution, demonstrating pricing power
-
Record Capex ($52-56B): Management confidence in multi-year demand; majority allocated to advanced nodes
-
Customer Lock-In: Apple, NVIDIA, AMD, Qualcomm deeply integrated; switching costs extremely high
Bear Case
-
Geopolitical Concentration Risk: ~90% of advanced chips produced in Taiwan; blockade scenario estimated at $2.7T global cost
-
Margin Dilution from Overseas Fabs: 2-4% expected dilution over time from Arizona/Japan/Germany operations
-
AI Spending Sustainability: Hyperscaler capex moderation could create near-term demand volatility
-
Valuation: At $1.84T market cap, significant AI tailwinds may be priced in
-
Intel 18A Wild Card: Successful Intel foundry execution could erode pricing power long-term
Trade Structure Analysis
Strategy: Long Call (LEAP)
Risk/Reward Profile:
| Scenario | TSM Price | Option Value | P&L |
|---|---|---|---|
| At Expiry: Below $450 | <$450 | $0 | -$18.0M (-100%) |
| At Expiry: Breakeven | $485.35 | $35.35 | $0 |
| At Expiry: $500 | $500 | $50.00 | +$7.3M (+41%) |
| At Expiry: $550 | $550 | $100.00 | +$32.3M (+179%) |
| At Expiry: $600 | $600 | $150.00 | +$57.3M (+318%) |
Greeks Profile (Estimated)
| Greek | Value | Interpretation |
|---|---|---|
| Delta | ~0.38 | ~$190K P&L per $1 move in TSM |
| Gamma | ~0.004 | Low sensitivity, gradual delta change |
| Theta | ~-$0.03/day | ~$15K daily decay (manageable for LEAP) |
| Vega | ~0.75 | $375K per 1pt IV change |
Position Sizing Context
- $18M Premium: Represents significant conviction sizing
- Notional Exposure: 5,000 contracts x 100 shares x $364.26 = $182.1M notional
- Leverage: ~10:1 (premium vs. stock equivalent)
Institutional Flow Interpretation
Vol/OI Ratio Analysis
| Metric | Value | Significance |
|---|---|---|
| Volume | 5,000 | Single large block |
| Open Interest | 4,600 | Prior positioning |
| Vol/OI Ratio | 1.087 | New position opening |
The Vol/OI ratio exceeding 1.0 strongly indicates this is a new position being established rather than closing existing exposure. The execution as a single block at 14:13 ET suggests institutional execution seeking to minimize market impact.
Flow Classification
| Characteristic | Assessment |
|---|---|
| Size | Institutional (>$10M premium) |
| Execution | Block trade (single timestamp) |
| Direction | Aggressive buyer (BUY side) |
| Tenor | Long-dated (LEAP) |
| Strike Selection | Deep OTM (+23.5%) = High conviction |
| Timing | Mid-session (avoiding open/close noise) |
Risk Assessment
Maximum Loss Scenario
Full Premium Loss ($18M): Occurs if TSM fails to reach $450 by January 15, 2027.
Probability Assessment: The $450 strike requires +23.5% appreciation from current levels. Based on:
- Analyst consensus price target: $392-397 (high target: $450)
- Triple Witch implied upper range: $394.76
- Historical TSM volatility
The probability of finishing in-the-money is estimated at 25-35%, though early exit opportunities may present favorable risk/reward before expiration.
Key Risks
| Risk Factor | Probability | Impact | Mitigation |
|---|---|---|---|
| Geopolitical Escalation | 15% | Catastrophic | Overseas fab diversification |
| AI Demand Slowdown | 25% | Severe | Diversified customer base |
| Margin Compression | 30% | Moderate | Pricing power, efficiency gains |
| Intel Competitive Threat | 20% | Moderate-Low | Technology lead, customer lock-in |
| General Market Correction | 35% | Moderate | LEAP timeframe provides flexibility |
Conclusion
This $18 million LEAP position represents a high-conviction institutional bet on TSMC's continued dominance in AI semiconductor manufacturing. The trade thesis aligns with:
- Structural AI Demand: Multi-year tailwind from NVIDIA, AMD, and hyperscaler buildout
- Technology Moat: 2nm fully booked, CoWoS capacity expanding, competitors struggling
- Catalyst Density: Multiple earnings reports and technology milestones through expiration
- Asymmetric Payoff: Defined risk ($18M) with unlimited upside potential
The aggressive +23.5% OTM strike selection suggests the buyer is positioning for either a significant re-rating of TSMC shares or expects a major positive catalyst (e.g., Arizona production success, Intel foundry struggles, sustained AI demand) to drive substantial appreciation.
Trade Verdict: Bullish with Conviction
The institutional buyer appears willing to accept a higher probability of total loss in exchange for substantial leverage to an outsized upside move. This is a directional bet on the AI semiconductor cycle extending through 2027.
Actionable Intelligence
For Traders Following This Flow
| Action | Consideration |
|---|---|
| Direct Follow | High premium barrier; consider smaller sizing or alternative strikes |
| Spread Alternative | Jan 2027 $400/$450 call spread reduces cost, caps upside |
| Stock Proxy | Long TSM shares with defined stop offers similar directional exposure |
| Earnings Play | Apr 16 earnings could be entry/exit catalyst |
Key Monitoring Metrics
- Q1 2026 Revenue: Guidance for $34.6-35.8B
- Gross Margin: Target 63-65%
- 2nm Yield Commentary: Customer shipment updates
- CoWoS Utilization: NVIDIA allocation updates
- Geopolitical Headlines: Taiwan Strait developments
Analysis generated by AInvest Options Research. This report is for informational purposes only and does not constitute investment advice. Options trading involves substantial risk of loss.