💎 TTMI $1.6M Bullish Call Bet - Smart Money Loading Up on PCB Leader! 🚀
📅 December 18, 2025 | 🔥 Unusual Activity Detected
🎯 The Quick Take
Someone just placed a $1.6 MILLION bullish bet on TTM Technologies this morning at 10:44:33! This massive institutional player bought 2,500 contracts of $80 strike calls expiring March 20, 2026 - betting TTMI rallies another 20% from current levels over the next 3 months. With TTMI already up 163% year-over-year at $66.76 and riding dual supercycles in aerospace/defense and AI data centers, smart money is doubling down on the PCB revolution. Translation: Big money thinks this AI infrastructure play has plenty more room to run!
📊 Company Overview
TTM Technologies (TTMI) is the largest printed circuit board (PCB) manufacturer in North America and a critical supplier to the booming aerospace/defense and AI infrastructure markets:
- Market Cap: $7.44 Billion (top 5 global PCB manufacturer)
- Industry: Printed Circuit Boards - Electronic manufacturing backbone
- Current Price: $66.76 (near 52-week high of $80.58 hit December 11)
- Primary Business: Advanced PCBs for aerospace/defense (47% of revenue), AI/data center systems (19%), medical/industrial equipment, automotive, and networking infrastructure
- Strategic Position: Largest PCB supplier to U.S. military with $1.56B record defense backlog
💰 The Option Flow Breakdown
The Tape (December 18, 2025 @ 10:44:33):
| Time | Symbol | Side | Buy/Sell | Type | Expiration | Premium | Strike | Volume | OI | Size | Spot | Option Price |
|---|---|---|---|---|---|---|---|---|---|---|---|---|
| 10:44:33 | TTMI | ASK | BUY | CALL $80 | 2026-03-20 | $1.6M | $80 | 2.5K | 2.7K | 2,500 | $66.76 | $6.38 |
🤓 What This Actually Means
This is a bullish directional bet on continued TTMI momentum! Here's the breakdown:
- 💸 Hefty premium paid: $1.6M ($6.38 per contract × 2,500 contracts)
- 🎯 Aggressive strike: $80 target is 19.8% above current price - betting on serious upside
- ⏰ Strategic timing: 92 days to expiration captures Q4 2025 earnings (February 11, 2026), Penang facility ramp updates, Syracuse ultra-HDI facility progress, and defense budget awards
- 📊 Substantial size: 2,500 contracts represents 250,000 shares worth ~$16.7M
- 🏦 Institutional conviction: This is smart money making a confident bullish bet, not hedging
What's really happening here: This trader is betting that TTMI breaks out above all-time highs and rallies to $80+ by March 20, 2026. They're paying $6.38 per share for the March $80 calls, which means the stock needs to reach $86.38 at expiration just to break even. Think of it like putting down $1.6M on a high-conviction bet that TTMI's AI infrastructure and defense momentum accelerates over the next quarter.
Unusual Score: 🔥 EXTREMELY UNUSUAL (6.9x above normal threshold) - This type of size happens only once every few months for TTMI! The Z-score of 6.93 means this is statistically off-the-charts unusual - only 1 similar trade in recent history. The 0.926 volume-to-open-interest ratio shows this is fresh positioning, not rolling existing positions.
📈 Technical Setup / Chart Check-Up
YTD Performance Chart
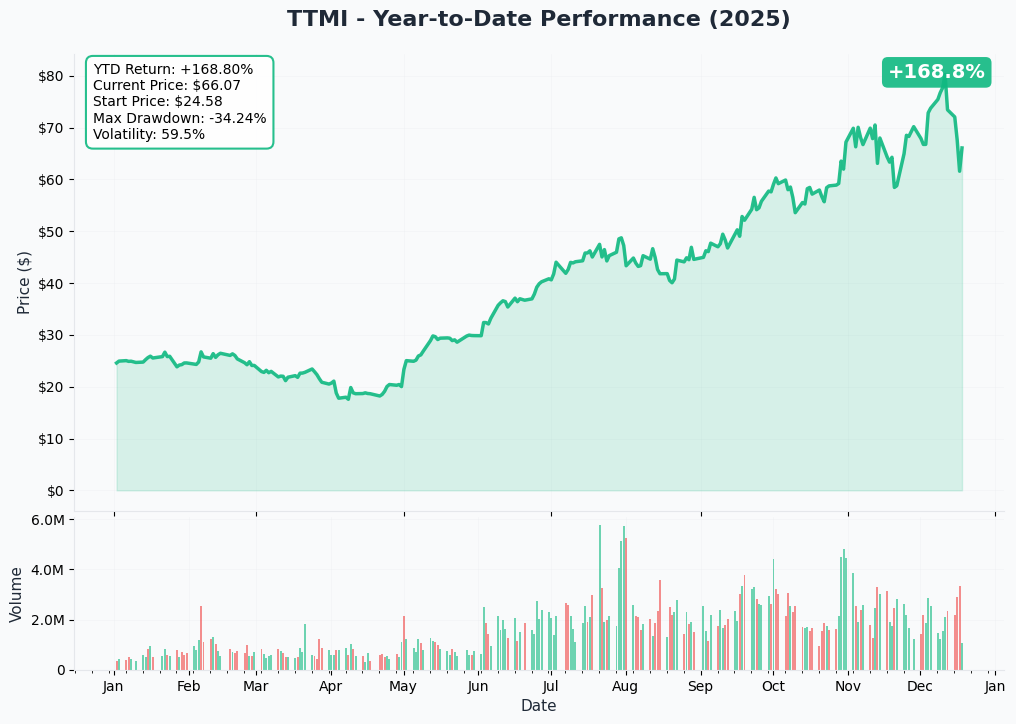
TTMI is absolutely crushing it - up 163% year-over-year trading at $66.76 (though it briefly touched $80.58 on December 11, its highest level ever). The chart tells a powerful dual-supercycle story: after trading in the $20-30 range for most of 2024, TTMI exploded from $30.60 in late 2024 to new all-time highs above $80 in December 2025.
Key observations:
- 🚀 Parabolic rally: Vertical move from $48 in October to $80+ in early December on accelerating AI/defense momentum
- 📈 Breakout confirmed: Smashed through $50, $60, $70 resistance levels successively - textbook breakout pattern
- 🎢 Recent consolidation: Pulled back from $80.58 to current $66.76 (17% correction) - healthy consolidation after explosive run
- 📊 Strong support: Current $66-67 level holding well, suggesting buyers stepping in on dips
- ⚠️ High beta stock: Extreme volatility shows this moves fast - can gain or lose 10-20% in days
Gamma-Based Support & Resistance Analysis
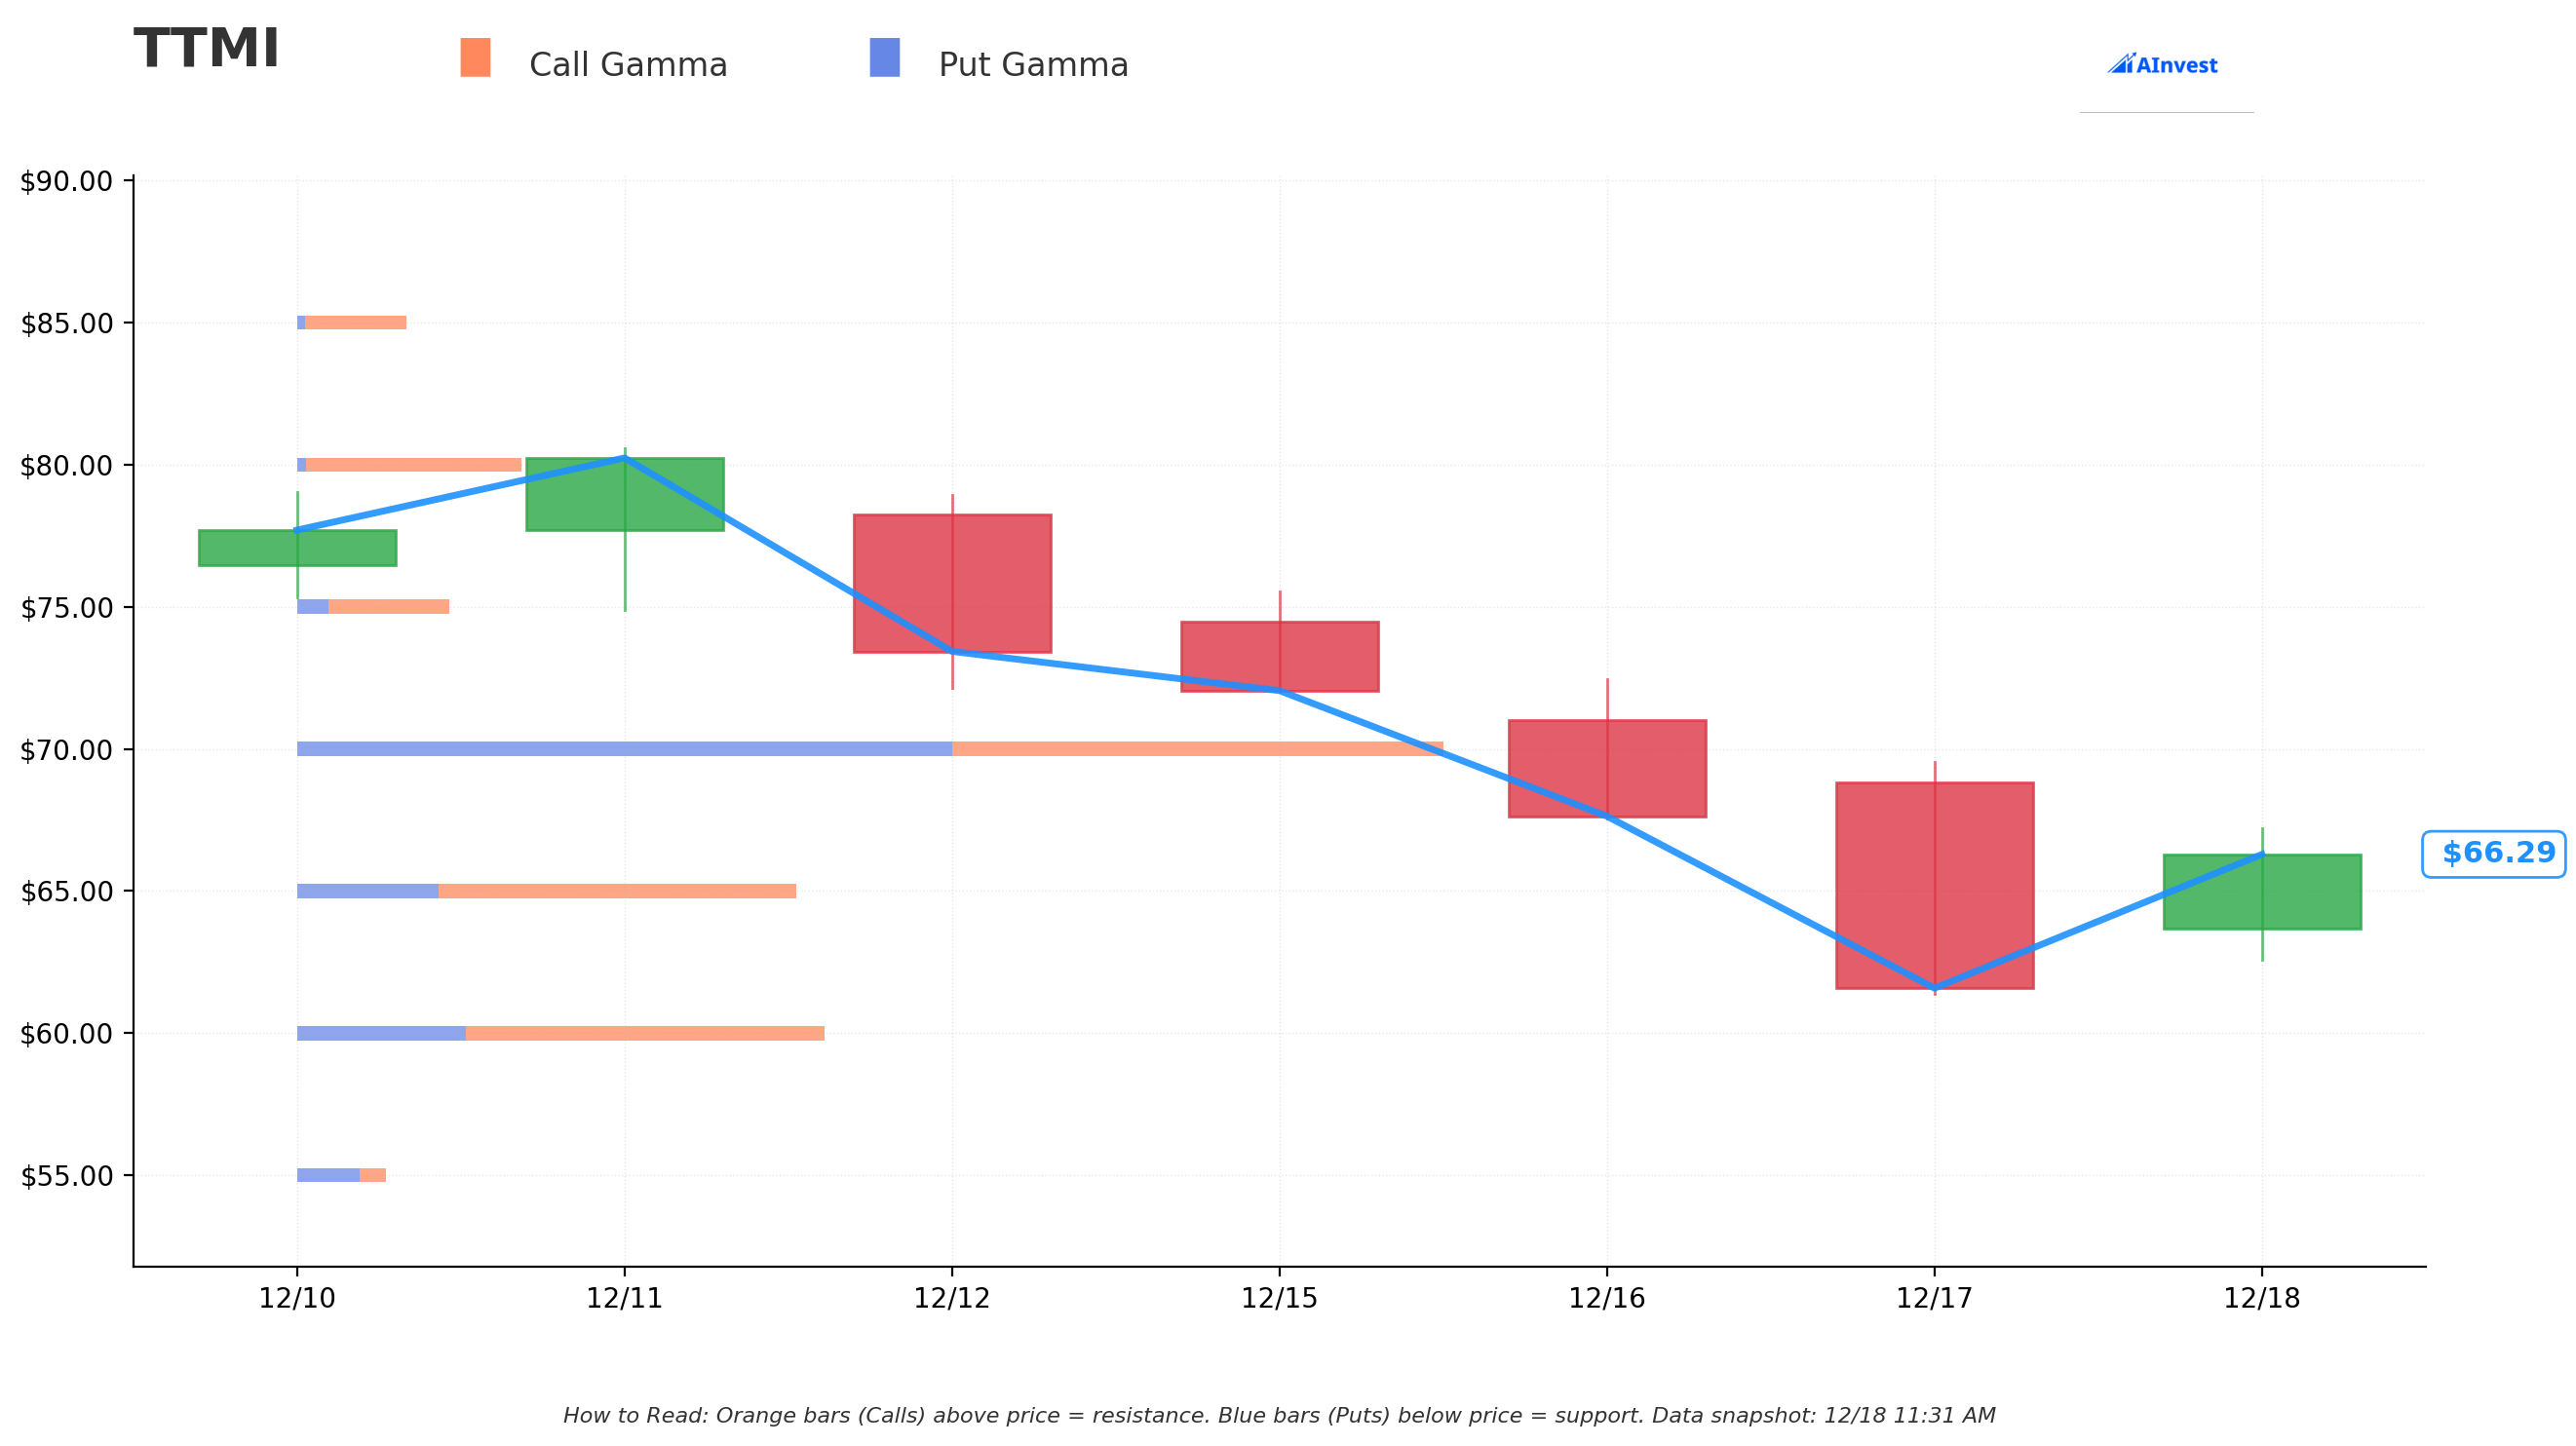
Current Price: $66.24
The gamma exposure map reveals critical magnetic price levels that will govern near-term price action:
🔵 Support Levels (Put Gamma Below Price):
- $65 - Immediate support with 0.71B total gamma exposure (strongest nearby floor!)
- $60 - Secondary support at 0.77B gamma (dealers will aggressively buy dips here)
- $55 - Deep support zone with 0.13B gamma (extended floor if momentum breaks)
🟠 Resistance Levels (Call Gamma Above Price):
- $70 - Immediate ceiling with 1.63B gamma (STRONGEST RESISTANCE - massive option interest here!)
- $75 - Secondary resistance at 0.22B gamma (need strong catalyst to break through)
What this means for traders: TTMI is trading in a consolidation zone between solid $65 support and significant $70 resistance. The gamma data shows MASSIVE option positioning at $70 (1.63B - the single largest level) which creates natural resistance as market makers hedge their exposure. The stock needs serious buying pressure to break through $70, but once it clears that ceiling, next stop is $75 with limited resistance beyond.
Notice anything? The call buyer struck at $80 - well above current gamma resistance levels. They're betting TTMI not only breaks $70 but powers through $75 and establishes new highs above $80. This is aggressive positioning expecting a sustained breakout, not just a temporary spike.
Net GEX Bias: Bullish (2.56B call gamma vs 1.73B put gamma) - Overall positioning remains strongly bullish with call gamma dominance signaling upward price bias as dealers hedge.
Implied Move Analysis
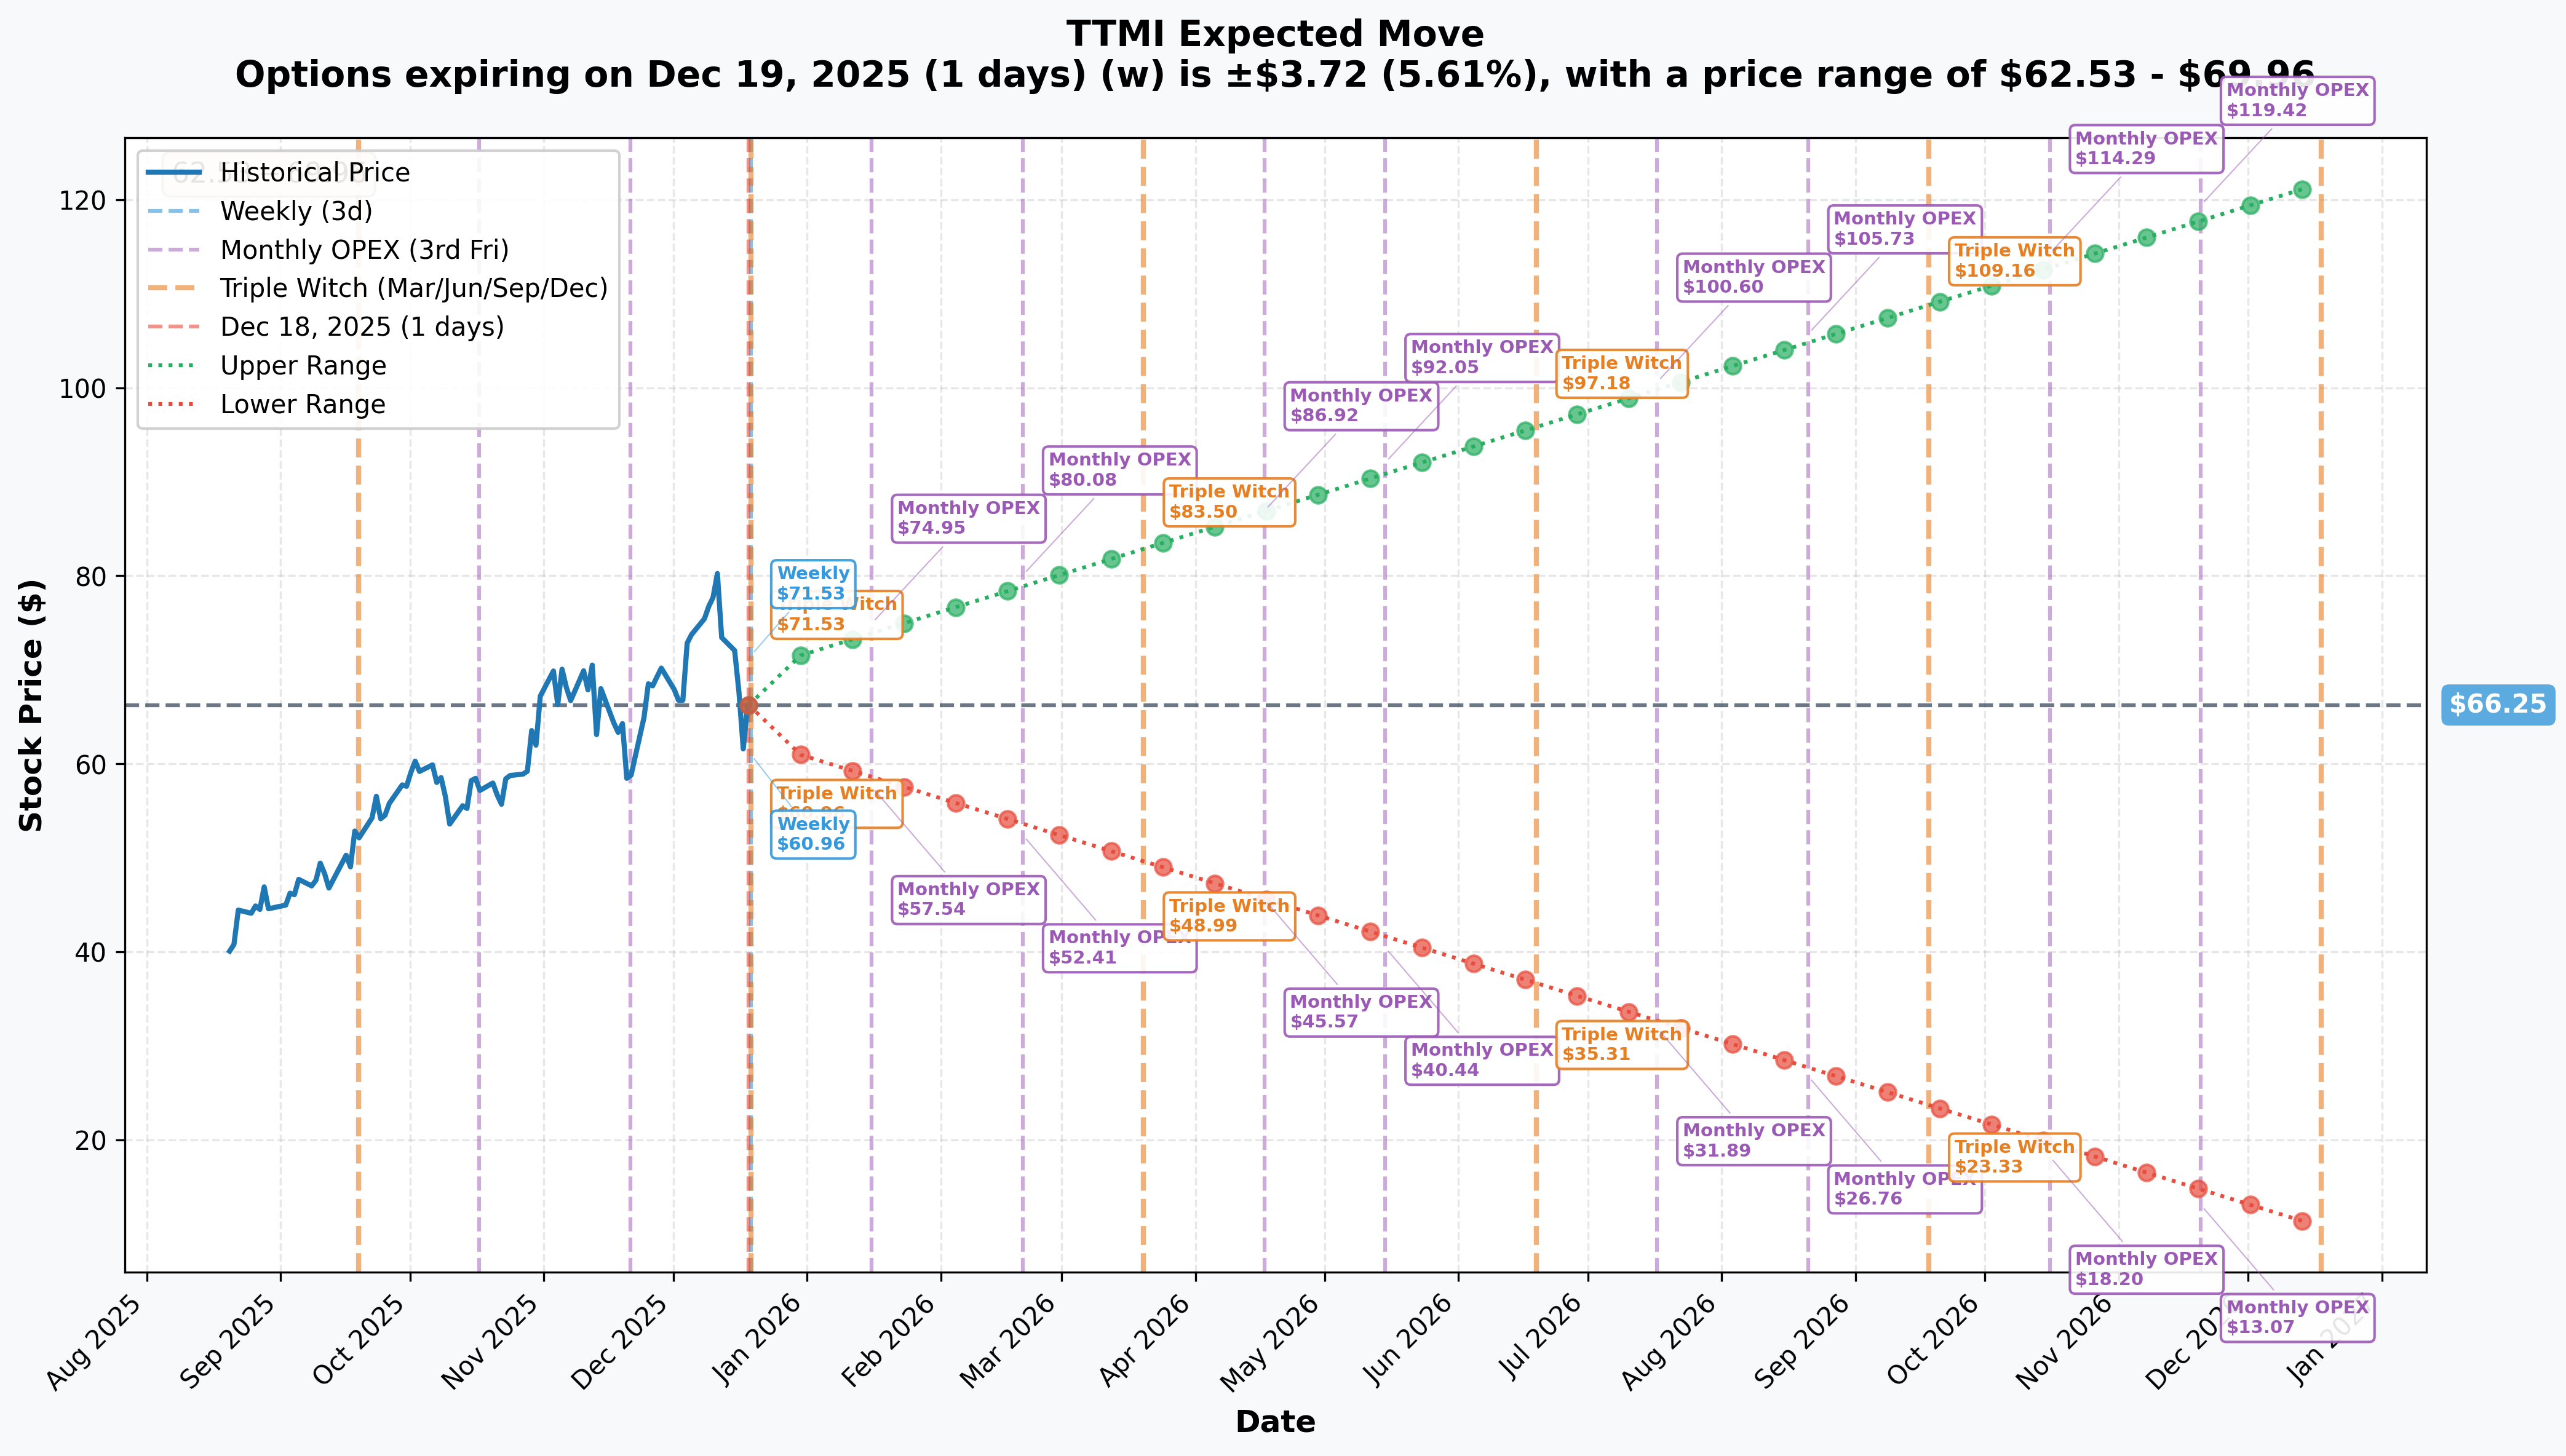
Options market pricing for upcoming expirations:
- 📅 Weekly/Monthly/Triple Witch (Dec 19 - TOMORROW!): ±$3.72 (±5.61%) → Range: $62.53 - $69.96
- 📅 Monthly OPEX (Jan 16 - 29 days): ±$8.70 (±13.13%) → Range: $57.54 - $74.95
- 📅 Quarterly Triple Witch (Mar 20 - 92 days - THIS TRADE!): ±$17.25 (±25.99%) → Range: $48.99 - $83.50
- 📅 Yearly LEAPS (Dec 18, 2026 - 365 days): ±$55.59 (±83.92%) → Range: $10.65 - $121.84
Translation for regular folks: Options traders are pricing in a 5.6% move ($3.72) by tomorrow's OPEX, but a MASSIVE 26% move ($17.25) through March 20 expiration when this $1.6M trade expires. The market expects serious volatility - that implied move range of $48.99 - $83.50 shows the options market thinks TTMI could realistically touch $83+ (exactly where the call buyer needs to profit!).
The March 20th expiration (when this $1.6M trade expires) has an upper range of $83.50 - meaning the market gives a reasonable probability that TTMI trades above $83 over the next 92 days. This aligns perfectly with the call buyer's thesis: the $80 strike sits comfortably within the implied move upper range, suggesting this isn't a lottery ticket but a calculated bet on continued momentum.
Key insight: The sharp increase in implied volatility from 5.6% (tomorrow) to 26% (March) reflects massive uncertainty around upcoming catalysts including Q4 earnings, Penang facility ramp updates, and defense contract awards. Smart money is paying up for upside exposure into this volatility.
🎪 Catalysts
🔥 Immediate Catalysts (Next 30 Days)
December 19, 2025 - Tomorrow's Monthly OPEX 📊
Options expiration tomorrow will likely cause price action as market makers unwind positions. With implied move of ±5.6% ($62.53-$69.96 range), expect potential volatility as large option positions settle. The strong $70 gamma resistance suggests price may gravitate toward $65-70 consolidation zone through year-end.
Year-End Portfolio Rebalancing (December 2025) 💰
Institutional investors typically rebalance portfolios before calendar year-end, which could create buying pressure for strong performers like TTMI. With 95.79% institutional ownership and 124 institutions adding shares in Q3 2024, momentum could continue as funds lock in positions before 2026.
🚀 Near-Term Catalysts (Q1 2026 - Next 90 Days)
Q4 2025 Earnings - February 11, 2026 (54 DAYS AWAY!) 📊
TTMI reports fiscal Q4 and full-year 2025 results on Wednesday, February 11, 2026 after market close. This is THE catalyst that could propel TTMI toward the $80 strike target. Key expectations based on recent performance:
- 📊 Q4 Revenue: Consensus expecting $650-680M (high-teens YoY growth) - Q4 2024 posted $651M with 14.4% growth
- 💰 Q4 EPS: Street looking for $0.60-0.70 range - Q4 2024 delivered $0.60 beating $0.47 estimate
- 🏭 Full-Year 2025 Revenue: Targeting $2.7-2.9B (15-20% growth over 2024's $2.4B) driven by defense backlog conversion and AI data center ramp
- 📈 Book-to-Bill Ratio: Critical metric - recent trends showed 1.14 in Q4 2024, watching for acceleration back toward 1.2+ showing demand strength
- 🤖 Penang Facility Update: Market wants confirmation facility hit $180M annual run-rate revenue target by year-end 2025
- 💻 Aerospace/Defense Commentary: With record $1.56B backlog, guidance on 2026 conversion rate crucial
Upside surprise potential: Management has beaten earnings in 4 consecutive quarters. Q3 2025 delivered record revenue of $752.7M (+22% YoY) with $0.67 EPS showing accelerating momentum. If Q4 continues this trajectory and 2026 guidance reflects sustained 15-20% growth, stock could easily rally to $75-85 range.
Downside risk factors: Any disappointment in Penang facility ramp (still described as "most pressing headwind" due to operational challenges), weaker book-to-bill trends, or conservative 2026 guidance could trigger profit-taking from $67 toward $55-60 support.
Penang Malaysia Facility Production Ramp - Ongoing Through Q1 2026 🏭
TTMI's $200M state-of-the-art Penang facility targeting $180M annual run-rate revenue by end of 2025 is a make-or-break catalyst:
- 🎯 Target: Full Phase 1 capacity generating $45M quarterly revenue (~7% of company revenue)
- 📈 Phase 2 expansion accelerated from 2025 to late 2024 adding 25% more capacity due to robust demand
- 🌍 Strategic: First Malaysia facility positions TTMI for Asia-Pacific growth and cost advantages
- ⚠️ Risk: Previous quarters showed slower-than-expected ramp creating margin drag
Why this matters for the call trade: If Q4 earnings confirm Penang hit the $180M run-rate target, it validates management's execution and de-risks 2026 revenue growth. The March expiration call buyer needs confidence that Penang contributes meaningfully to justify the $80 price target. Conversely, continued operational challenges could cap upside.
Defense Budget & Contract Awards (January-March 2026) 🇺🇸
FY2026 U.S. Defense budget cycle creates near-term catalyst opportunities:
- 💰 Global military spending: $2.08T in 2025 (+5.2% YoY growth)
- 🚀 "Golden Dome" missile defense initiative: $175B+ potential contracts over 3 years
- 🎯 TTMI's record $1.56B A&D backlog positions for continued wins
- 📊 Any major new defense program awards (radar systems, electronic warfare, secure communications) could be 10-20% upside catalysts
Syracuse New York Ultra-HDI Facility Milestones (Q1 2026) 🏗️
TTMI's $130M Syracuse ultra-HDI facility backed by $30M DOD MCEIP grant progressing toward 2026 production start:
- 🏭 Construction milestones: Final glazing/exterior completion July 2025, transformer energization ongoing
- 🎯 Target: Production ramp begins 2026, initial revenue contribution Q2-Q3 2026
- 🔬 Strategic: Only domestic ultra-HDI PCB production for national security applications (400 new jobs)
- 💡 Symbolic: Any major construction completion announcements (building turnover, equipment installation, first test runs) would signal credibility
📊 Medium-Term Growth Drivers (2026 and Beyond)
AI Data Center Infrastructure Buildout 🤖
TTMI's 19% data center computing exposure grew 20% YoY in Q3 2024 driven by AI server demand:
- 📈 PCB industry CAGR 2025-2030: 5.24%, driven by AI/data center demand
- 🌐 Taiwanese peer Unimicron targeting 40% AI-server exposure by 2026 (from 30% in 2025) showing industry trend
- 🏭 TTMI's July 2025 acquisition of 750k sq ft Eau Claire, Wisconsin facility specifically targeting advanced PCBs for data center networking
- 💪 Technology leadership: Ultra-HDI and advanced packaging for HBM+GPU clusters positions TTMI as AI infrastructure supplier
Aerospace & Defense Multi-Year Visibility 🛡️
With A&D now 47% of revenue (+16% YoY in Q4 2024) and record backlog, this is TTMI's most reliable growth engine:
- 🎯 A&D PCB Market: $1.35B in 2024 growing to $1.61B by 2029 (3.8% CAGR)
- 📊 Management expects above 3-5% long-term market growth due to modernization programs
- 🚀 Major Programs: SPY-6 radar multi-year Raytheon contract for Navy, U.S. Army AN/UPR-4(V) systems
- 🏆 Largest PCB supplier to U.S. military with classified program access and DOD relationships
Market Share Gains from Reshoring Trend 🇺🇸
North American PCB production renaissance benefits TTMI as largest domestic player:
- 📈 North American PCB shipments September 2025: +32% YoY
- 🌍 YTD 2025 North American shipments: +10.5% YoY
- 🎯 U.S. PCB market: $23.58B in 2024 growing to $34.2B by 2033 (4.22% CAGR) - faster than global growth
- 💡 Thesis: Geopolitical tensions, supply chain resilience, CHIPS Act subsidies driving customers to prefer domestic suppliers
⚠️ Risk Catalysts (Negative)
Penang Operational Execution Challenges 🏭
Slower-than-expected Penang ramp described as "most pressing headwind" by analysts:
- 🚨 Facility operational growing pains creating margin drag in recent quarters
- ⚖️ If $180M run-rate target missed, 2026 revenue guidance disappoints
- 💸 Startup costs without proportional revenue contribution compress margins
- 📉 Any earnings disappointment citing Penang issues could trigger -15-20% correction
Valuation Stretched at All-Time High Levels 📊
At 61.6x P/E ratio after 163% YoY rally, TTMI trades at aggressive multiples reflecting high expectations:
- 🎯 Already up 163% YTD vs broader market up ~25% - significant gains already captured
- 💰 Valuation assumes sustained 15-20% revenue growth and margin expansion
- ⚠️ Limited margin for error - any execution misstep magnified at current multiples
- 📉 Insider selling: 23 insider sells vs 0 buys over past year signals executives taking profits
Book-to-Bill Ratio Deceleration Trend 📉
Recent quarters show declining book-to-bill from 1.26 (Q3) to 1.14 (Q4) to 1.09 overall:
- 📊 Indicates potential demand deceleration or customer order timing shifts
- ⚠️ Below 1.0 would signal revenue headwinds ahead
- 🤔 If Q4 2025 earnings show continued decline (below 1.1), raises concerns about growth sustainability
Customer Concentration Risk 🎯
Top 5 customers = 41% of revenue; one customer >10%:
- 🚨 Loss of major customer or significant demand reduction creates vulnerability
- ⚖️ Heavy A&D concentration (47%) means defense budget cuts disproportionately impact TTMI
- 💡 Limited diversification with automotive/industrial/medical showing year-over-year declines
🎲 Price Targets & Probabilities
Using gamma levels, implied move data, and upcoming catalysts, here are the scenarios through March 20, 2026 expiration:
📈 Bull Case (35% probability)
Target: $80-$90
How we get there:
- 💪 Q4 earnings CRUSH expectations with revenue toward $680M+ high end and EPS $0.70+
- 🏭 Penang facility confirms hitting $180M run-rate target, Phase 2 expansion ahead of schedule
- 🤖 Data center AI revenue accelerates beyond 20% YoY as Eau Claire facility ramps
- 📊 2026 guidance surprises to upside with $3.0-3.2B revenue target (25%+ growth) citing backlog conversion
- 🇺🇸 Major defense contract win announced (new radar program, electronic warfare system, etc.)
- 📈 Breakout above $70 gamma resistance triggers technical rally through $75 to $80-85 range
- 🌐 Book-to-bill ratio re-accelerates above 1.2 showing demand strength
Key metrics needed:
- Q4 revenue >$670M, EPS >$0.65
- Full-year 2025 revenue >$2.8B showing 17%+ growth
- Book-to-bill >1.15
- Gross margins expanding (proving Penang efficiency gains)
- 2026 guidance $3.0B+ revenue with continued double-digit growth
Probability assessment: 35% because it requires strong execution but TTMI has beaten earnings 4 consecutive quarters and momentum remains positive. Gamma resistance at $70 creates near-term headwind, but once cleared, limited resistance to $80. Implied move upper range of $83.50 shows options market gives this reasonable probability. The $1.6M call buyer clearly thinks odds are favorable.
🎯 Base Case (45% probability)
Target: $65-$75 range (CHOPPY CONSOLIDATION)
Most likely scenario:
- ✅ Solid Q4 earnings meeting consensus (~$650-665M revenue, $0.58-0.63 EPS)
- 📱 Penang ramp progressing but not spectacular - approaching $180M run-rate but operational challenges persist
- ⚖️ 2026 guidance in-line with Street expectations ($2.8-2.9B revenue, mid-teens growth)
- 🤖 AI data center revenue solid but not accelerating materially from current 20% growth pace
- 🇺🇸 Defense backlog conversion steady but no major new program wins announced
- 🔄 Trading within gamma support ($65) and resistance ($70-75) bands for weeks
- 📊 Market digests 163% YTD gains, waits for Syracuse production start and sustained Penang profitability proof points
- 💤 Volatility stabilizes as momentum story transitions to "show me" execution phase
This is where calls struggle: Stock consolidates in $65-75 range, $80 calls remain out-of-the-money at March expiration, losing most or all of their $6.38 value. Buyer would lose $1.0-1.6M depending on where stock settles. However, if stock moves toward $75 by March, calls retain some value ($3-5 per contract).
Why 45% probability: Stock at technical inflection after explosive rally - consolidation most common outcome after such moves. Fundamentals solid but valuation rich requires time to "grow into" current multiple. Gamma dynamics suggest range-bound trading. Most institutional players will hold and wait for next major catalyst (Syracuse ramp, sustained Penang profitability).
📉 Bear Case (20% probability)
Target: $55-$65 (GIVE BACK RECENT GAINS)
What could go wrong:
- 😰 Earnings miss or weak guidance disappoints at stretched valuation - even small miss could trigger -15-20% selloff
- 🚨 Penang facility ramp further delayed or operational issues worsen - management revises down $180M target
- 📉 Book-to-bill ratio falls below 1.1 signaling demand deceleration
- 🇨🇳 Broader defense budget uncertainty or program delays impact backlog conversion timeline
- 💸 Q4 2025 earnings show margin compression from Penang startup costs overwhelming revenue growth
- 📊 2026 guidance conservative citing macro uncertainty, automotive/industrial weakness, or customer project pushouts
- 🔨 Break below $65 gamma support triggers cascade toward $60, then $55
- 💰 Profit-taking accelerates as hedge funds lock in 163% YTD gains into uncertain macro environment
Critical support levels:
- 🛡️ $65: Immediate gamma floor (0.71B) - MUST HOLD or momentum shifts bearish
- 🛡️ $60: Deep support (0.77B gamma) - major psychological level and technical support
- 🛡️ $55: Extended floor (0.13B gamma) - disaster scenario testing YTD breakout levels
Probability assessment: Only 20% because fundamentals remain strong (record defense backlog, AI infrastructure tailwinds, capacity expansion on track) and TTMI has consistently beaten earnings. However, valuation offers no cushion and insider selling pattern (23 sells, 0 buys) signals management may see limited near-term upside. The call buyer accepting this risk suggests they've done homework and see probability below 20%.
Call P&L in Bear Case:
- Stock at $65 on Mar 20: Calls expire worthless, loss = -$6.38/share × 2,500 = -$1.6M (100% loss)
- Stock at $60 on Mar 20: Calls expire worthless, loss = -$6.38/share × 2,500 = -$1.6M (100% loss)
- Stock at $70 on Mar 20: Calls worth ~$2-3 (some time value remains but OTM), loss = -$3.38 to -$4.38 × 2,500 = -$845K to -$1.1M (53-69% loss)
💡 Trading Ideas
🛡️ Conservative: Wait for Post-Earnings Dip
Play: Stay on sidelines until after February 11th Q4 earnings, then enter on any pullback
Why this works:
- ⏰ Earnings in 54 days creates binary event risk - too much uncertainty to commit capital now
- 💸 Stock near recent highs at $66.76 after touching $80.58 - better entry likely exists
- 📊 At 61.6x P/E after 163% rally, zero margin of safety at current levels
- 🎯 Post-earnings pullback to $60-65 gamma support zone offers 10-15% better entry with same upside potential
- 📉 Implied volatility spike pre-earnings makes options expensive - wait for post-earnings IV crush
- 🤔 The $1.6M call buy signals conviction, but institutional player can absorb risk retail investors cannot
Action plan:
- 👀 Watch February 11 earnings closely for revenue ($650M+ needed), book-to-bill (>1.15 ideal), Penang update (approaching $180M run-rate?), and 2026 guidance quality
- 🎯 Look for pullback to $60-65 support post-earnings for stock entry with better risk/reward
- ✅ Need to see Penang execution progress, sustained book-to-bill strength, and robust 2026 guidance before committing
- 📊 Monitor unusual options activity - if institutions add MORE calls post-earnings, validates thesis
- ⏰ Consider March or April calls AFTER earnings when IV drops and direction clearer
Risk level: Minimal (cash position) | Skill level: Beginner-friendly
Expected outcome: Avoid potential -15-20% drawdown if earnings disappoint. Get better entry if stock consolidates. Maintain optionality to participate if breakout occurs.
⚖️ Balanced: Bull Put Spread (Income Play)
Play: Sell put spread to collect premium while defining risk
Structure: Sell $65 puts, Buy $60 puts (March 20 expiration - SAME as the $1.6M call trade)
Why this works:
- 📊 Defined risk spread ($5 wide = $500 max risk per spread)
- 🎯 Targets gamma support zone at $60-$65 where institutions are clearly positioned
- 💰 Collects premium betting stock stays above $65 (current price is $66.76, so slight buffer)
- 🛡️ Protects against modest pullback - only starts losing money below $65
- ⏰ 92 days to expiration allows time for earnings catalyst and Penang updates
- 🤝 Essentially betting WITH the call buyer that stock doesn't collapse, but with defined risk
Estimated P&L (current market):
- 💰 Collect ~$1.50-2.00 credit per spread (adjust based on actual IV)
- 📈 Max profit: $150-200 if TTMI above $65 at March expiration (keeps full credit)
- 📉 Max loss: $300-350 if TTMI below $60 at expiration (defined and limited)
- 🎯 Breakeven: ~$63-63.50
- 📊 Risk/Reward: ~1.5:1 to 2:1 which is favorable for defined-risk bullish play
Entry timing:
- ⏰ Can enter now OR wait until after tomorrow's OPEX when volatility settles
- 🎯 Ideal entry: Stock trading $66-68 range with IV elevated pre-earnings
- ❌ Skip if stock already below $64 (spread too close to at-the-money)
Position sizing: Risk only 3-5% of portfolio per spread (this is income generation with defined risk)
Management:
- 📈 If stock rallies to $72-75, consider taking profit early (captured 60-70% of max gain)
- 📉 If stock breaks below $64, consider rolling spread down to $60/$55 to avoid max loss
- ⏰ Don't wait until expiration - manage at 21-30 days remaining
Risk level: Moderate (defined risk, bullish directional bias) | Skill level: Intermediate
🚀 Aggressive: Follow The Smart Money - March $80 Calls (ADVANCED ONLY!)
Play: Copy the institutional trade by buying March $80 calls in smaller size
Structure: Buy $80 calls (March 20 expiration)
Why this could work:
- 💥 Copying $1.6M institutional bet with presumably superior research/analysis
- 🎰 Betting on explosive 20%+ rally to $80-85 over next 92 days
- 📊 Implied move upper range of $83.50 shows options market gives this reasonable probability
- 🚀 If earnings beat AND Penang confirms $180M run-rate, stock could gap to $75-80
- ⚡ Only need stock above $86.38 to profit (or can sell earlier as stock approaches $80)
- 📈 Gamma dynamics create explosive upside potential once $70 resistance breaks
Why this could blow up (SERIOUS RISKS):
- 💸 EXPENSIVE: Each call costs $638 ($6.38 × 100 shares)
- ⏰ TIME DECAY KILLER: Theta burns -$20-30/day as you get closer to expiration
- 😱 FAR OUT-OF-THE-MONEY: Stock needs to rally 20% just to reach strike
- 📊 Binary earnings risk: If Q4 earnings disappoint, calls could lose 50-80% of value overnight
- 🎢 Breakeven at $86.38: Needs 29% rally from current $66.76 to breakeven!
- ⚠️ Base case scenario (consolidation $65-75) results in 80-100% loss
- 💀 If stock below $80 at March 20 expiration, lose ENTIRE premium
Estimated P&L:
- 💰 Cost: $638 per call contract
- 📈 Profit scenario: Stock rallies to $88-90 = ~$8-10 gain per contract (125-157% ROI)
- 🚀 Home run: Stock rallies to $95-100 = $15-20 gain per contract (235-314% ROI!)
- 📉 Modest loss: Stock at $75-78 by March = lose $4-6 per contract (63-94% loss)
- 💀 Total loss: Stock below $80 at expiration = lose entire $6.38 (100% loss)
Breakeven point:
- 📈 Need stock at $86.38 at expiration to break even (29% rally required)
CRITICAL WARNING - DO NOT attempt unless you:
- ✅ Can afford to lose ENTIRE premium (real possibility in base case scenario!)
- ✅ Understand you're making a high-risk, high-reward directional bet
- ✅ Have experience trading options and understand Greeks/time decay
- ✅ Accept that even if stock rallies to $75-78, you could still lose 70-90% of investment
- ⏰ Plan to actively manage position - take profits if stock hits $75-80 before expiration
- 🎯 Position size: Risk only 1-2% of total portfolio (this is speculation, not investing)
Alternative approach: Instead of buying $80 calls, consider $75 calls (closer to money, better probability) or call spread ($75/$80) to reduce cost
Risk level: EXTREME (can lose 100% of premium) | Skill level: Advanced only
Probability of profit: ~30-35% (aligns with bull case probability but requires sustained rally)
⚠️ Risk Factors
Don't get caught by these potential landmines:
-
⏰ Q4 earnings binary event in 54 days: Results February 11 after close create MASSIVE volatility risk. Stock could gap 15-20% either direction based on Penang facility update (approaching $180M run-rate or still struggling?), book-to-bill trends (accelerating back to 1.2+ or declining toward 1.0?), and 2026 guidance quality. Historical pattern shows TTMI moves significantly on earnings surprises. At stretched valuation (61.6x P/E), market will be unforgiving of any disappointment.
-
💸 Valuation at nosebleed levels after 163% YTD rally: Trading at 61.6x P/E compared to 5-year average of -13.02x - this is EXTREMELY stretched. Stock priced for PERFECT execution and continued 15-20% revenue growth. Requires Penang hitting $180M target, Syracuse on-time 2026 launch, sustained A&D backlog conversion, and AI data center acceleration. Any disappointment magnified 3-4x at this valuation. Zero margin of safety.
-
🏭 Penang facility operational execution risk: Facility described as "most pressing headwind" by analysts due to slower-than-expected ramp creating margin drag. If Q4 earnings show continued operational challenges or revised-down revenue contribution target, could trigger -20-25% selloff. The $180M run-rate expectation is baked into current valuation - missing this target removes 7% of expected revenue growth.
-
📉 Declining book-to-bill ratio trend: Ratio fell from 1.26 (Q3) to 1.14 (Q4) to 1.09 overall signaling potential demand deceleration. If Q4 2025 shows continued decline below 1.1, raises serious questions about 2026 revenue growth sustainability. Orders typically lead revenue by 1-2 quarters, so weakening orders NOW means revenue risk in Q1-Q2 2026.
-
🎯 Customer concentration creates vulnerability: Top 5 customers = 41% of revenue with one customer >10%. Loss of major customer, program delays, or demand reduction creates outsized impact. With A&D at 47% of sales, any defense budget cuts or program cancellations disproportionately hurt TTMI. Automotive/industrial/medical segments already showing year-over-year declines - limited diversification.
-
👔 Insider selling pattern raises concerns: 23 insider sells vs 0 buys over past year, including Catherine Gridley (EVP, A&D President) selling 15,000 shares in 2024. When executives closest to the business are ONLY selling (zero buying), it signals they see current valuation as rich and limited near-term upside. This contrasts sharply with the $1.6M call buyer's bullish positioning.
-
🔨 Gamma resistance at $70 creates mechanical selling pressure: Massive 1.63B call gamma at $70 (largest single level) means market makers will systematically SELL into rallies to hedge their exposure. Stock needs sustained buying volume to break through this ceiling. Failed breakout attempts at $70-72 could trigger profit-taking back toward $65 support.
-
💰 AI infrastructure spending sustainability unknown: 19% revenue exposure to data center computing grew 20% YoY, but sustainability unclear. If AI capital spending plateaus in 2026 (major hyperscalers completing initial buildout phases), TTMI's growth algorithm breaks down. Competitive landscape intensifying with Asian peers like Unimicron also targeting 40% AI-server exposure.
-
🌍 Geopolitical and supply chain risks: PCB manufacturing requires global supply chains. U.S.-China trade tensions, Taiwan geopolitical risk (affects customer demand patterns), and tariff uncertainty create external headwinds. Spring 2025 tariff increases created supply chain disruption affecting component costs.
-
🚧 Syracuse facility timeline and execution risk: $130M facility not producing revenue until 2026, with full contribution deferred to 2026-2027. Greenfield advanced manufacturing facility carries significant execution risk - delays, technical issues, or slower customer qualification could push benefits further out. Capital investment of $130M requires sustained returns to justify.
-
🎢 Extreme volatility creates whipsaw risk: Recent move from $48 to $80+ in 2 months, then back to $67 (17% correction) shows how violently TTMI moves. This isn't a stable blue-chip - this is a high-beta stock that can move 10-15% on no news. Momentum can reverse quickly, and technical pullbacks can morph into deeper corrections at extended valuations.
🎯 The Bottom Line
Real talk: Someone just bet $1.6 MILLION that TTMI rallies another 20% to $80+ over the next 92 days. This isn't a hedge - this is a high-conviction directional bet by an institution that believes TTMI's dual supercycles in aerospace/defense and AI infrastructure have significant room to run despite the 163% YTD gain.
What this trade tells us:
- 🎯 Sophisticated player expects SUSTAINED MOMENTUM through Q4 earnings (Feb 11) and into Q1 2026
- 💰 They're confident enough in $80 breakout potential to pay $6.38/share (10% of stock price!) for this bet
- ⚖️ The aggressive $80 strike (19.8% above current) shows conviction in explosive upside scenario, not modest gains
- 📊 Timing suggests they expect Q4 earnings to be a POSITIVE catalyst (Penang update, backlog conversion, strong guidance)
- ⏰ March 20 expiration strategically captures earnings, facility updates, and early 2026 momentum
This is NOT a "chase at all-time highs" signal - it's a "smart money sees specific catalysts for breakout" signal.
If you own TTMI:
- ✅ Consider holding through Q4 earnings (February 11) to see if Penang execution and guidance validate continued momentum
- 📊 Set MENTAL STOP at $60 (major gamma support) to protect profits if momentum breaks
- ⏰ Lock in partial gains if stock rallies to $75-80 before earnings - you've already won big!
- 🎯 If earnings beat AND stock breaks $70, could add back trimmed shares on momentum to $80-85
- 🛡️ Consider selling covered calls at $75-80 strikes to generate income and define upside
If you're watching from sidelines:
- ⏰ February 11 after close is the moment of truth - wait for Q4 earnings clarity!
- 🎯 Post-earnings pullback to $60-65 would be EXCELLENT entry (10-15% better price with same upside catalysts)
- 📈 Looking for confirmation of: Penang approaching $180M run-rate, book-to-bill >1.15, 2026 guidance $3.0B+ revenue, defense backlog conversion on track
- 🚀 Longer-term (6-12 months), Syracuse 2026 production start and sustained AI infrastructure demand are legitimate catalysts for $85-100 if execution delivers
- ⚠️ Current valuation (61.6x P/E) requires flawless execution - one stumble and it's back to $55-60
If you're considering the call strategy:
- 🎯 Only consider if you can afford to lose entire premium and understand 29% rally needed to breakeven
- 📊 The $80 calls are aggressive - consider $75 calls or call spreads for better risk/reward
- ⚠️ Wait until after tomorrow's OPEX when volatility settles
- 📉 Remember: Base case scenario (stock consolidates $65-75) results in significant losses on OTM calls
- ⏰ Plan to actively manage - take profits if stock hits $75-78, don't wait for expiration
Mark your calendar - Key dates:
- 📅 December 19 (Tomorrow) - Monthly OPEX, quarterly triple witch (implied move ±5.6%)
- 📅 February 11, 2026 (Wednesday) after market close - Q4 FY2025 earnings report (54 DAYS!)
- 📅 February 12 - Post-earnings price action and Street reactions
- 📅 March 20 - Monthly OPEX and quarterly triple witch, expiration of this $1.6M call trade
- 📅 April 2026 - Q1 2026 earnings, Penang facility progress update, Syracuse construction status
- 📅 Mid-2026 - Syracuse facility production ramp begins, initial ultra-HDI revenue contribution
Final verdict: TTMI's fundamental story remains INCREDIBLY compelling - record $1.56B A&D backlog, AI data center tailwinds, Penang capacity expansion, Syracuse DOD-backed facility, and reshoring trend all support continued growth. BUT, at 61.6x P/E after 163% YTD rally, the risk/reward is NO LONGER favorable for aggressive new positioning at current levels. The $1.6M institutional call buy signals conviction, but retail traders should wait for better entry points or use defined-risk strategies.
Be patient. Let Q4 earnings clear. Look for pullback entry points at $60-65. The PCB revolution will still be here in 2-3 months, and you'll sleep better at night paying $63 instead of $67.
The aerospace/defense and AI infrastructure supercycles are multi-year trends. You don't need to catch the exact bottom or chase at highs. Protect your capital. 💪
Disclaimer: Options trading involves substantial risk of loss and is not suitable for all investors. This analysis is for educational purposes only and not financial advice. Past performance doesn't guarantee future results. The 6.9x unusual score reflects this specific trade's size relative to recent TTMI history - it does not imply the trade will be profitable or that you should follow it. Always do your own research and consider consulting a licensed financial advisor before trading. The $80 strike calls are far out-of-the-money and carry significant risk of total loss if the stock fails to rally 29% to the $86.38 breakeven level.
About TTM Technologies: TTM Technologies manufactures technology solutions including mission systems, RF components, RF microwave/microelectronic assemblies, and technologically advanced printed circuit boards (PCBs), with a market cap of $7.44 billion serving manufacturing, networking, telecommunications, computing, aerospace, and medical industries.