TXN: $2.7M Bearish Put Bet Ahead of Q4 Earnings - Someone Expects Trouble
January 8, 2026 | Unusual Activity Detected
Company Overview
Texas Instruments Incorporated (TXN) is the world's largest analog semiconductor company, generating over 95% of its revenue from semiconductors and the remainder from its well-known calculators. The company holds a leading position in analog chips, processors, and microcontrollers, serving five key end markets: Industrial (~35%), Automotive (~35%), Personal Electronics, Communications Equipment, and Enterprise Systems.
| Metric | Value |
|---|---|
| Market Cap | $168.74B |
| Sector | Semiconductors & Related Devices |
| Current Price | $187.47 |
| 52-Week High | $221.69 |
| 52-Week Low | $139.95 |
| Dividend Yield | ~3.1% |
The Quick Take
Someone just dropped $2.7 million on TXN puts with a Z-Score of 137.83 - that's about 138 standard deviations above normal activity, making this trade extraordinarily rare. This is a significant bearish bet targeting the $185 strike by June 2026, positioned strategically ahead of the January 27 Q4 earnings report. With Goldman Sachs' recent double downgrade to Sell and concerns about $4.8B inventory overhang, this institutional player appears to be betting on meaningful downside.
The Option Flow Breakdown
What Just Happened
| Field | Details |
|---|---|
| Date/Time | January 8, 2026 at 11:59:56 |
| Ticker | TXN |
| Option Symbol | TXN20260618P185 |
| Direction | BUY |
| Type | PUT |
| Expiration | 2026-06-18 (June Triple Witch) |
| Strike | $185.00 |
| Volume | 1,700 contracts |
| Premium | $2,700,000 |
| Order Type | Buy-to-Open (BTO) |
| Strategy | Long Put (STANDALONE) |
| Z-Score | 137.83 (EXTREMELY UNUSUAL) |
What This Actually Means
This is a pure directional bearish bet. The trader paid $2.7M to buy 1,700 put contracts at the $185 strike, expiring on the June 2026 Triple Witch (June 18). With TXN currently trading at $187.47, this put is slightly out-of-the-money.
Translation: This trader is betting TXN drops below $185 - and likely significantly lower - by mid-June. At ~$15.88 per contract (premium/volume), they need TXN to fall to roughly $169 just to break even. That's about a 10% decline from current levels.
The timing is notable - this lands exactly 19 days before Q4 earnings (January 27), giving them exposure to the earnings event and the subsequent quarters.
Technical Setup
YTD Chart Analysis
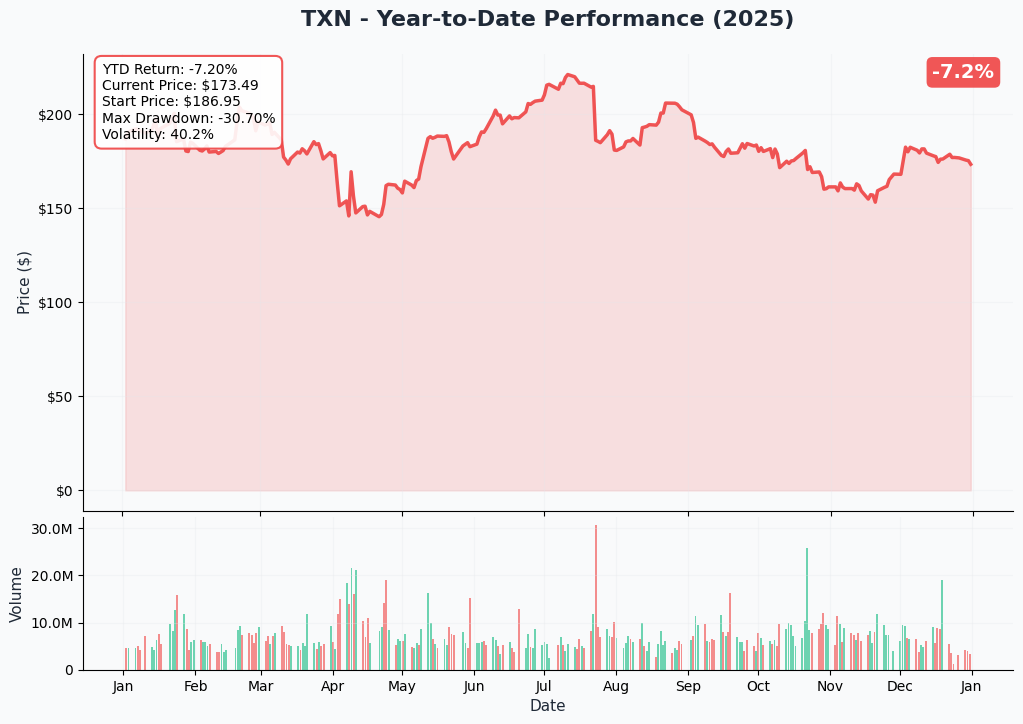
TXN has had a rough year. The stock shows a -7.2% YTD return with significant volatility:
- Started 2025 at $186.95
- Peaked near $221 in July 2025
- Suffered a -30.7% max drawdown during the April correction
- Currently trading at $187.47, essentially flat from a year ago
- Volatility clocking in at 40.2% - elevated for a mega-cap semiconductor name
The stock has been range-bound between $175-$195 since October, showing indecision as the market digests Goldman's bearish thesis versus bullish fab ramp catalysts.
Gamma-Based Support & Resistance Analysis
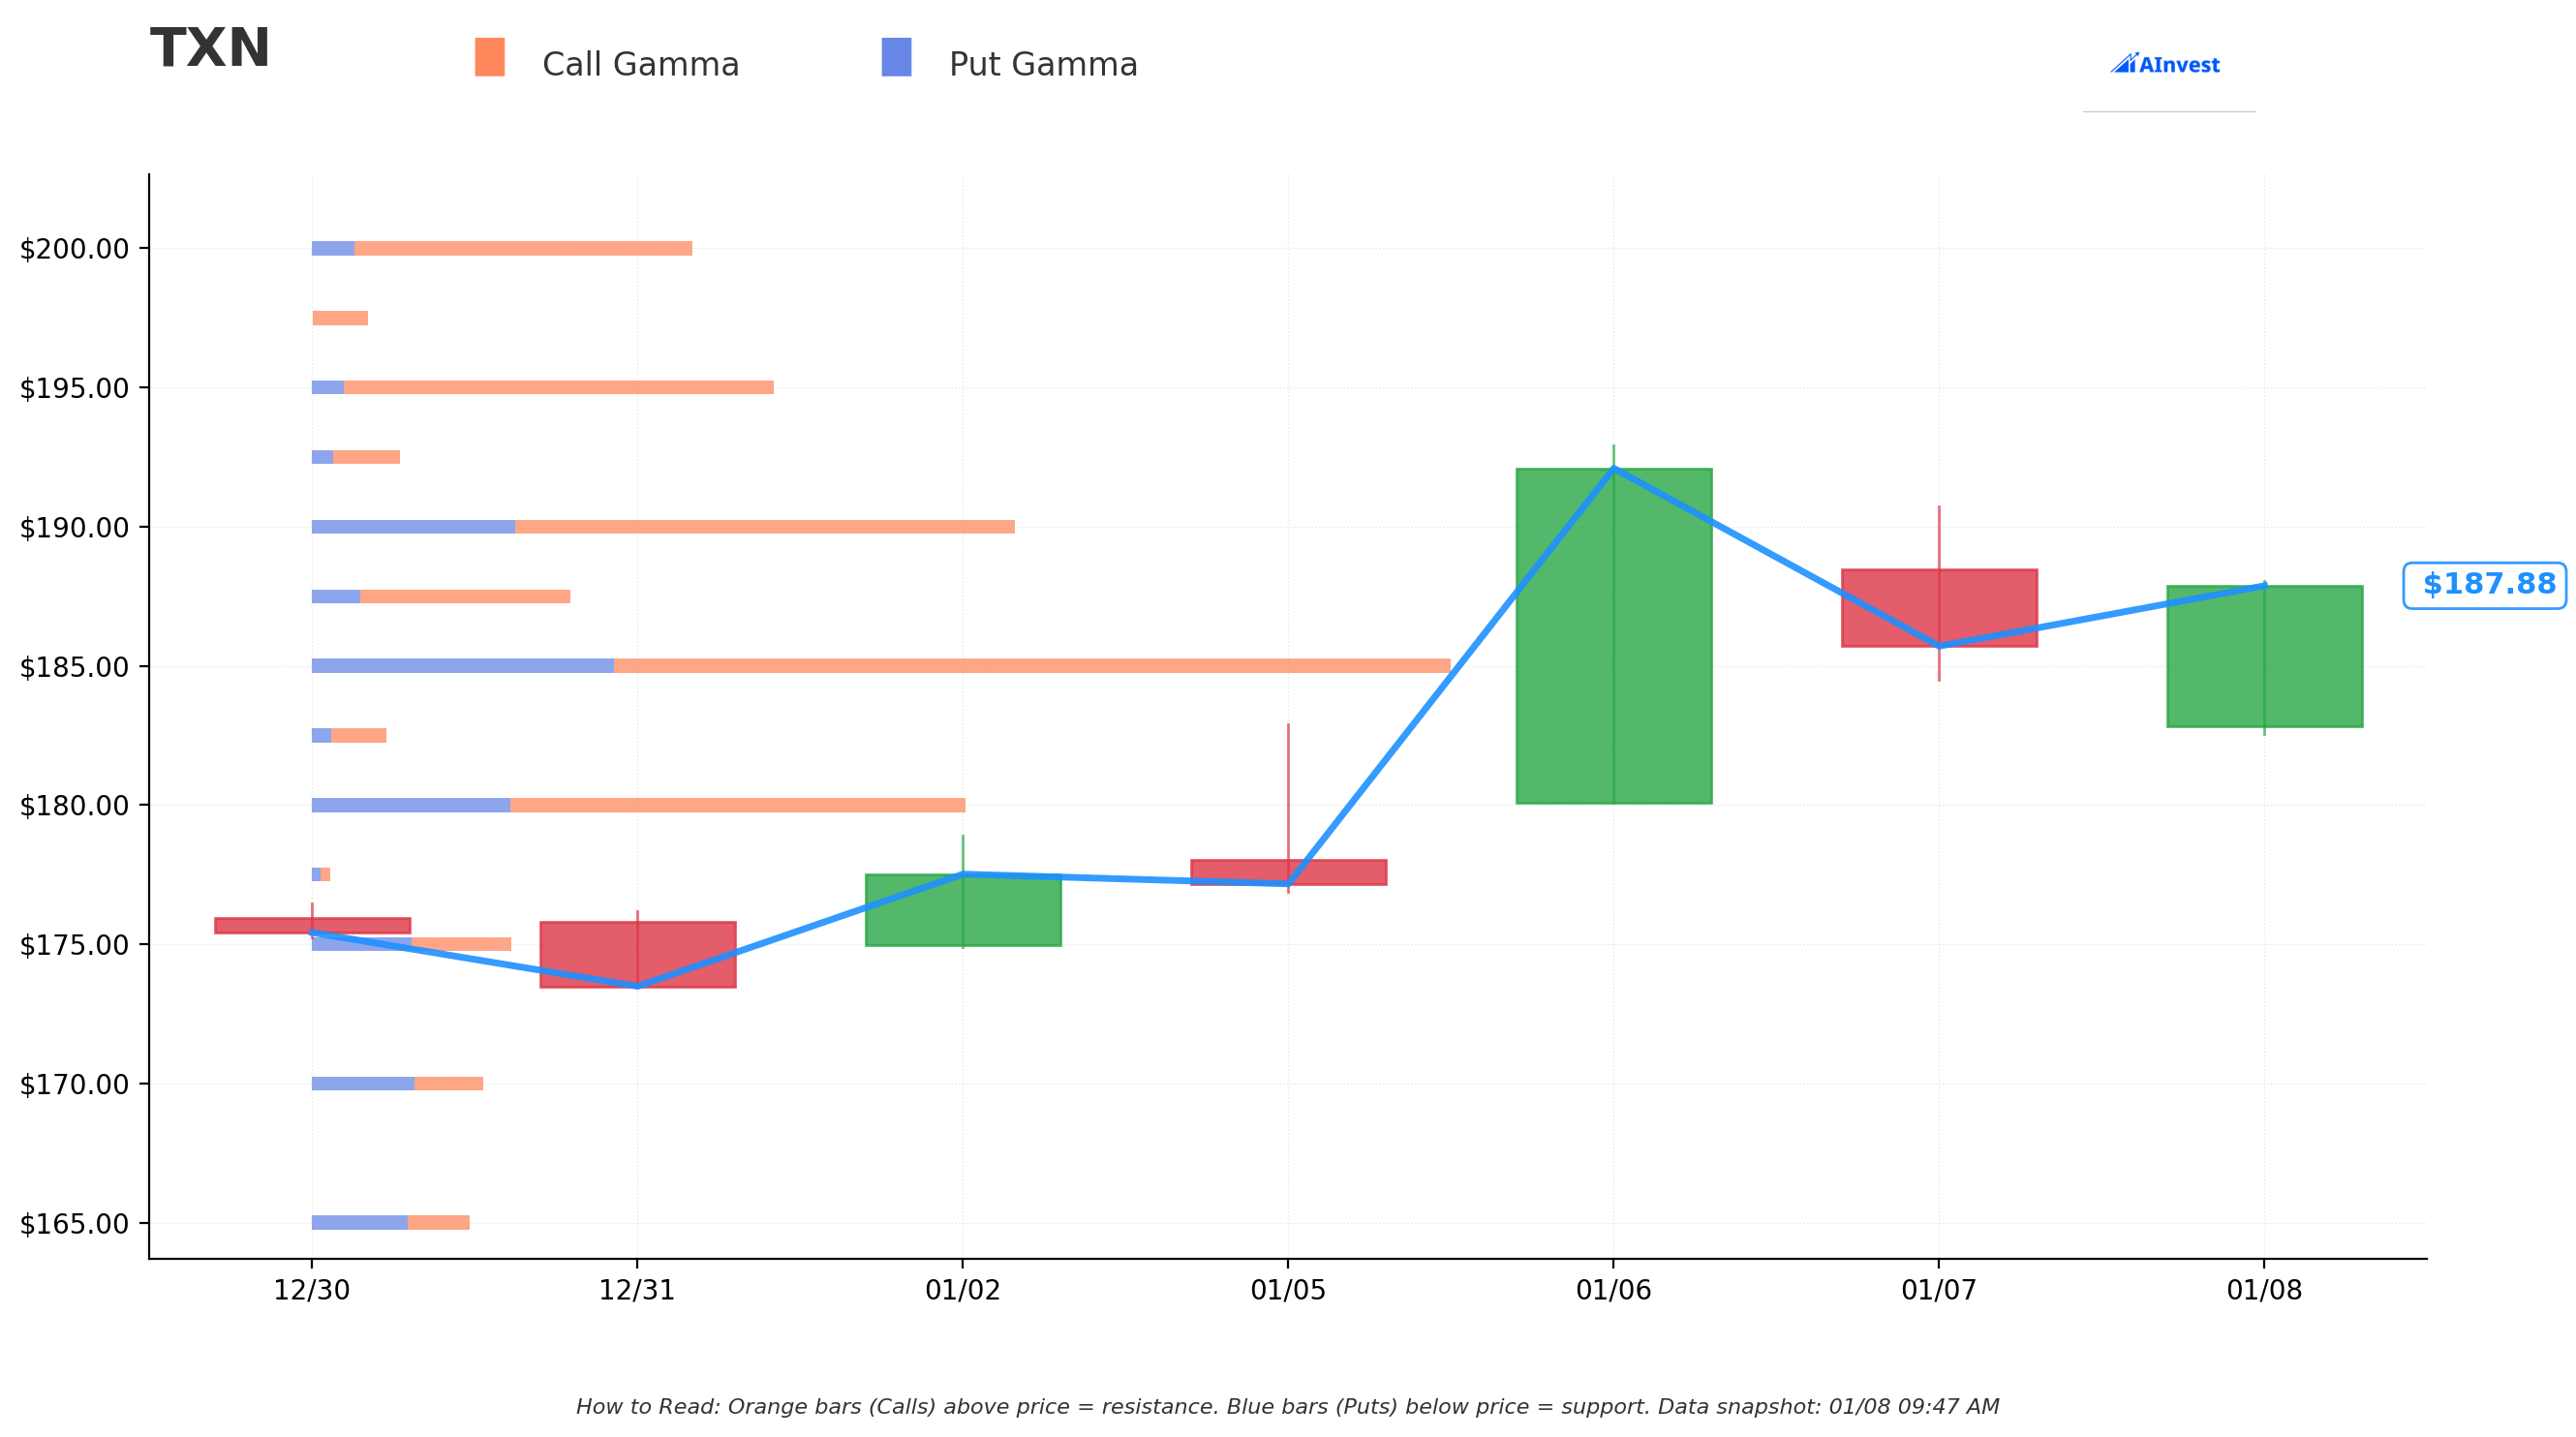
Reading the Gamma Chart:
- Orange bars (Call Gamma) = Resistance levels above current price
- Blue bars (Put Gamma) = Support levels below current price
- Bigger bars indicate stronger levels where market maker hedging creates price magnetism
Key Gamma Levels Identified:
| Level | Type | Strength | Notes |
|---|---|---|---|
| $200 | Call Resistance | Strong | Major psychological level with heavy call gamma |
| $195 | Call Resistance | Moderate | Near-term ceiling |
| $185 | Put Support | Strong | Heavy put gamma - matches the traded strike |
| $180 | Put Support | Moderate | Secondary support zone |
| $175 | Put Support | Strong | Major floor with concentrated put interest |
The $185 strike where this put was purchased shows significant gamma exposure, suggesting this level is a key battleground. A break below $185 could trigger accelerated selling as dealers hedge their put positions.
Implied Move Based Support & Resistance
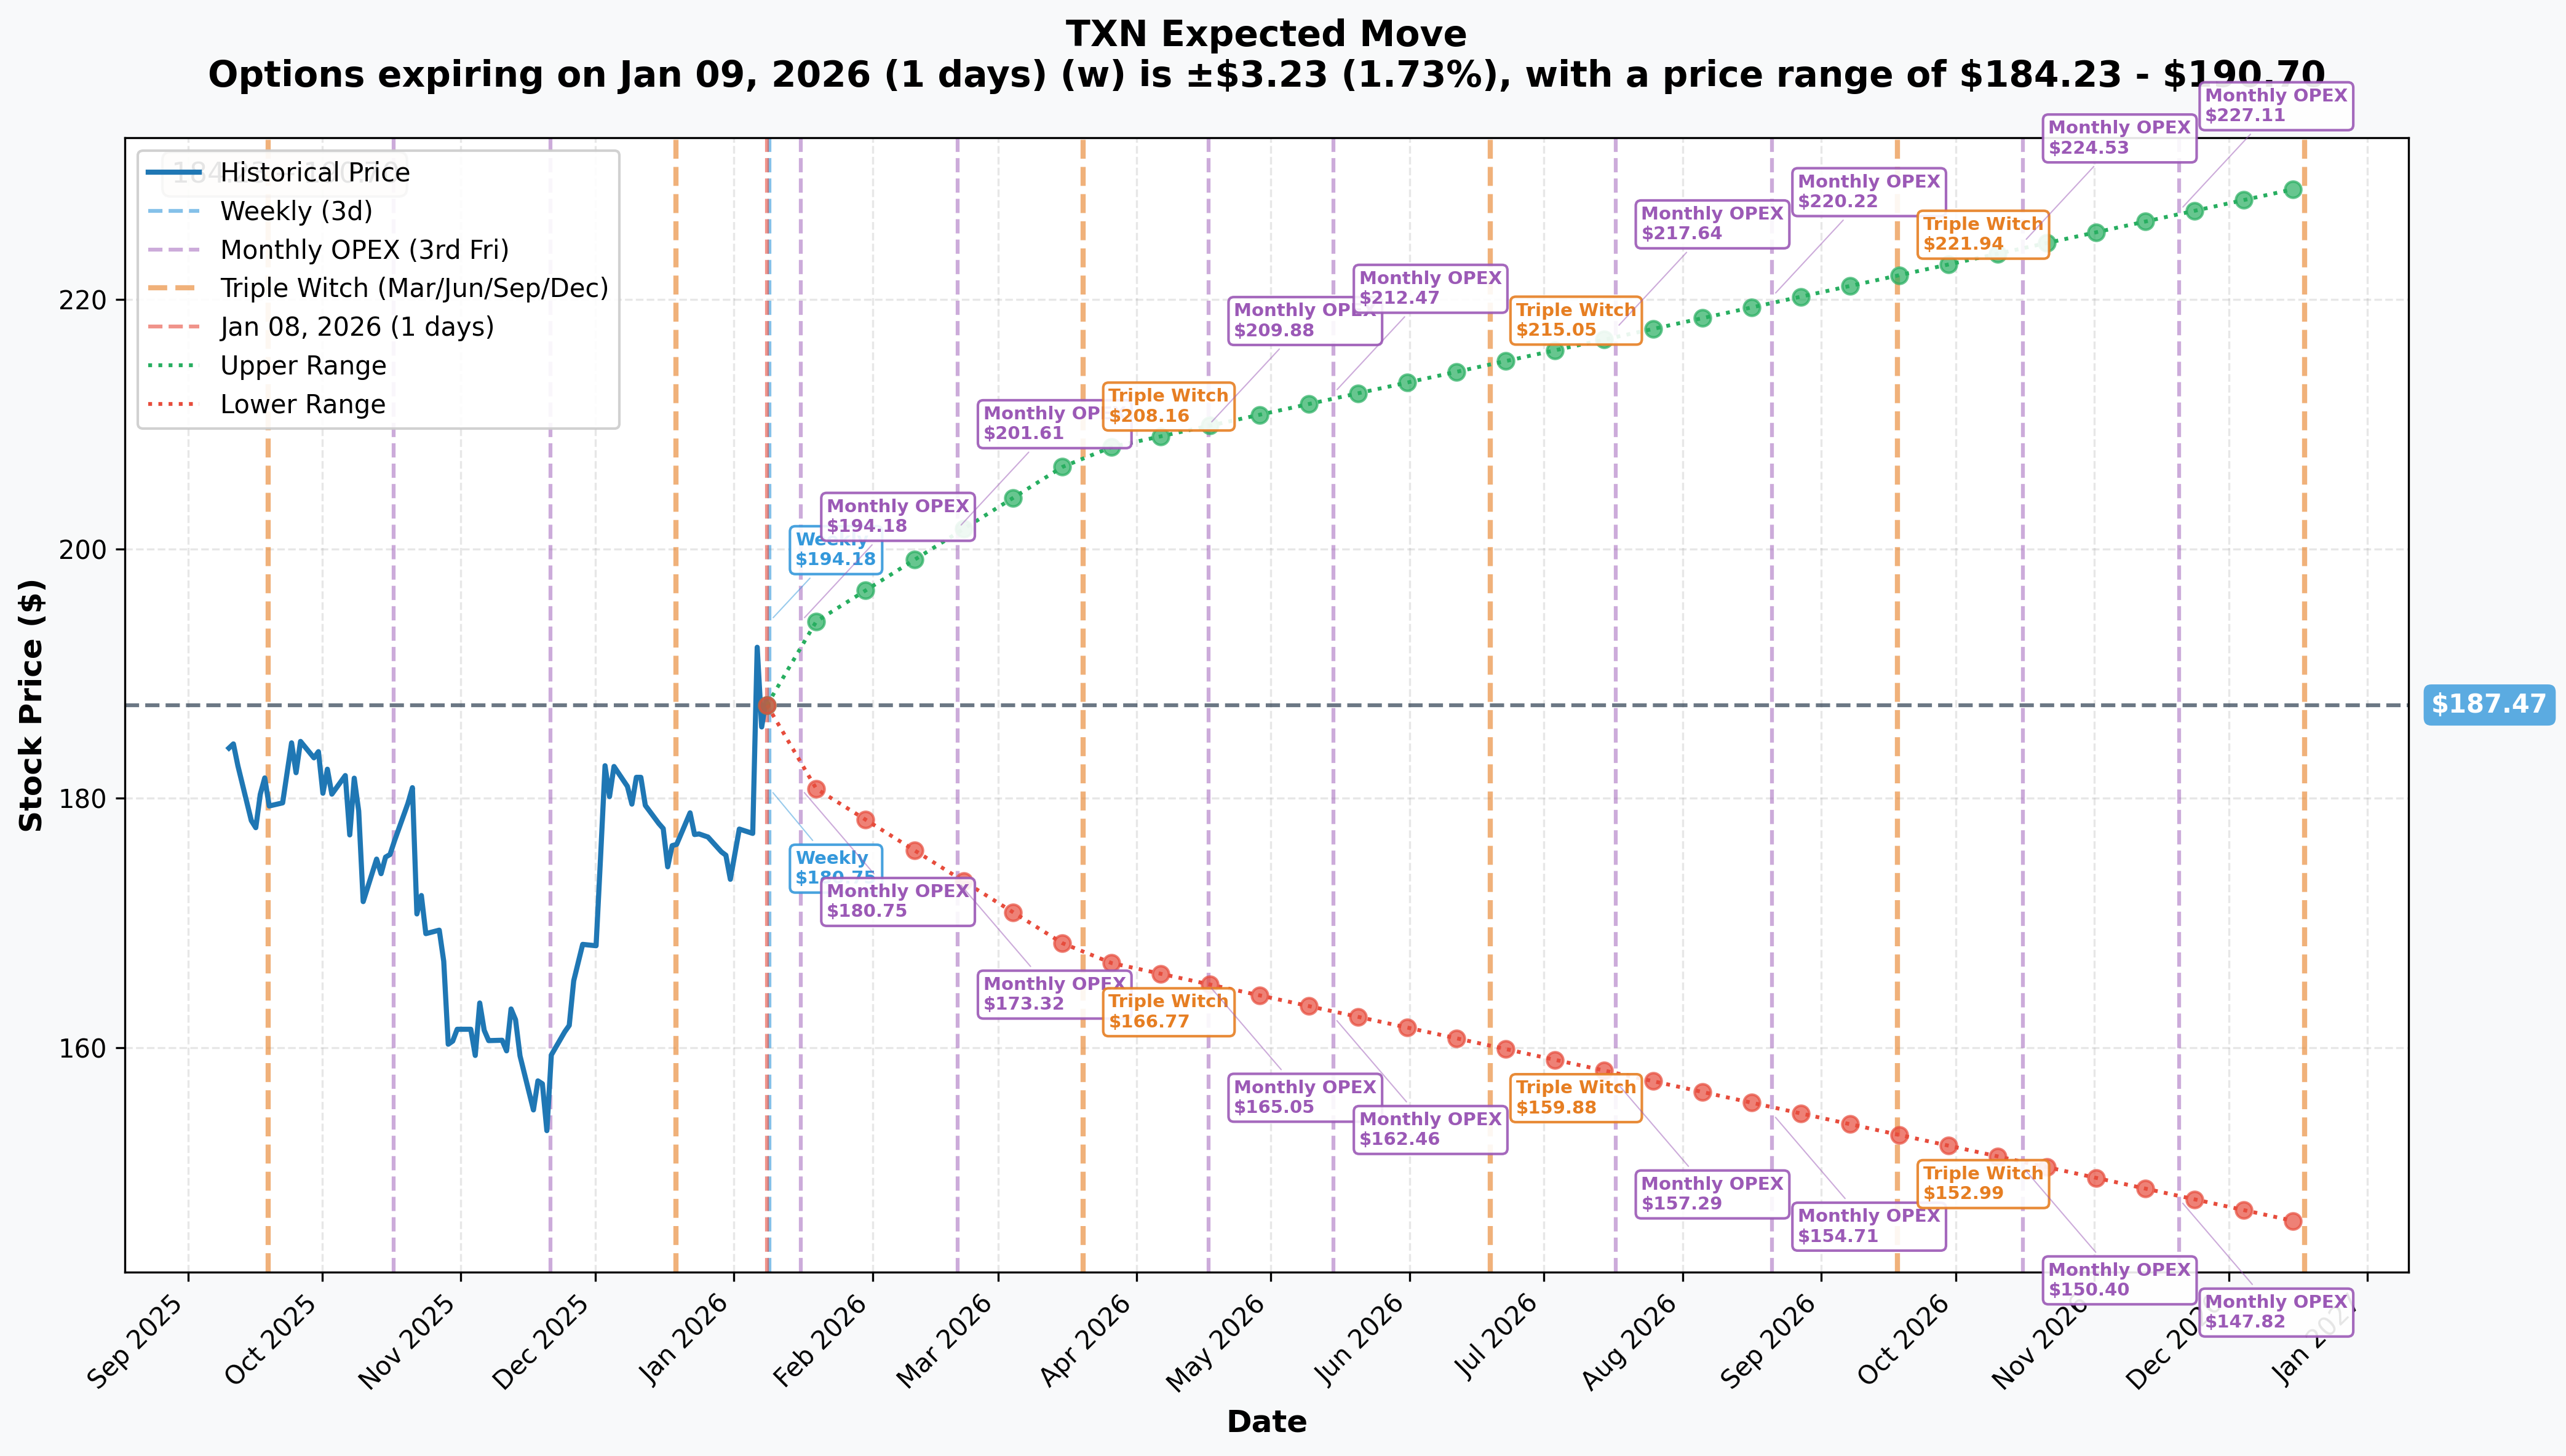
Current Implied Volatility Expectations:
| Timeframe | Expiry | Days to Expiry | Implied Move | Range |
|---|---|---|---|---|
| Weekly | 2026-01-09 | 1 | +/-1.73% | $184.23 - $190.70 |
| Monthly OPEX | 2026-01-16 | 8 | +/-3.22% | $181.43 - $193.50 |
| March Triple Witch | 2026-03-20 | 71 | +/-10.79% | $167.24 - $207.69 |
| June Triple Witch | 2026-06-18 | 161 | ~15% | $159.88 - $215.05 |
The June expiration (where this put expires) implies a potential move of roughly 15%, which translates to a range of approximately $159.88 to $215.05. The $185 strike sits comfortably within the lower end of this expected range, giving the trade a reasonable probability of being in-the-money at expiration.
Catalysts
Upcoming Events (Next 6 Months)
| Date | Event | Impact |
|---|---|---|
| January 27, 2026 | Q4 2025 Earnings (After Hours) | HIGH - Consensus: Revenue $4.45B, EPS $1.28 |
| February 1, 2026 | Analog Devices Price Hikes (10-30%) | MEDIUM - Industry tailwind |
| Q1 2026 | Data Center Segment Breakout | MEDIUM - First separate reporting |
| H1 2026 | LFAB2 (Utah) Production Ramp | MEDIUM - New capacity coming online |
| April 2026 | Q1 2026 Earnings | HIGH - First look at 2026 trajectory |
Recent Events (Already Happened)
| Date | Event | Outcome |
|---|---|---|
| December 17, 2025 | Sherman SM1 Fab Grand Opening | Positive - $40B facility now in production |
| December 15, 2025 | Goldman Sachs Double Downgrade | Negative - Cut from Buy to Sell, PT $156 |
| October 22, 2025 | Q3 2025 Earnings | Mixed - Beat on revenue ($4.74B), cautious guidance |
| August 2025 | 60,000+ Product Price Hikes (10-30%) | Positive - Margin support |
Price Targets & Probabilities
Based on gamma levels, implied moves, and catalyst analysis:
Bull Case: $200-$210 (25% probability)
- Q4 earnings beat with strong industrial/auto recovery
- Management raises 2026 guidance above consensus
- Data center segment exceeds 50% growth expectations
- Requires: Industrial demand acceleration + inventory normalization
- Gamma resistance at $195-$200 would need to break
Base Case: $175-$190 (50% probability)
- Q4 comes in-line with guidance ($4.22B-$4.58B revenue)
- Continued "slower than prior cycles" recovery commentary
- Stock remains range-bound ahead of 2026 clarity
- Current gamma equilibrium zone
Bear Case: $155-$175 (25% probability)
- Q4 misses on weak industrial/auto demand
- Guidance disappoints, inventory days increase
- Goldman's $156 target gains credibility
- Rising depreciation compresses margins more than expected
- Put gamma support levels break down sequentially
- This is the scenario the $2.7M put buyer is positioning for
Trading Ideas
Conservative: Cash-Secured Put or Covered Call
If you're bullish on TXN's long-term fundamentals but acknowledge near-term uncertainty:
Sell the TXN 2026-02-21 $175 Put
- Collect premium while waiting for a better entry
- If assigned, you own TXN at a ~7% discount to current price
- Risk: Stock falls below $175, you're obligated to buy
Why this works: You get paid to wait for a pullback. The $175 level has strong gamma support and represents a historically attractive entry point.
Balanced: Put Spread for Earnings Protection
Follow the institutional flow with defined risk:
Buy TXN 2026-01-31 $185 Put / Sell TXN 2026-01-31 $175 Put
- Max profit: ~$1,000 per spread if TXN closes below $175 at expiration
- Max loss: Net debit paid (premium of long put minus premium received from short put)
- Captures post-earnings downside with limited risk
Why this works: This captures the January 27 earnings risk with a defined-risk structure. The $185/$175 spread aligns with key gamma levels and gives you exposure to the same thesis as the $2.7M trader, but at a fraction of the cost.
Aggressive: Follow the Whale
Mirror the institutional trade at smaller scale:
Buy TXN 2026-06-18 $185 Put
- Direct replication of the $2.7M trade
- Long duration captures Q4 earnings, Q1 earnings, and multiple catalysts
- Breakeven around $169 (assuming ~$16 premium)
Why this works: You're riding alongside a trader who committed $2.7M with a Z-Score of 137.83. They clearly have conviction. The June expiration gives you time for the bearish thesis to play out through multiple earnings cycles. Just size appropriately - this is speculative.
Risk Factors
Risks to the Bearish Thesis:
- Earnings Beat: Strong Q4 with industrial/auto recovery could squeeze shorts
- Guidance Raise: If TI guides above consensus, Goldman's downgrade looks wrong
- Sector Rotation: Semiconductor stocks could rally on AI infrastructure spending
- Dividend Support: 3.1% yield provides downside cushion
- Institutional Buying: SM1 fab launch triggered 25% surge in institutional buying per Financial Content
Risks to the Bullish Thesis:
- Inventory Overhang: $4.8B inventory (215 days) could pressure margins
- Depreciation Headwinds: Rising from $1.8-$2.0B to $2.3-$2.7B in 2026 per TI Capital Management
- China Exposure: ~20% of revenue from China-headquartered customers
- Tariff Uncertainty: U.S.-China tensions affecting customer decisions
- Slower Recovery: Management noted "slower pace than prior upturns"
The Bottom Line
Here's the deal: A trader just put $2.7 million on the line betting TXN heads lower over the next five months. With a Z-Score of 137.83, this isn't normal activity - trades this size relative to average happen very rarely.
The timing is strategic: positioned ahead of Q4 earnings (January 27) with enough runway through June to capture multiple potential catalysts. Goldman's double downgrade to Sell with a $156 price target provides fundamental support for this bearish thesis, citing excess capacity, record inventory, and depreciation headwinds.
If you own TXN: Consider hedging into earnings. The $185 put activity suggests smart money sees risk to the downside.
If you're watching TXN: January 27 earnings is your decision point. A strong beat with raised guidance could invalidate this trade. A miss or weak guidance validates it.
If you're bearish on TXN: The June $185 put or a near-term put spread offers ways to express that view.
Mark your calendar: Q4 earnings January 27 after market close. Watch for inventory days, industrial segment commentary, and 2026 guidance.
Unusual Activity Score Analysis
| Metric | Value | Assessment |
|---|---|---|
| Premium | $2.7M | Large institutional-sized bet |
| Z-Score | 137.83 | 138 standard deviations above normal - extremely rare |
| Classification | EXTREMELY UNUSUAL | Top tier rarity |
| Volume/OI Ratio | 3.61 | HIGH ACTIVITY |
| Strategy | Long Put (Standalone) | Pure directional bearish bet |
| Confidence | MEDIUM | Order flow characteristics suggest informed positioning |
This trade ranks in the highest tier of unusual activity. A Z-Score of 137.83 indicates this volume level occurs extremely rarely - likely a few times per year at most for this ticker. Combined with the $2.7M premium and the strategic timing ahead of earnings, this warrants serious attention from traders watching TXN.
Disclaimer: This analysis is for informational purposes only and does not constitute investment advice. Options trading involves substantial risk of loss and is not suitable for all investors. Past performance does not guarantee future results. Always conduct your own research and consult with a qualified financial advisor before making investment decisions.
Data sources: Trade flow data, company information, and catalyst research compiled from multiple financial news sources cited inline.