🛢️ USO Bear Put Spread - $11.3M Oil Downside Play!
📅 October 24, 2025 | 🔥 Unusual Activity Detected
🎯 The Quick Take
Someone just executed an $11.3M bear put spread on USO this morning at 11:27 AM! This sophisticated institutional play involves selling $71 puts while buying $73 puts - collecting $1.7M net premium while betting oil stays weak through December. With crude at $62/barrel and massive oversupply forecasted into 2026, this trade is positioned for continued energy weakness. Translation: Big money thinks USO is heading lower!
📊 Company Overview
United States Oil Fund (USO) is an exchange-traded security that tracks daily price movements of West Texas Intermediate (WTI) crude oil:
- Asset Class: Commodity ETF (Oil Futures)
- Industry: Commodity Contracts Brokers & Dealers
- Net Assets: ~$976 million
- Primary Investment: Near-month WTI crude oil futures contracts on NYMEX
- Critical Note: USO suffers from contango drag - best for short-term tactical trading, NOT long-term holding
💰 The Option Flow Breakdown
📊 What Just Happened
The Tape (October 24, 2025 @ 11:27:07):
| Time | Symbol | Side | Buy/Sell | Type | Expiration | Premium | Strike | Volume | OI | Size | Spot | Option Price |
|---|---|---|---|---|---|---|---|---|---|---|---|---|
| 11:27:07 | USO $73 PUT | MID | BUY | PUT | 2025-12-19 | $6.5M | $73 | 20K | 64 | 20,000 | $74.15 | $3.25 |
| 11:27:07 | USO $71 PUT | MID | SELL | PUT | 2025-12-19 | $4.8M | $71 | 20K | 170 | 20,000 | $74.15 | $2.40 |
Option Symbols:
- Long Put: USO20251219P73
- Short Put: USO20251219P71
Net Debit: $0.85 per contract = $1.7M total invested ($3.25 - $2.40 = $0.85 × 20,000 contracts)
🤓 What This Actually Means
This is a bear put spread - a classic way to bet on downside with defined risk! The trader:
- ✅ Pays $6.5M to buy protective $73 puts
- ✅ Collects $4.8M by selling $71 puts to finance the play
- ✅ Maximum profit: $3.3M if USO drops to $71 or below ([$2.00 spread - $0.85 cost] × 20,000)
- ✅ Maximum loss: $1.7M (the net debit paid)
- ✅ Breakeven: $72.15 (bought strike $73 minus net debit $0.85)
- ✅ Days to expiration: 56 days
Unusual Score: 📉 NORMAL - While the dollar amount is significant at $6.5M, this represents typical institutional trading activity for USO. The unusual score analysis shows this is within the 6th percentile of USO trades, indicating normal rather than extreme activity. This is a strategic bearish position, not a panic trade.
Why this size makes sense: USO trades with high volume daily, and $6.5M represents standard institutional positioning. The real story here is the direction and timing - placing a bearish bet right as oil faces its biggest structural headwinds in years.
📈 Technical Setup / Chart Analysis
YTD Performance Chart
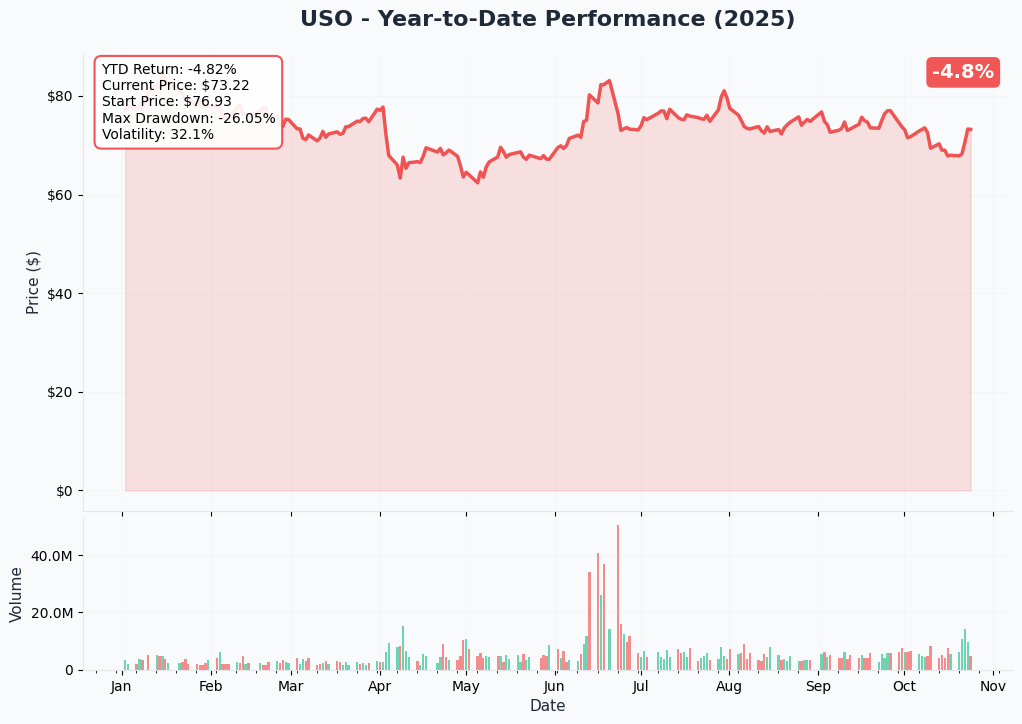
USO is down -3.4% year-to-date, reflecting the brutal oil market conditions. After starting the year around $76, USO has been grinding lower with the spot currently at $74.15. The chart shows a steady downtrend with lower highs and lower lows - classic bearish price action.
Key observations:
- Downward pressure: Oil oversupply narrative dominating
- Contango drag: USO structurally underperforming spot WTI due to negative roll yield
- Support zone: Currently testing the $73-74 area
- Resistance: Previous support at $76 now acting as ceiling
The technical setup aligns perfectly with the bear put spread - trader expects continuation of the downtrend toward $71 by mid-December.
Gamma-Based Support & Resistance Analysis
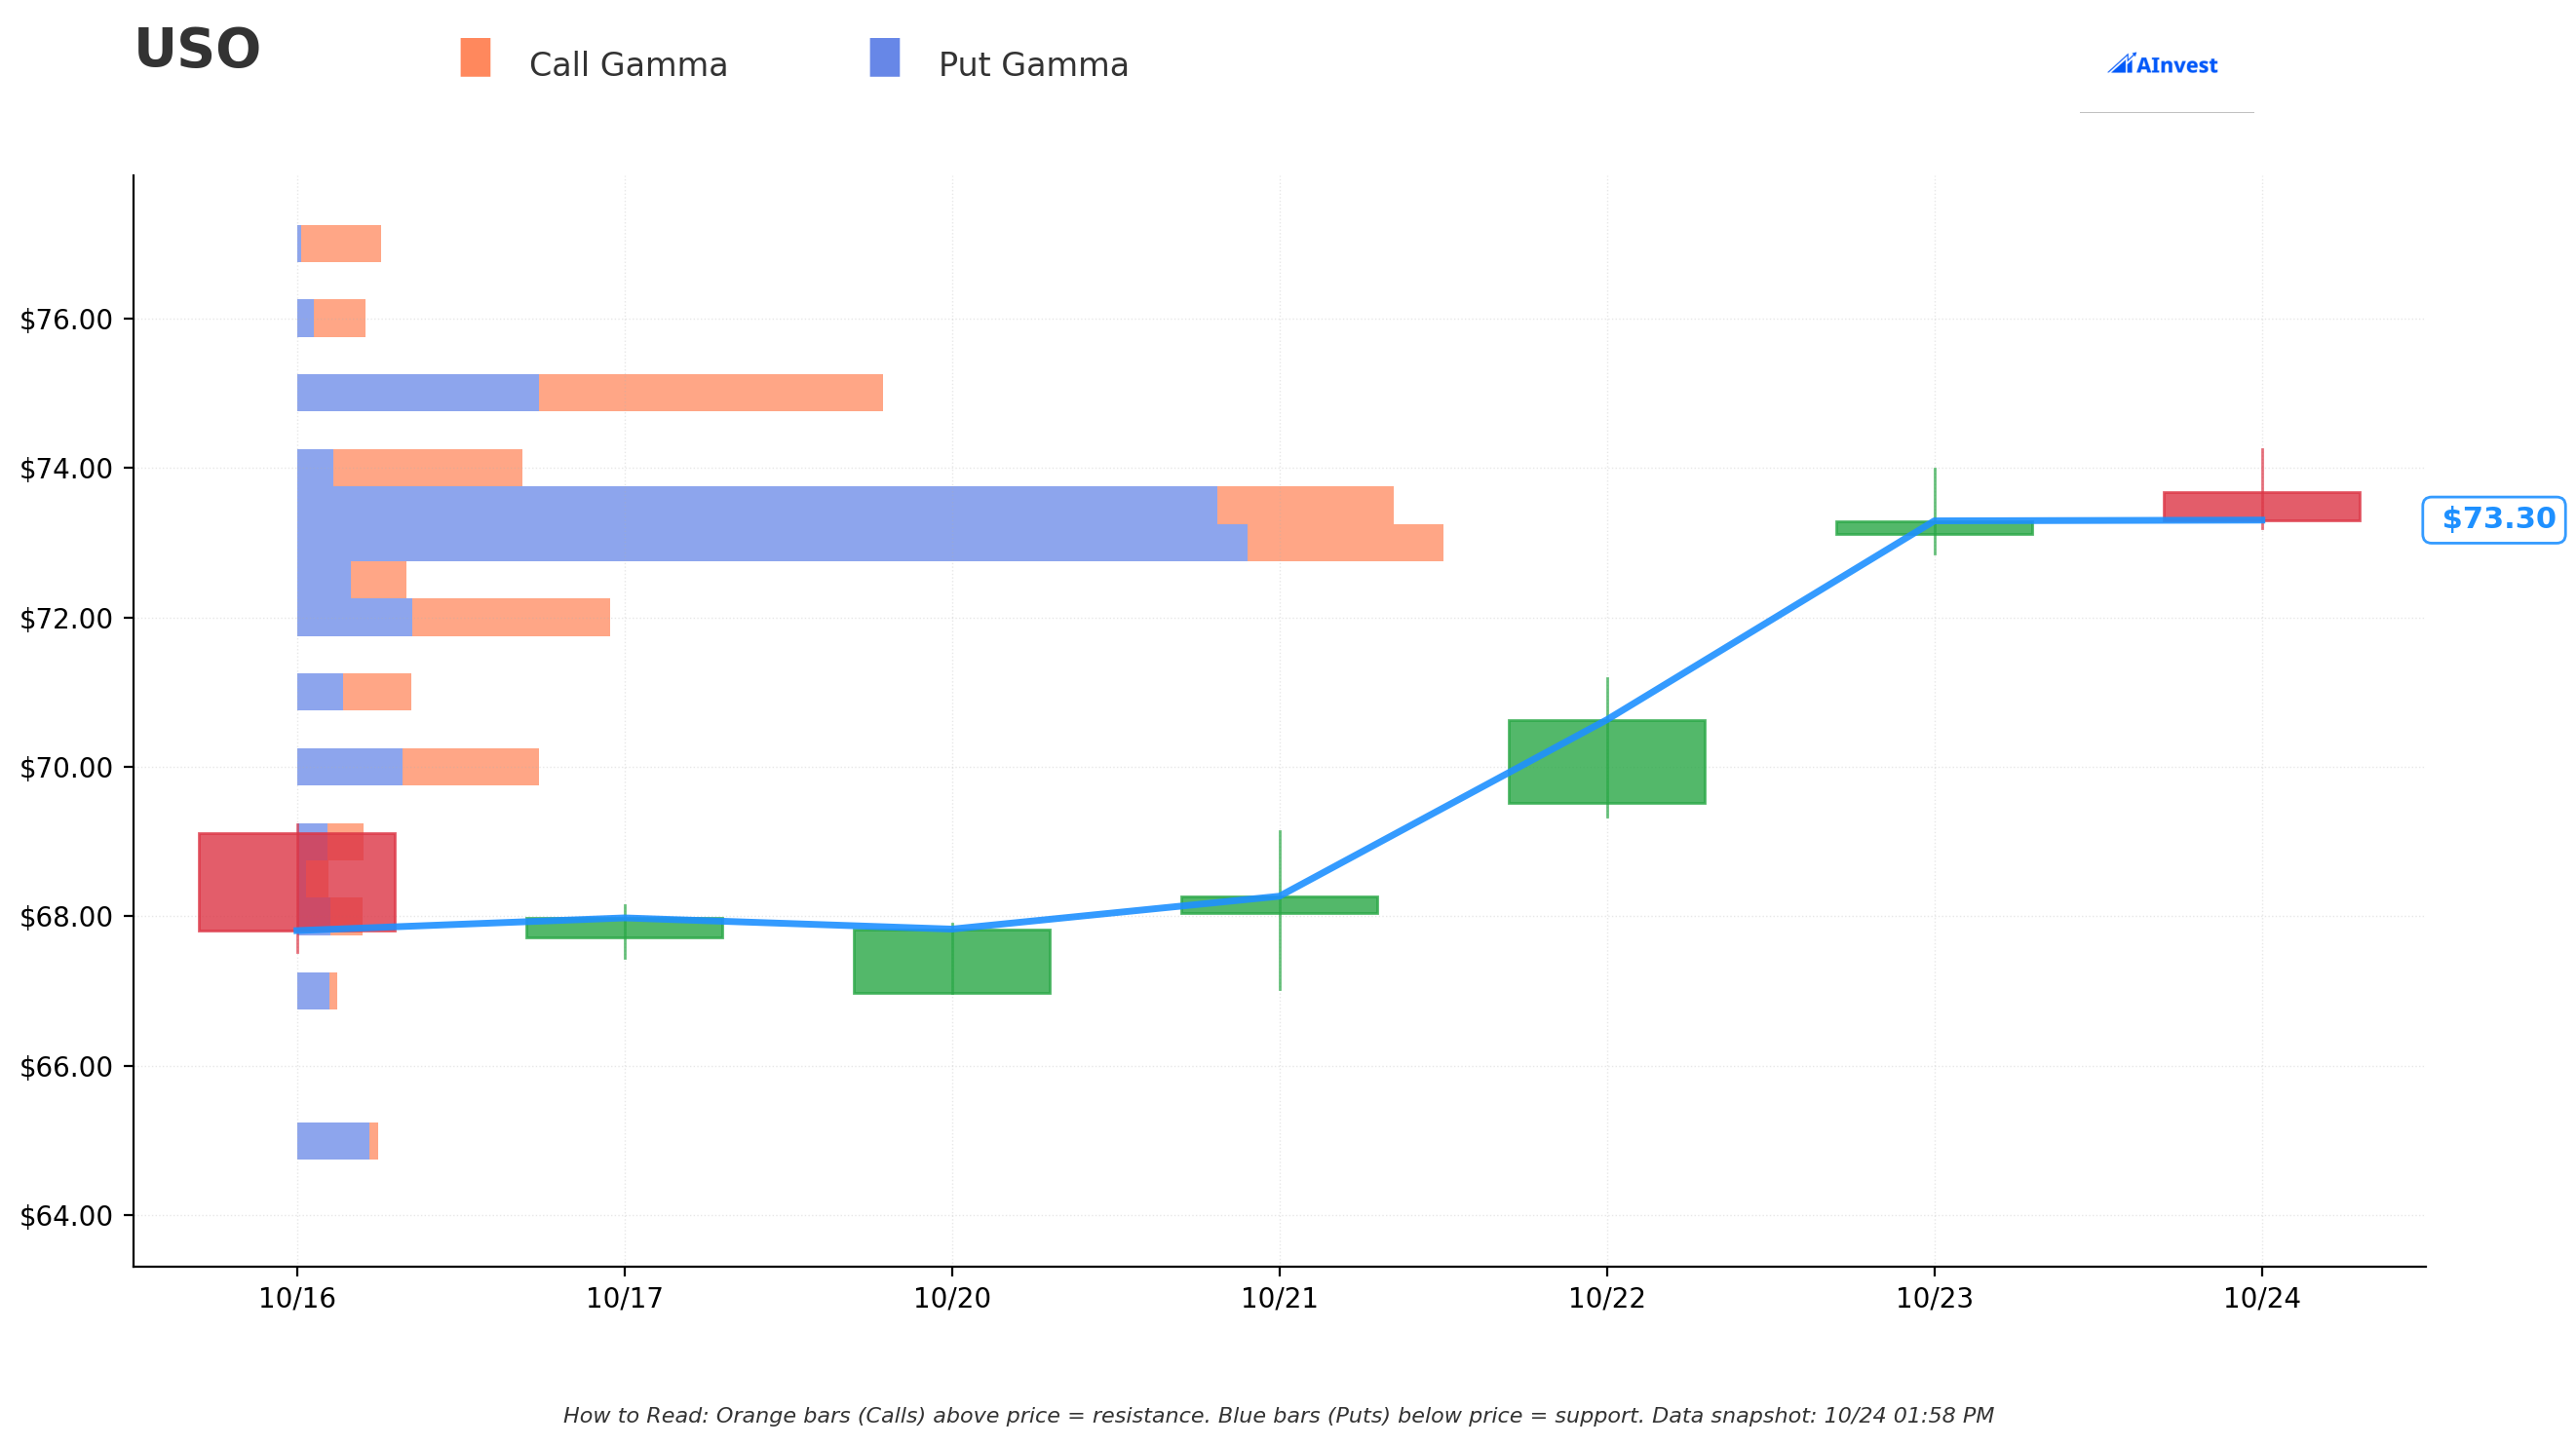
Current Price: $74.15
The gamma chart reveals critical levels that explain this bearish trade:
🔵 Support Levels (Put Gamma):
- $73.00: MASSIVE put wall with 32.3M GEX - this is where the long puts kick in (net GEX: -21.3M)
- $72.50: Minor support at 3.1M GEX
- $72.00: Moderate support at 8.8M GEX
- $71.00: Trade's profit zone at 3.2M GEX (where short puts activate)
- $70.00: Strong floor at 6.8M GEX
🟠 Resistance Levels (Call Gamma):
- $73.50: Heavy resistance at 30.9M GEX (net GEX: -20.9M bearish)
- $74.00: Moderate resistance at 6.4M GEX (net GEX: +4.3M)
- $75.00: Strong ceiling at 16.5M GEX
- $78.00: Major resistance at 12.5M GEX (+12.4M net bullish)
- $80.00: Distant resistance at 3.3M GEX
Net GEX Bias: Bearish (-8.2M put excess over calls)
What this means: The gamma profile shows dealers are net short puts and long calls, creating natural selling pressure on rallies above $74. The massive put wall at $73 acts as magnet - market makers will hedge by selling as price approaches this level, accelerating downside momentum. Perfect setup for the bear put spread!
🎪 Catalysts
Upcoming Events
OPEC+ Production Meeting - November 2, 2025
- Group already adding 137,000 bpd starting November
- OPEC+ unwinding 2.2 million bpd in voluntary cuts by September 2025
- More production increases could be announced - bearish for oil
U.S. Strategic Petroleum Reserve Purchase - December 2025
- Trump administration buying 1 million barrels for SPR
- Small volume but signals government price floor support
- Limited funding ($171M) constrains large-scale purchases
- Slightly bullish but insufficient to reverse trend
China Economic Data - November/December 2025
- Oil demand growth revised down to just 42,000-179,000 bpd for 2025-2026
- Peak oil demand projected at 15.4-16M bpd by 2025-2027
- China building strategic stocks at 900K bpd through August 2025
- Weak demand data would accelerate oil decline
EIA Inventory Reports - Weekly
- Global inventory builds estimated at 1.8-2.6 million bpd through Q4 2025
- U.S. crude stocks dropping week-on-week in late October
- But global picture remains oversupplied
Recently Completed
U.S. Sanctions on Russian Oil Companies - October 23, 2025
- Treasury sanctions on Rosneft and Lukoil announced
- WTI jumped 2-5.6% on supply disruption fears
- Sanctions target Russia's two largest oil producers and subsidiaries
- Short-term bullish catalyst already priced in
- Geopolitical premium providing temporary support
Iran Sanctions Enforcement Mixed Results
- Iran's September exports reached 2.13M bpd (highest of 2025)
- 87% going to China despite maximum pressure campaigns
- Sanctions proving less effective than hoped
WTI Technical Bounce from Support
- Crude bounced from $56-58 support zone
- Key resistance at $62-63.50 (50-day MA)
- Technical rally losing steam
Contango Deepening Through October 2025
- Crude oil futures shifted into deeper contango through October 2025
- Creates "sell low, buy high" scenario during monthly rollovers
- Negative roll yield accelerating USO underperformance
🎲 Price Targets & Probabilities
Using gamma levels, catalyst timing, and fundamental oil outlook:
🚀 Bull Case (20% chance)
Target: $76-78
What needs to happen:
- OPEC+ surprises with production cut reversal at November 2nd meeting
- Major Middle East supply disruption escalates
- China announces major economic stimulus boosting oil demand
- WTI breaks above $65/barrel resistance
For this trade: Maximum loss of $1.7M - spread would expire worthless
Key gamma resistance: $78 level has 12.5M GEX acting as ceiling
😐 Base Case (55% chance)
Target: $71-74 range
What needs to happen:
- Oil stays in current $58-62/barrel range per consensus forecasts
- Oversupply narrative continues as forecasted (1.8-2.6M bpd inventory builds)
- OPEC+ sticks to planned production increases
- Negative roll yield continues dragging USO lower
- China demand stays weak
For this trade: Partial to full profit depending on where price settles
- At $72: Profit of $1.0M (spread worth $1.00 vs $0.85 paid)
- At $71 or below: Maximum profit of $3.3M (spread worth $2.00)
Key gamma support: $73 level with 32.3M GEX provides natural landing zone
😰 Bear Case (25% chance)
Target: $68-71
What needs to happen:
- Oil crashes toward EIA's $52/barrel 2026 forecast early
- Global inventory glut accelerates beyond 2.6M bpd
- Demand destruction from economic slowdown
- OPEC+ abandons price support entirely
- USO contango drag accelerates
For this trade: Maximum profit of $3.3M achieved
Key gamma support: $70 level at 6.8M GEX provides final floor
💡 Trading Ideas
🛡️ Conservative: Follow the Smart Money (Smaller Size)
Play: Mini bear put spread (Dec 19th expiration)
Buy $73 puts, sell $72 puts (1:10 ratio of the institutional trade)
Cost: $850 per spread (1 contract) Risk: $850 maximum loss Reward: Up to $2,150 profit at $72 or below Probability: 55% chance of profit
Why this works: Mirrors the institutional positioning with defined risk and high conviction setup. Uses the massive $73 gamma support as your target zone.
⚖️ Balanced: Directional Put with Defined Exit
Play: Straight put purchase with gamma targets (Dec 19th)
Buy $73 puts outright, plan to exit at $71
Cost: $3.25 per contract ($325 per contract) Risk: Premium paid Reward: Scales with downside - target $2.00 profit at $71 ($200 gain) Probability: 50% chance oil weakness continues
Why this works: More leverage than the spread, but requires timing. The gamma walls at $73 and $71 give you clear entry/exit levels.
🚀 Aggressive: Leveraged Oil Decline (Farther OTM)
Play: Deep OTM puts banking on oil crash (Dec 19th)
Cost: $1.00-1.50 per contract Risk: Premium likely goes to zero Reward: 3-5x return if bear case unfolds Probability: 25% chance (the bear case scenario)
Why this works: If the EIA's forecast of $52 oil in 2026 starts materializing early, these become lottery tickets. High risk, high reward.
⚠️ Risk Factors
What Could Go Wrong for This Bearish Trade
🔥 Geopolitical Escalation
- Middle East tensions could explode overnight
- Iran/Israel conflict impacts oil shipping routes
- Russia sanctions actually bite harder than expected
- Sudden supply shocks could spike oil to $70+
📊 OPEC+ Policy Reversal
- November 2nd meeting could surprise with production cuts
- OPEC+ might prioritize price over market share
- Saudi Arabia could force cartel discipline
🇨🇳 China Stimulus Surprise
- Beijing announces major economic stimulus
- Oil demand revisions upward
- Strategic reserve filling accelerates beyond current 900K bpd
📈 Technical Bounce
- WTI at key support levels around $60
- Short covering rally possible
- Mean reversion to $65-68 range
⏰ Time Decay on Long Premium
- 56 days to expiration - theta working against you
- If oil stays flat at $74, spread loses value
- Need movement lower relatively soon
🔄 Contango Factors
- Contango has deepened through October
- Roll yield drag could accelerate USO decline faster than crude
- But this is already factored into bearish thesis
🎯 The Bottom Line
Real talk: This $11.3M bear put spread is a sophisticated way to bet on oil weakness with a clear risk/reward profile. The trader is risking $1.7M to make up to $3.3M if USO drops just 4% to $71 by December 19th.
The fundamental case is compelling:
- Oil oversupply of 1.8-2.6M bpd building through Q4
- China demand weak and peaking at 15.4-16M bpd
- OPEC+ increasing production by 137K bpd, not cutting
- EIA forecasting $62/barrel Q4 2025, $52/barrel in 2026
- USO's structural contango drag adding extra headwind
- Supply growth at 3x pace of demand growth
The technical case aligns: Gamma profile shows massive resistance at $73.50 and support cluster at $71-73 zone - exactly where this spread is positioned.
If you own USO or oil stocks: This trade suggests institutional money is hedging exposure. Consider trimming positions or buying protective puts.
If you're watching from sidelines: The November 2nd OPEC+ meeting is your first key catalyst. If they confirm production increases, this bearish thesis strengthens.
If you're bullish on oil: Wait for a clear break above $76 on USO (corresponding to WTI $65+) before fighting this trend. The structural oversupply narrative is powerful heading into 2026.
Mark your calendar:
- 📅 November 2, 2025: OPEC+ meeting
- 📅 December 19, 2025: Option expiration
- 📅 Watch weekly EIA inventory reports for confirmation
This is a smart, defined-risk way to play the oil weakness narrative. The size is appropriate for institutional money, and the strikes are strategically placed at key gamma levels. Not a YOLO trade - this is calculated positioning for what many analysts see as inevitable: lower oil prices heading into 2026.
Disclaimer: Options trading involves substantial risk. This analysis is for educational purposes only and not financial advice. USO is particularly risky due to contango drag and should only be used for short-term tactical trading. Past performance doesn't guarantee future results.
About USO: The United States Oil Fund (USO) is an exchange-traded security that tracks the daily price movements of West Texas Intermediate (WTI) light, sweet crude oil by investing primarily in near-month crude oil futures contracts. Due to contango and negative roll yield, USO is best suited for short-term tactical trading rather than long-term investment.