🛢️ USO: $11.6M Oil Call Sweep — 3 Strikes, 1 Bet on Crude Bouncing Back!
📅 March 12, 2026 | 🔥 Unusual Activity Detected
🎯 The Quick Take
Someone just dropped $11.6 MILLION sweeping USO calls across three different strikes simultaneously at 10:06:12 this morning — and this isn't some random speculative scatter shot. An institutional player bought the $120, $125, AND $130 calls all expiring March 27 in a single coordinated move, building a layered ladder of oil exposure right as WTI crude sits at the edge of a major bounce zone. Translation: A whale is betting $11.6M that crude oil has more upside left in this Hormuz-driven crisis — and they wanted exposure at multiple price points just in case.
📊 ETF Overview
United States Oil Fund (USO) is the largest and most liquid crude oil ETF in the U.S., designed to track near-term WTI crude oil price movements:
- What it actually is: USO holds front-month NYMEX WTI crude oil futures contracts and rolls them forward monthly — it does NOT hold physical barrels
- Current Price: $117.51 (up ~+1.5% from trade time of $115.78)
- AUM: ~$2.36 billion (more than doubled from ~$1.05B pre-Hormuz crisis)
- 52-Week Range: $60.67 – $124.07
- YTD Performance: +57.82% (started 2026 near $74, now at $117.51)
- Issuer: USCF Investments
- Expense Ratio: 0.70%
- Tax Note: Issues K-1 forms (not 1099s) — talk to your accountant!
One critical thing to understand about USO pricing: USO at ~$115 roughly corresponds to WTI crude at $94–$98/barrel — this is NOT a 1:1 ratio with oil prices due to the futures roll mechanism, contango/backwardation effects, and the fund's own share price structure. Right now, USO is in steep backwardation (crisis-driven), which actually gives the fund a positive roll yield — an unusual bonus for USO holders during the current Hormuz shock.
💰 The Option Flow Breakdown
📊 What Just Happened — The Tape (March 12, 2026 @ 10:06:12)
| Time | Symbol | Side | Buy/Sell | Type | Expiration | Strike | Premium | Volume | OI | Size | Spot | Option Price | Contract |
|---|---|---|---|---|---|---|---|---|---|---|---|---|---|
| 10:06:12 | USO | MID | BUY | CALL $125 | 2026-03-27 | $125 | $5.8M | 5,200 | 3,200 | 5,200 | $115.78 | $11.11 | USO20260327C125 |
| 10:06:12 | USO | MID | BUY | CALL $120 | 2026-03-27 | $120 | $3.3M | 2,900 | 6,300 | 2,600 | $115.78 | $12.73 | USO20260327C120 |
| 10:06:12 | USO | MID | BUY | CALL $130 | 2026-03-27 | $130 | $2.5M | 2,700 | 478 | 2,600 | $115.78 | $9.66 | USO20260327C130 |
Combined Total Premium: ~$11.6 Million | All executed at exactly 10:06:12
🤓 What This Actually Means
Three simultaneous buys. Same expiry. Same second. This is textbook institutional call ladder — not three separate trades from three different people. One player hit all three strikes at the exact same time:
- 💸 $120 calls ($3.3M): The "closest to the money" leg — only 3.6% above spot. High probability of profit if oil bounces. At $12.73/contract with 2,600 size, this is the "bread and butter" leg. OI was already 6,300 meaning there's existing interest at this level.
- 💸 $125 calls ($5.8M — the biggest leg!): The "sweet spot" bet — 7.9% above spot, requiring a meaningful oil move. At $11.11 with 5,200 contracts, this is where the conviction lives. Interestingly, brand new OI (only 3,200 prior), suggesting this strike was freshly targeted.
- 💸 $130 calls ($2.5M): The "lottery ticket" piece — 12.3% above spot, requires USO to get close to its 52-week high of $124.07. The 478 prior OI on this strike screams "nobody was there before" — this trader essentially opened this position.
The strategy here is a call sweep ladder. By buying across all three strikes, the trader maximizes exposure to an oil price move at multiple points. If USO goes to $122, the $120s win big, the $125s appreciate, and the $130s start ticking higher. If oil really rips and USO tests the $124+ 52-week high, ALL three strikes are in play. This isn't someone just picking one number — this is a trader who wants to be in the oil trade regardless of exactly how far it goes.
Why mid price? The "MID" side classification (between bid and ask) suggests this wasn't a panic buyer hitting the ask — they negotiated price on a large block. This is sophisticated execution.
Unusual Score: 🔥 EXTREME — USO typically sees a fraction of this single-name call activity. Buying across three OTM strikes simultaneously with $11.6M total premium is something that happens a handful of times per year at best in this fund. The $130 strike had only 478 OI — this trader created the open interest.
📈 Technical Setup / Chart Check-Up
YTD Performance Chart
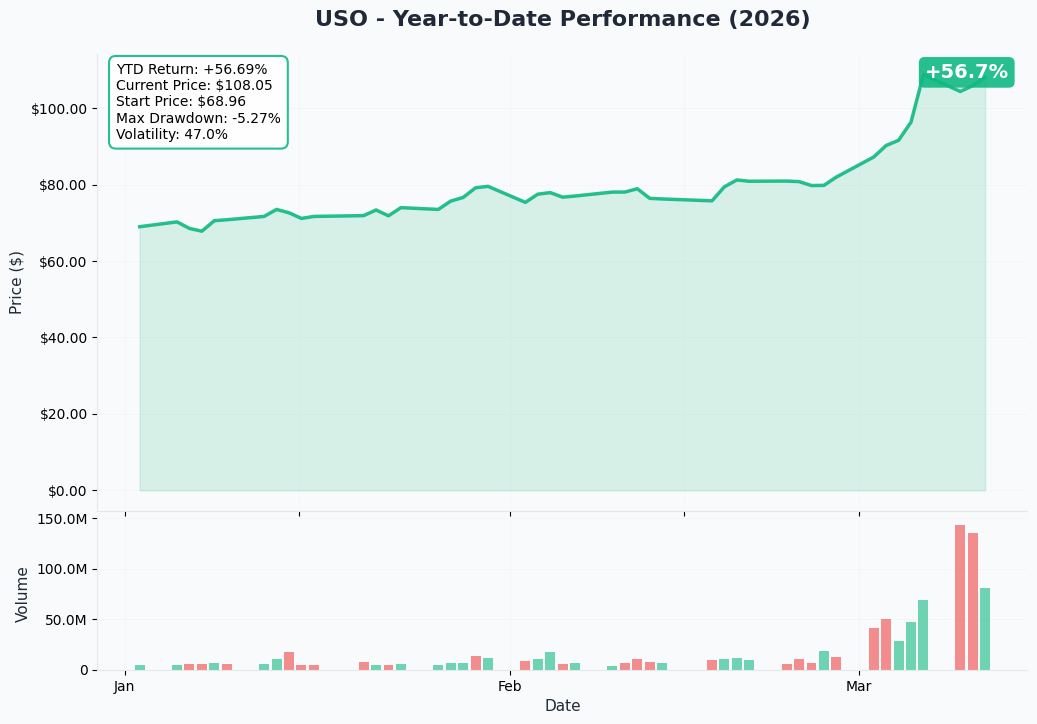
Real talk — this chart is WILD. USO started 2026 near $74 and is now at $117.51, a gain of nearly +58% in under 3 months. The price action tells the entire Hormuz crisis story: relatively flat through January, then a near-vertical spike starting late February when U.S.-Israel strikes on Iran began on February 28, 2026, rocketing to a 52-week high of $124.07 on March 3. Since then, USO has pulled back to the $107–$117 range as the IEA's record 400 million barrel reserve release created some selling pressure.
Key observations from the YTD chart:
- 🚀 Explosive breakout: 58% YTD gain driven entirely by a single macro shock
- 📉 Current pullback: USO retraced roughly 5-8% from the March 3 high — currently consolidating
- 🎢 Volatility regime: This is NOT normal ETF behavior — daily swings of 3-5%+ have become routine
- 📊 Current range: $107–$120 appears to be the new "base" while the war news digests
Gamma-Based Support & Resistance Analysis
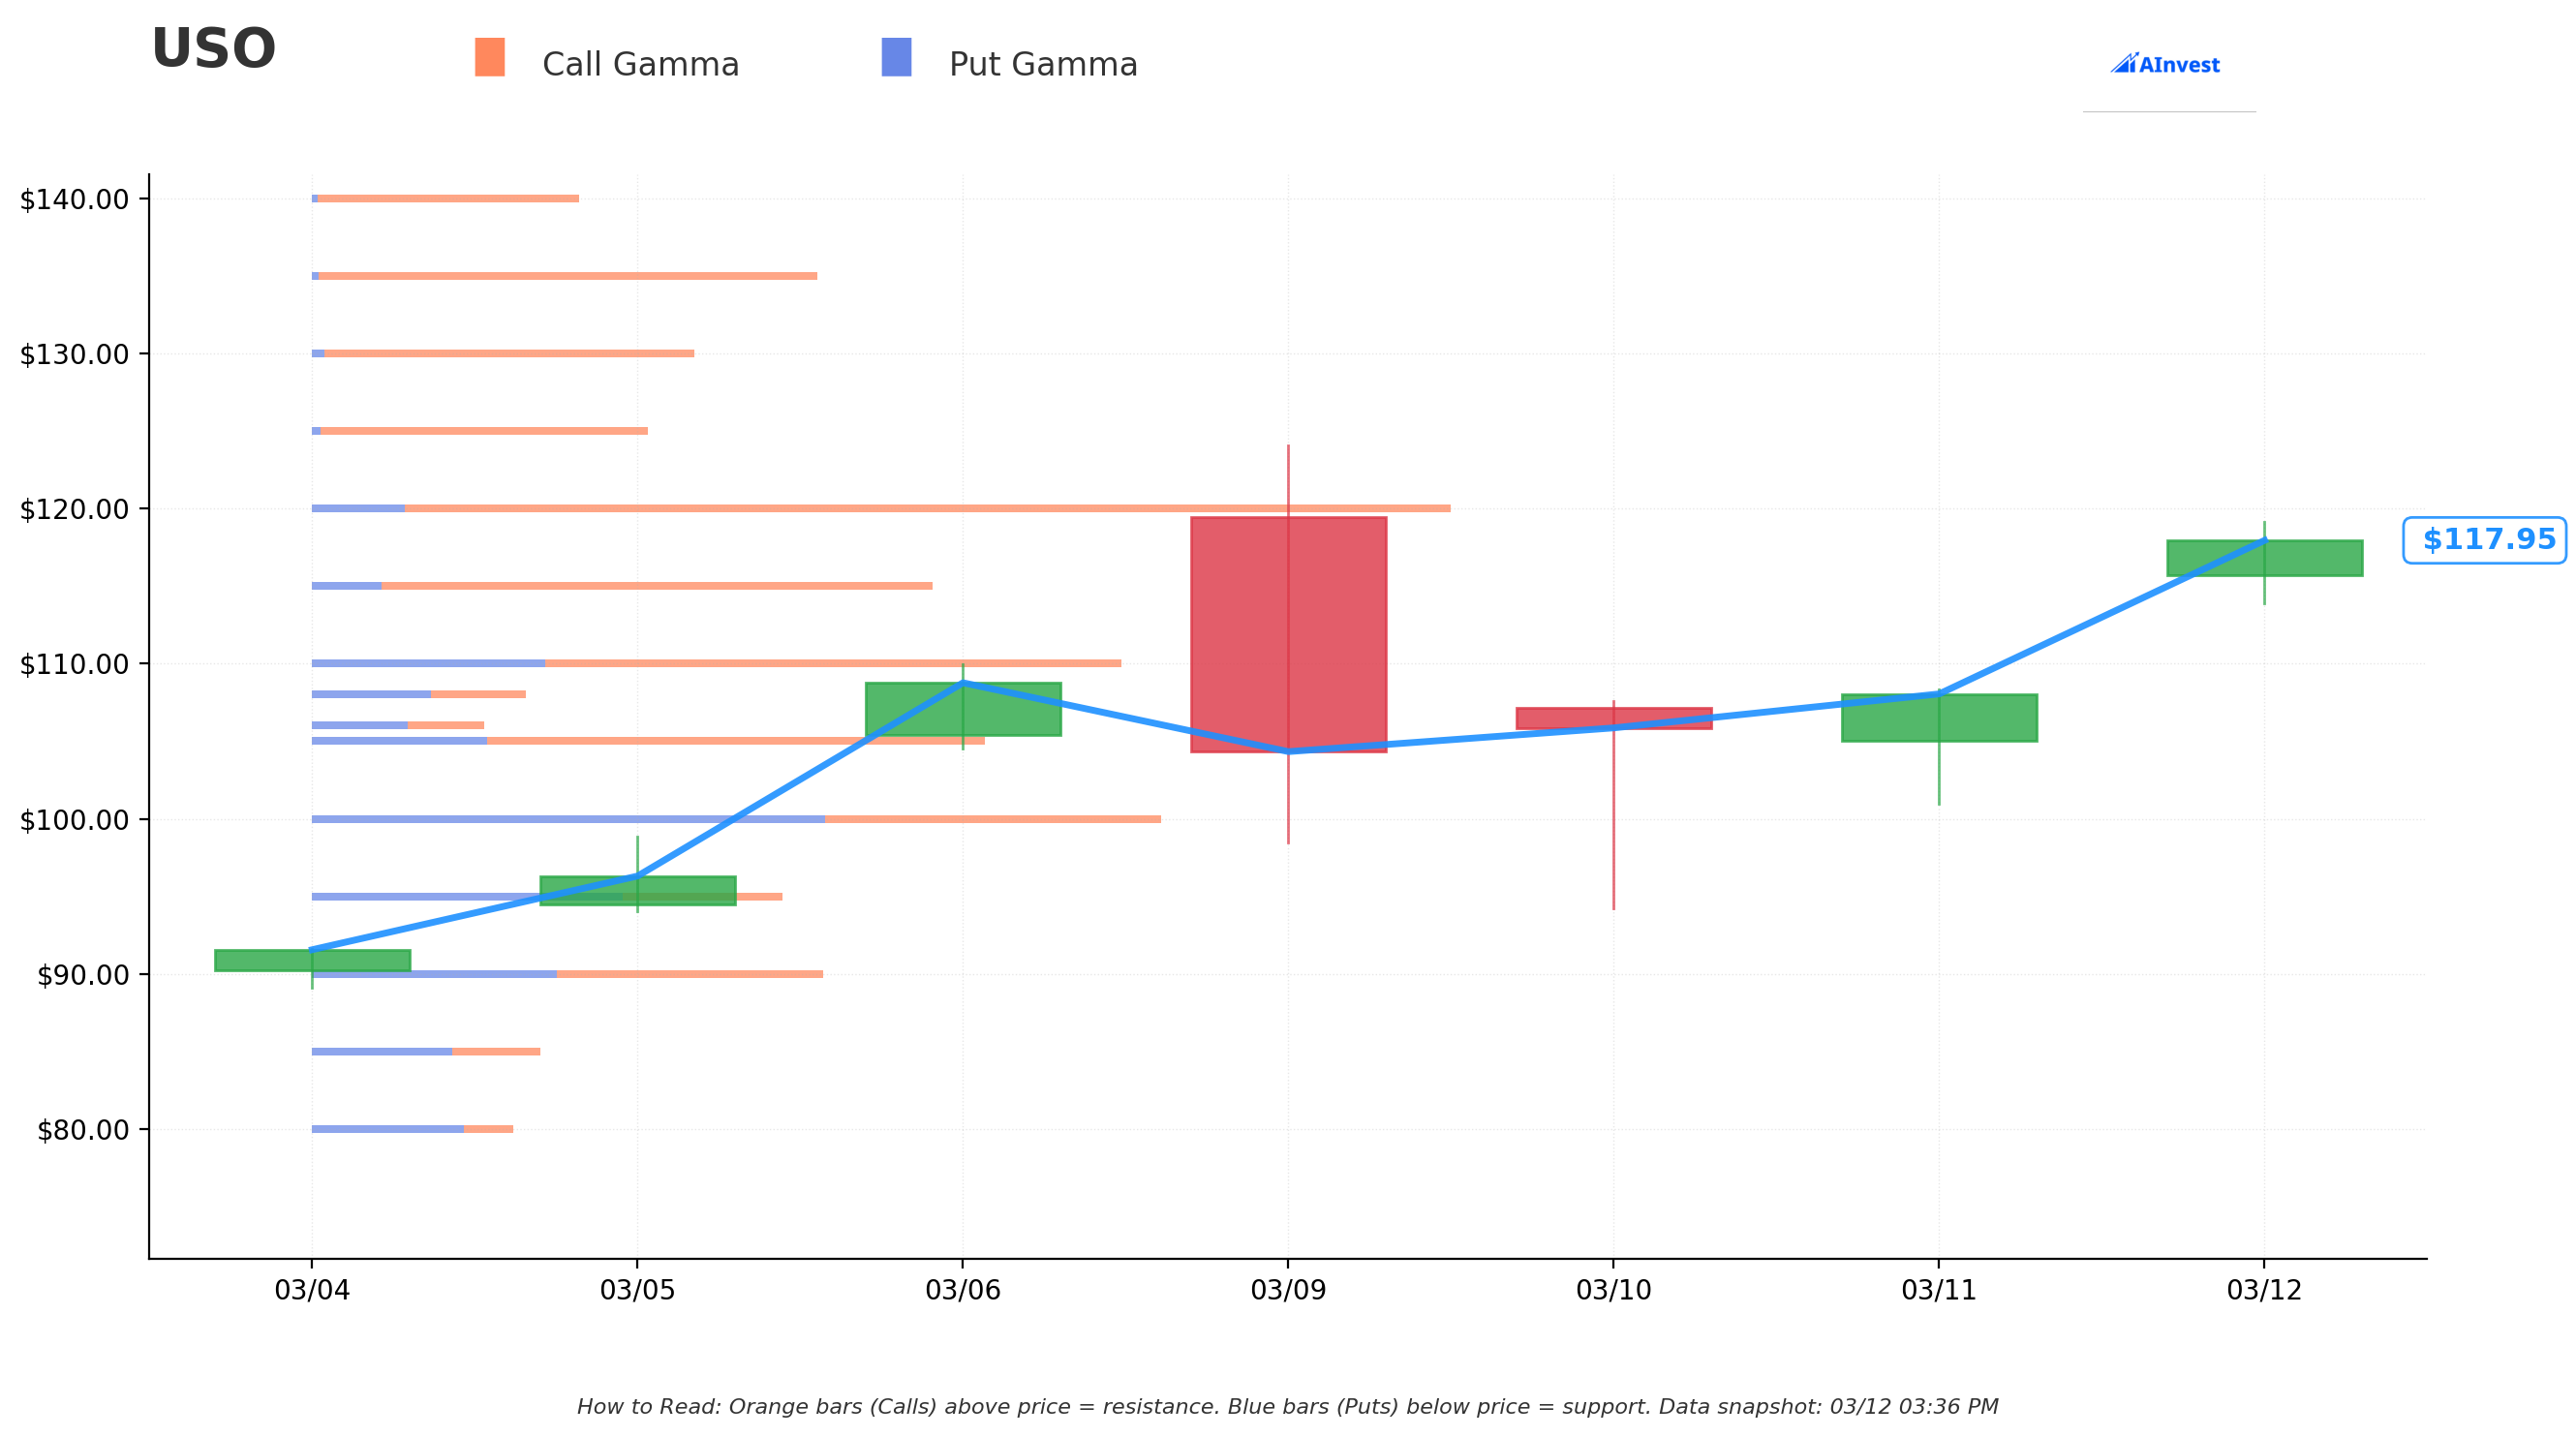
Current Price: $117.51
The gamma exposure map is genuinely striking — and here's the wild part: all three strikes in today's sweep land exactly on major gamma resistance levels. That's not a coincidence.
🔵 Support Levels (Where Buyers Step In Below Current Price):
- $115 — Nearest support at 5.76 total gamma. This is USO's line in the sand — the level market makers defend most aggressively right below us. Notice today's trade time spot was $115.78 — we're essentially sitting right on this level.
- $110 — Second support at 7.58 total gamma (actually stronger than $115!). If $115 cracks, this is the next stop. Represents ~6.4% downside from here.
- $105 — Third support at 6.30 total gamma (~10.6% below current price)
- $100 — Big psychological floor at 8.04 total gamma (~14.9% below). This is the "disaster scenario" support — and it's still within the monthly implied move range!
- $95 — Deep support at 4.52 total gamma (~19.2% below)
🟠 Resistance Levels (Where Sellers Push Back Above Current Price):
- $120 — STRONGEST immediate resistance at 10.59 total gamma — also the lowest strike in today's sweep! Only 2.1% above current price. Market makers have MAXIMUM resistance here, which explains why this was the "safe" leg — it's the most likely to be tested.
- $125 — Second resistance at 3.13 total gamma (6.4% above) — also the middle strike in today's sweep. Notably lighter resistance than $120, meaning if $120 breaks, $125 could give way faster.
- $130 — Third resistance at 3.57 total gamma (10.6% above) — also the top strike in today's sweep.
- $135 — Extended resistance at 4.70 total gamma
- $140 — Far resistance at 2.50 total gamma
🧠 The gamma insight that makes this sweep remarkable:
The trader swept EXACTLY the $120, $125, and $130 gamma resistance levels — all three. They're not randomly picking strikes. They're systematically building exposure at every major overhead barrier that USO needs to break through on a real oil rally. This is a trader who knows the gamma map. GEX Bias: Bullish — call GEX of 66.56 vs put GEX of 36.30 shows overall dealer positioning leans bullish.
Implied Move Analysis
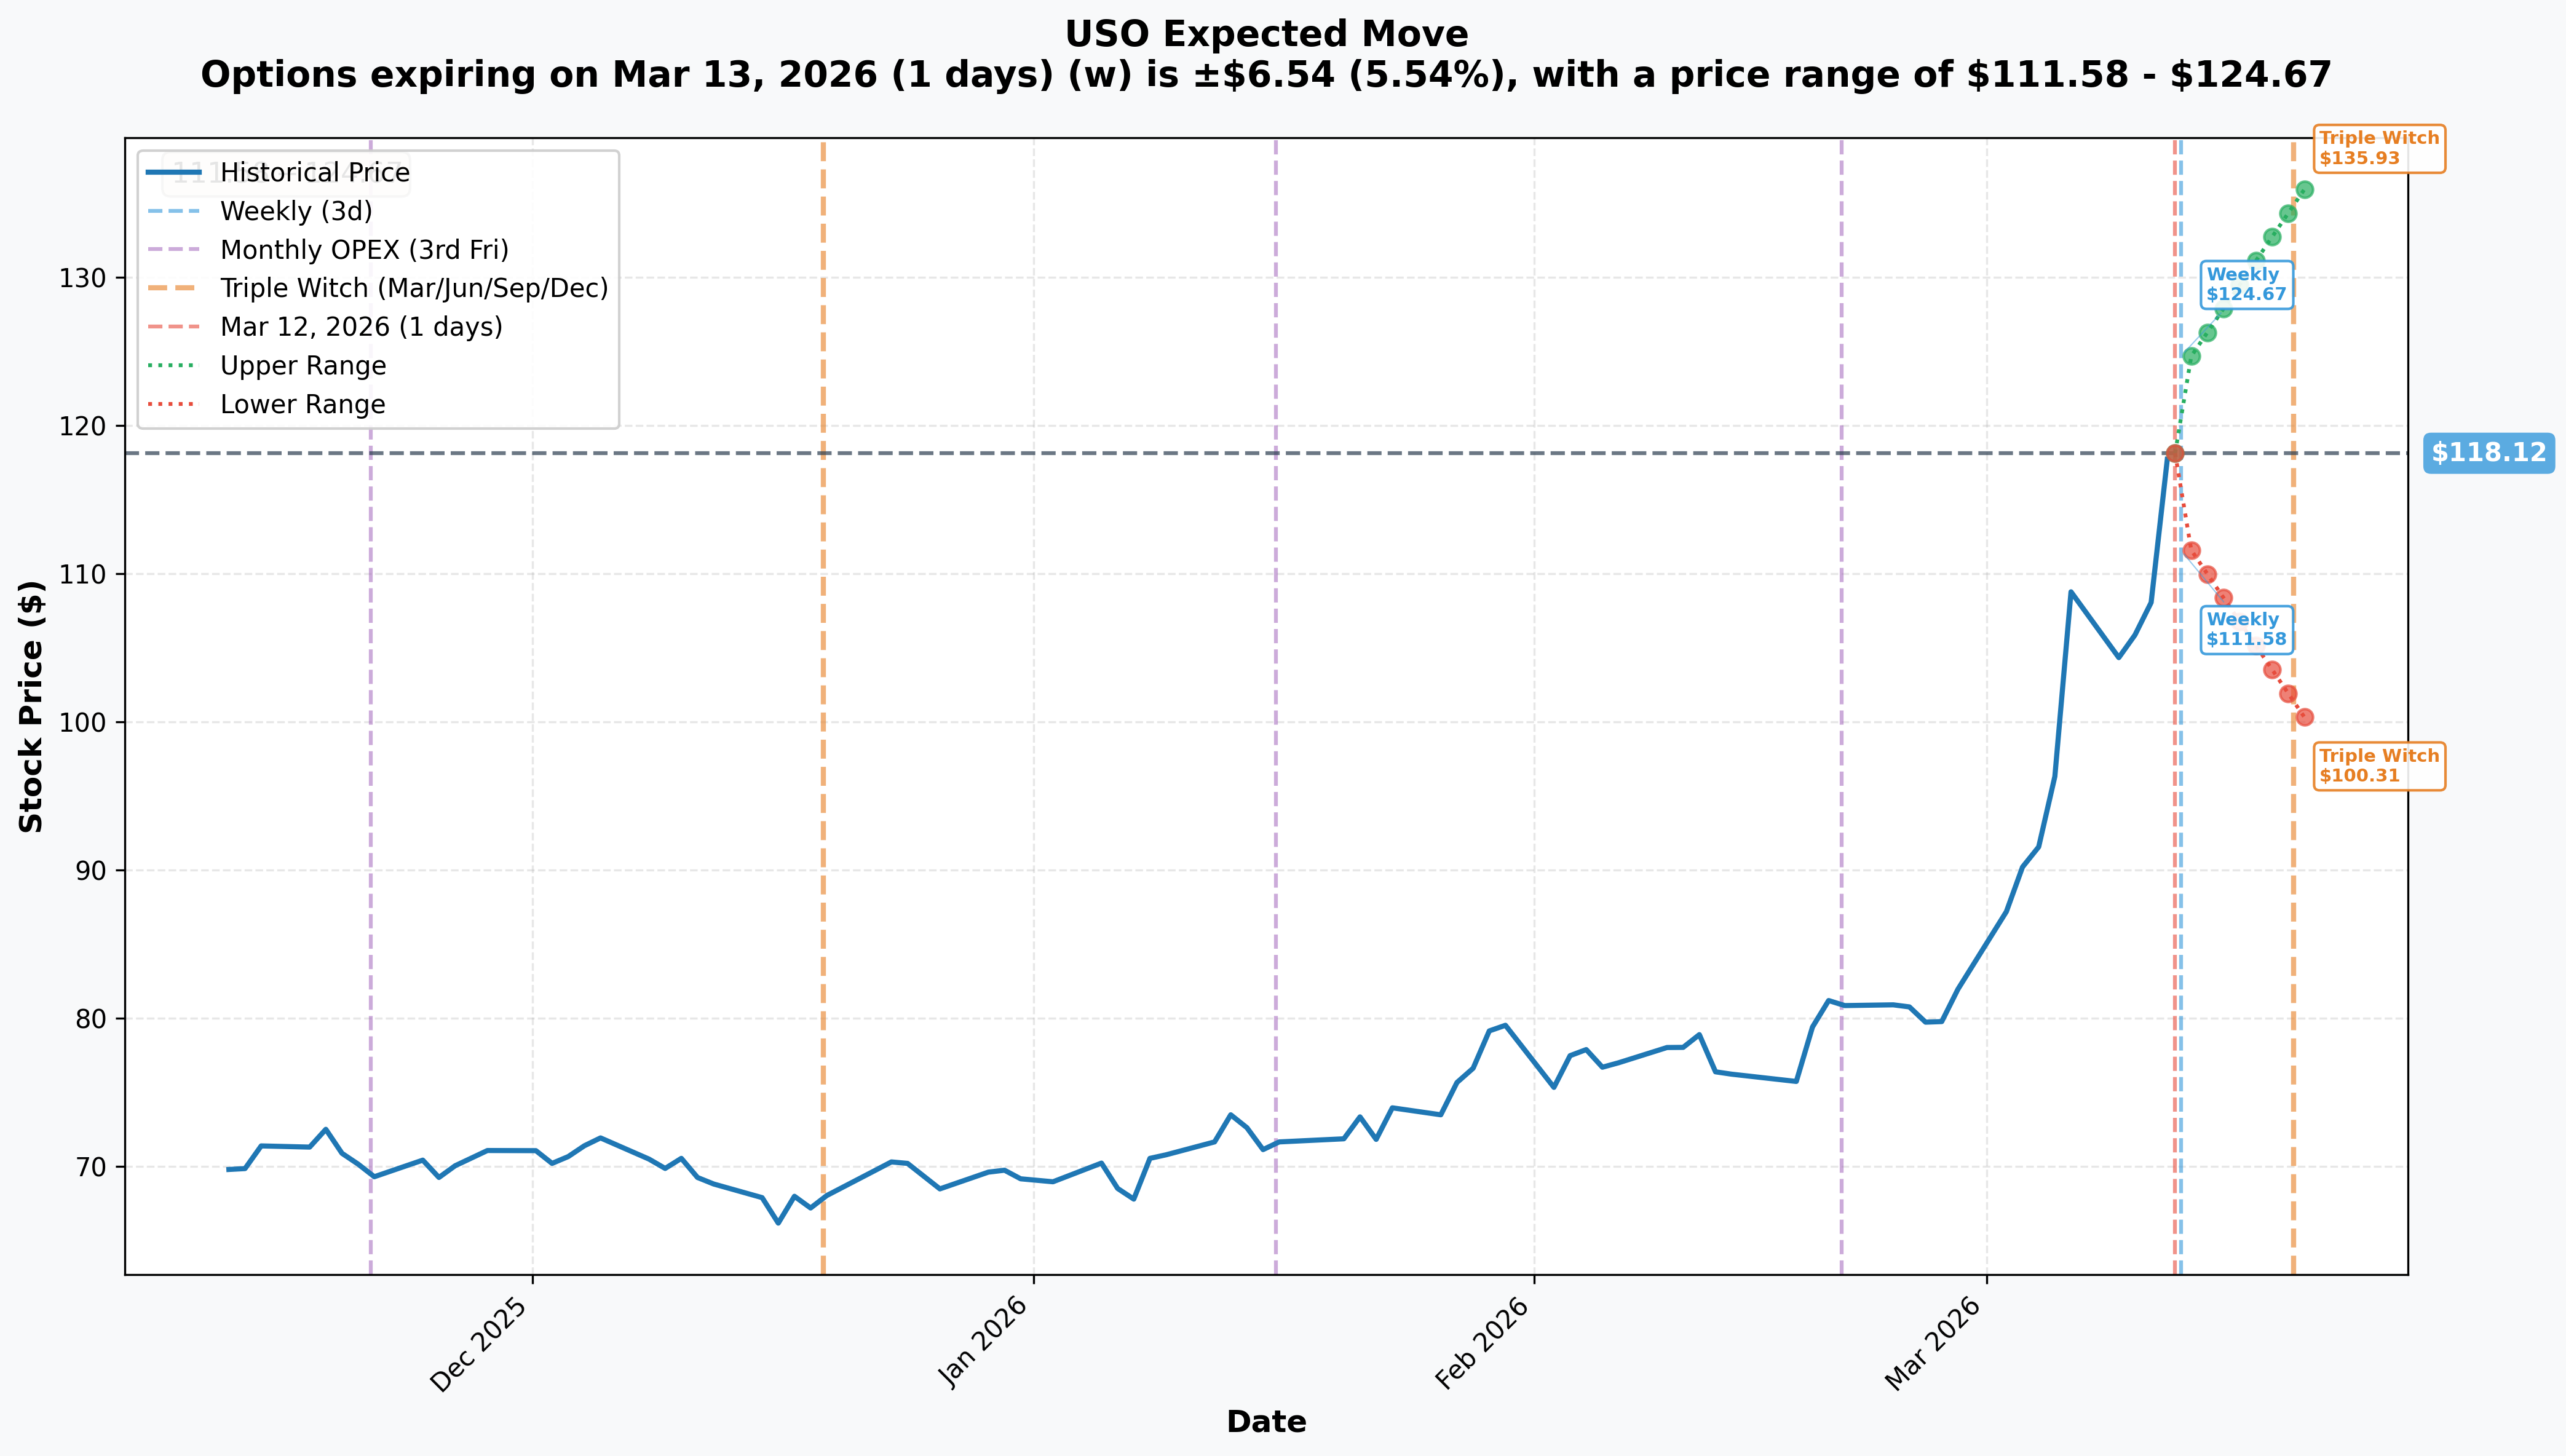
The options market is pricing in absolutely enormous moves for USO right now:
- 📅 Weekly (March 13 — 1 day away): ±5.54% = ±$6.54 | Range: $111.58 – $124.67
- 📅 Monthly Triple Witch OPEX (March 20 — 8 days away): ±15.08% = ±$17.81 | Range: $100.31 – $135.93
- 📅 March 27 OPEX (THIS TRADE — ~15 days): Approximately ±$7-9, range roughly $108 – $127
Translation for regular folks: The options market is saying this oil ETF could move 15% in either direction by next Friday (March 20 Triple Witch). To put that in context, the S&P 500 might expect a 1-2% monthly move in normal times. For a $117 ETF to have a ±$17.81 expected range in 8 days is extraordinary — and it's 100% driven by the Hormuz crisis binary outcome.
Key insight for today's trade: The March 27 calls expire a week AFTER Triple Witch. The trader is buying past the most explosive implied move window, capturing the aftermath of whatever the Triple Witch volatility event delivers. If oil is at $125 after Triple Witch, the $130 calls with another week of runway become extremely interesting.
Notice that $124.67 — the TOP of the weekly implied range — is essentially sitting right at the $125 strike. The market itself is saying the upper range for this week nearly tags the first major sweep strike.
🎪 Catalysts
🔥 Already Happened (The Backstory of Why We're Here)
The Hormuz Crisis — February 28, 2026 (The Defining Catalyst) 🚨
On February 28, 2026, the U.S. and Israel conducted coordinated military strikes on Iran, killing Supreme Leader Khamenei. The IRGC immediately moved to block the Strait of Hormuz — through which roughly 20% of global oil supply flows daily. Tanker traffic collapsed. WTI crude ripped from ~$63/bbl (January 2026 levels) to an intraday high of $119.48/bbl on March 3 — the biggest single weekly gain in WTI history (+35.6%) for the week ending March 9, 2026. USO flew from the $70s to a 52-week high of $124.07.
Iran's NEW Supreme Leader Mojtaba Khamenei stated on March 12, 2026 — TODAY — that the IRGC will not allow a single litre of oil through the Strait of Hormuz. The IEA called this the "largest supply disruption in history."
IEA Record SPR Release — March 11, 2026 (Yesterday)
The IEA announced unanimous approval to release 400 million barrels from strategic reserves — more than double the 182 million barrels released during the 2022 Russia invasion. The U.S. is contributing 172 million barrels from the SPR, beginning delivery within 1 week. Market reaction? Prices fell modestly but the SPR deal "failed to bring down petroleum prices" substantially. This is critical — even a historic reserve release can't fully offset the Hormuz closure.
OPEC+ April Production Hike — March 1, 2026
In a surprising move two days after conflict started, OPEC+ approved a 206,000 b/d output hike for April. Bullish case: this 206K b/d is a rounding error vs the ~18–20M b/d disrupted by Hormuz closure. The market barely flinched.
Russia Sanctions — February 2026
U.S. Treasury sanctioned Rosneft and Lukoil — together representing ~75% of Russia's oil exports. More supply pressure layered on top.
EIA Inventory Data — Consecutive Weekly Builds
Here's the bear nuance: despite the Hormuz shock, U.S. domestic crude inventories actually built +3.824 million barrels for the week ending March 6 — the third straight weekly increase, far exceeding the 1.1M barrel consensus. The disruption hasn't hit U.S. shores yet. When it does (or if SPR flows distort further), this data gets very noisy.
EIA March STEO — March 10, 2026
The EIA's March Short-Term Energy Outlook dramatically revised Brent to $79/bbl average for 2026 (up from $58/bbl one month prior). Q2 2026 Brent expected to remain above $95/bbl for the next two months — a significant near-term bullish signal.
Unusual USO Call Activity — February 18, 2026
About 10 days before the conflict began, unusual call options activity was detected in USO. In retrospect, that may have been informed positioning. Today's sweep is even larger — and the conflict is already underway.
📅 Upcoming Catalysts (What Drives the Trade Through March 27)
March 17 (Tue) — API Weekly Inventory Report The first early read on whether disruption is finally hitting U.S. crude stocks. A surprise draw (vs recent builds) would be very bullish for USO. API releases approximately 18 hours before EIA data.
March 18 (Wed) — EIA Weekly Petroleum Status Report The definitive inventory number. Three consecutive builds have been a headwind — if the tide turns and we see a draw, it confirms that the Hormuz disruption is materially affecting U.S. supply chains. This is the weekly binary catalyst within the trade window.
March 20 (Fri) — Triple Witch OPEX This is the BIG volatility event within the trade window. The options market is pricing ±15.08% around this date. Whether USO is at $100 or $135 on March 20 largely determines the trajectory heading into the March 27 expiry of today's calls.
Ongoing — Iran Ceasefire/Escalation Binary This is the #1 catalyst for USO bar none. Trump has suggested the war "would be over soon" while Iran's new Supreme Leader today reaffirmed the blockade. Any ceasefire deal could collapse oil $20-30 in hours. Any escalation could send it $20 higher. Every headline between now and March 27 could move this trade materially.
March 25 (Wed) — EIA Weekly Petroleum Report (Second in Trade Window) Second data point inside the trade window. Trend confirmation on whether U.S. inventories are drawing down as Hormuz disruption filters through.
April 5 — OPEC+ V8 Monthly Monitoring Meeting Just outside the trade window but affects sentiment. Following the March 1 hike decision, this meeting could authorize further supply increases or hold — key watch for the April narrative.
🎲 Price Targets & Probabilities
Using gamma levels, implied move data, the catalyst calendar, and the structure of today's sweep:
📈 Bull Case — Hormuz Stays Closed (30% probability)
USO Target: $122–$130 | WTI ~$103–$112
How we get there:
- 🚨 Iran holds the Hormuz blockade through end of March — IRGC today confirmed exactly this intent
- 📊 EIA/API inventory data FINALLY shows large draws as disruption filters to U.S. shores
- 💰 WTI pushes above $100/bbl again, USO tests its March 3 high near $124
- 🟠 $120 gamma resistance (10.59 gamma weight — strongest overhead level) gets broken — this triggers a gamma squeeze as market makers need to hedge, accelerating the move
- 🎯 With $120 broken, the next gamma resistance is at $125 (today's largest premium leg!), which becomes the target
- 🚀 If $125 breaks near Triple Witch March 20, the $130 calls come alive heading into March 27
P&L preview for today's sweep:
- $120 calls at $12.73: Could trade $15-20+ if USO reaches $122-124 → +18% to +57% return
- $125 calls at $11.11: Could trade $5-10 if USO hits $125-127 → breakeven to +90%
- $130 calls at $9.66: Could trade $3-7 if USO hits $130-132 → lottery ticket territory
Probability caveat: 30% because it requires Iran to hold the line AND oil demand to absorb elevated prices without demand destruction. Goldman's revised Q4 2026 WTI forecast of $67/bbl implies the market ultimately resolves lower.
🎯 Base Case — Volatile But Range-Bound (45% probability)
USO Target: $112–$122 | WTI ~$93–$100
Most likely scenario:
- ✅ No ceasefire, but no major escalation either — war of words continues while both sides negotiate
- 📊 Inventory data mixed — some builds, some draws, creating whipsaw headlines
- 🔄 USO bounces between the $115 gamma support and $120 gamma resistance (tight 4.3% band)
- ⚖️ SPR release flows begin hitting markets, partially capping upside while Hormuz disruption prevents major downside
- 💤 $120 calls expire near the money or slightly in the money — modest profit or small loss
- 📉 $125 and $130 calls expire worthless or near worthless — the premium on the upper two legs is time-decayed
This is where the strategy construction matters: In the base case, the $3.3M on the $120 calls has a fighting chance (USO only needs to get past $120), while the $5.8M on $125s and $2.5M on $130s are likely losses. The trader loses the upper 70% of premium but captures value on the nearest strike. Net result: probably a loss of $7-9M on the full package, profit of maybe $0.5-2M on the $120 leg. This is why the $120 leg being the "BTC" classification makes sense — it may be closing an existing short position.
📉 Bear Case — Ceasefire / Diplomatic Resolution (25% probability)
USO Target: $90–$105 | WTI ~$63–$80
What could go wrong:
- 🕊️ Trump brokers a U.S.-Iran ceasefire — he's publicly said the war "would be over soon"
- 🛢️ Strait reopens → supply disruption premium evaporates overnight → WTI collapses toward pre-crisis $63 level
- 📉 Goldman's pre-crisis WTI base case was ~$62/bbl — a full resolution could send WTI to $65–$72 rapidly
- 💸 All three call strikes expire deep out of the money → entire $11.6M is lost
- 🏦 SPR 172M barrels from U.S. starts flowing into markets, compounding selling pressure
- 📊 EIA projects a massive 1.9M b/d global inventory build once Hormuz flows resume
In the bear case, this is a complete total loss. $11.6M gone. That's the honest risk of buying OTM calls 15 days from expiry on a binary geopolitical event.
💡 Trading Ideas
🛡️ Conservative: USO Stock or Defined-Risk Call Spread
The "Sleep Well Strategy"
Play: Rather than buying naked calls like today's sweep, buy a USO call spread — buy the $118 call, sell the $122 call, both expiring March 27
Why this works:
- 💰 Defined maximum loss — you can only lose what you pay for the spread (~$1.50-2.00 per spread, or $150-200 per contract)
- 📊 Breakeven at ~$119.50-120, max profit if USO closes above $122 at March 27 expiry
- 🎯 Captures the move from $118 to $122 — right across the strongest gamma resistance at $120
- 🛡️ IV is extremely elevated right now (oil crisis premium) — selling the $122 call helps offset the expensive option prices
- 👀 You're essentially betting USO crosses $120, which is the nearest gamma resistance and only 2.1% away
Cost: ~$150-200 per spread (vs $966-1,273 to buy naked calls like today's trade) | Max profit: ~$400 per spread (200-300% return if USO closes above $122)
Risk level: Defined maximum loss | Skill level: Intermediate | Timeline: March 27
⚖️ Balanced: Near-The-Money $120 Call (One Strike Only)
The "Follow the Biggest Leg" Play
Play: Buy the USO $120 call expiring March 27 — the same strike with the highest pre-existing OI (6,300) and the nearest to today's price
Why this works:
- 🎯 This is the highest-conviction leg of today's sweep — $120 is the nearest gamma resistance (10.59 total gamma, strongest in the entire resistance stack) AND only 3.6% above today's trade-time spot of $115.78
- 📊 Pre-existing 6,300 OI means market participants were already positioned here — today's 2,900 new contracts added is significant incremental demand
- ⏰ 15 days to expiry gives time for the next two EIA reports AND Triple Witch to create a catalyst
- 💰 Current price ~$12.73 per contract (at trade time) — if USO moves to $124, the $120 call is worth approximately $14-16, a 10-25% return on a $1,000 investment
- 🎲 More realistic risk/reward than the $125/$130 lotto legs
Sizing suggestion: No more than 2-3% of total portfolio. Oil is a macro wild card right now.
Risk level: Moderate — elevated oil IV means expensive options | Skill level: Intermediate | Timeline: March 27 | Max loss: Entire premium paid
🚀 Aggressive: Replicate the $125 Call (The "Conviction Leg")
The "Where the Whale Put the Most Money" Play
Play: Buy the USO $125 call expiring March 27 — the $5.8M largest leg of today's sweep
Why this is interesting:
- 💰 This is where the whale put the MOST money ($5.8M of $11.6M total — literally half the premium)
- 📊 USO only had 3,200 OI at $125 before today — today's 5,200 new contracts more than doubled it — someone WANTED to be there
- 🎢 $125 represents the weekly upper implied range limit (~$124.67) — if USO clears the weekly move, this strike is nearly at the money for next week
- 🚀 If the Hormuz closure intensifies before March 20 Triple Witch, USO could retest its $124.07 52-week high, putting these calls very close to at-the-money
- ⚡ This is a high-risk, high-reward lottery ticket — if USO hits $128 by March 27, the $125 calls (currently ~$11.11) could trade at $5-8+
The brutal math: $125 calls need USO to rally ~6.4% from $117.51 to $125 to break even at expiry. With 15 days and maximum oil uncertainty, this is genuinely possible — and also genuinely a coin flip. The Iran IRGC's statement today that the strait stays closed is the fundamental reason the whale bought this strike.
Risk level: HIGH — you can lose the entire premium | Skill level: Advanced | Probability of profit: ~30-35% | Timeline: March 27
CRITICAL WARNING: Do NOT risk more than you can afford to lose entirely. This is an OTM call on a binary geopolitical event. The trade can go from $11.11 to $0 if Trump tweets a ceasefire deal.
⚠️ Risk Factors
Oil is unlike any other asset class — macro and geopolitical forces can override every technical setup in a single headline. Here's what could blow this trade up:
-
🕊️ Ceasefire announcement — overnight binary risk: President Trump has publicly said the conflict "would be over soon". A ceasefire deal doesn't give you time to exit. WTI could open $20-30 lower on a ceasefire announcement, and all three strikes could go from meaningful value to near-zero before market open. This is the #1 risk — and it's not a small probability event.
-
🛢️ IEA SPR release impact: The 172 million U.S. barrels start flowing within 1 week of March 11 — meaning the first deliveries arrive around March 18, right during the trade window. As physical supply hits markets, it creates genuine downward price pressure. The prior 2022 SPR release brought prices down meaningfully after initial skepticism.
-
📊 EIA data surprise (bearish): Three straight weeks of U.S. crude inventory builds show the disruption hasn't hit American storage yet. If March 18 and 25 EIA reports continue showing builds, the narrative that "Hormuz isn't really affecting supply" gains traction, pushing oil lower.
-
🌍 Russia-Ukraine ceasefire: Oxford Economics estimates a peace deal reduces the geopolitical risk premium by $5-10/bbl. Combined with a Hormuz resolution, the multiple-premium compression could be severe for oil longs.
-
📉 Demand destruction from $90+ oil: History shows demand begins falling meaningfully when WTI stays above $90-100 for more than 4-6 weeks. China's structural oil demand deceleration is already a headwind. High oil prices can become self-defeating — triggering the very demand collapse that erases the supply premium.
-
💸 Time decay is brutal with 15 days: With 15 days to expiration, theta (time decay) is eating these calls EVERY day they don't move. The $125 and $130 strikes at $11.11 and $9.66 respectively need USO to move significantly just to maintain their value. Every day of sideways action is a loss for the call holder.
-
🏦 OPEC+ could unleash more supply: The 206K b/d April hike was the low end of the range discussed. If the April 5 OPEC+ monitoring meeting authorizes another increase (Saudi Arabia has 1-2M b/d of idle capacity), it sends a bearish signal even if Hormuz stays closed.
-
🎢 Roll yield and NAV drift: USO's price doesn't track WTI exactly. In high-volatility environments, the fund can deviate meaningfully from NAV, and the monthly roll mechanics introduce basis risk that's hard to predict. USO closed at $107.17 on March 11 but trades at $117.51 today — gap vs NAV of $102.19 shows significant premium that could normalize.
🎯 The Bottom Line
Real talk: Someone just spent $11.6 MILLION building a call ladder across three different USO strikes at the exact same second — all expiring March 27. This is not a casual trade. This is a coordinated institutional bet that crude oil has more upside in the near term, structured as a ladder so they profit at multiple levels from $120 all the way to $130.
What this trader is saying with $11.6M:
- 🎯 "I think Iran holds the line on Hormuz through at least late March" — Iran's new Supreme Leader confirmed this TODAY
- 💰 "The $120 resistance level ($10.59 gamma — the STRONGEST in the entire chain) will get tested and broken"
- 🚀 "If $120 breaks, I want exposure all the way up to $125 and $130" — hence the ladder structure
- 📊 "The IEA SPR release and OPEC hike aren't enough to cap this crisis-driven market"
- ⏰ "The March 27 expiry gives me time to catch the Triple Witch volatility event on March 20 and any post-Triple-Witch follow-through"
The oil market context that makes this compelling: The EIA's March STEO forecasts Brent above $95/bbl for the next two months. Goldman Sachs raised its Q4 WTI forecast. The largest supply disruption in IEA history is still actively in force. USO is up 58% YTD yet sitting 5-8% below its March 3 high — that's a pullback in a raging bull trend.
If you own USO or are bullish oil:
- ✅ Today's sweep aligns with the bull thesis — the whale agrees with you
- 📊 Watch $120 as the critical near-term line — it's 2.1% away and carries the heaviest gamma resistance. A break above it on volume is meaningful
- ⏰ Mark your calendar for March 17 API and March 18 EIA data — the first inventory draws (vs recent builds) would be the fuel for the next leg up
- 🎯 USO's 52-week high of $124.07 is the institutional target for the bull case
If you're watching from the sidelines:
- 👀 March 20 Triple Witch is the key event — ±15.08% implied move means USO could be anywhere from $100 to $135 by that day. Don't position large into that binary
- 🎯 Best risk/reward entries are AFTER Triple Witch volatility clears — buy dips toward $115 gamma support if the move is downward and oil headlines don't worsen
- 📅 Watch for ceasefire news closely — that's the regime-change event that flips everything
If you're bearish:
- 🕊️ The #1 catalyst you need is a ceasefire announcement — and Trump is clearly working toward it
- 📉 A break below $115 gamma support targets $110 (next floor), then $100 (the big one)
- ⚠️ Don't short into this while the strait is actively blocked — fighting the IRGC's blockade with short positions is not a comfortable trade
Mark your calendar:
- 📅 March 17 (Tue) — API inventory report
- 📅 March 18 (Wed) — EIA weekly data (MAJOR catalyst for the trade)
- 📅 March 20 (Fri) — Triple Witch OPEX, ±15.08% implied move resolves
- 📅 March 25 (Wed) — Second EIA report inside trade window
- 📅 March 27 — THIS TRADE'S EXPIRATION
- 📅 April 5 — OPEC+ V8 monitoring meeting
Final word: The $11.6M oil call sweep is one of the more coherent high-conviction institutional trades you'll see — it's not random, it's systematic. The trader mapped the gamma resistance levels, picked all three, and funded them simultaneously to build a tiered oil exposure ladder. Whether the thesis is correct comes down to a question no options model can answer: how long does Iran keep the Strait of Hormuz closed?
That's the $11.6 million question. 🛢️
⚠️ Disclaimer: Options trading involves substantial risk of loss and is not suitable for all investors. This analysis is for educational and informational purposes only and does not constitute financial advice or a recommendation to buy or sell any security or derivative instrument. USO and oil-related derivatives are highly volatile instruments subject to extreme price swings driven by geopolitical events, OPEC decisions, macroeconomic factors, and supply/demand dynamics that are inherently unpredictable. The unusual options activity described may reflect hedging, speculative positioning, or institutional strategies that are not appropriate for retail investors. All three call strikes identified are currently out-of-the-money and could expire worthless, resulting in a 100% loss of premium paid. Past unusual activity does not guarantee future price movement. Always do your own research and consult a licensed financial advisor before trading. Never risk more than you can afford to lose.
Analysis generated: March 12, 2026 | USO on Ainvest