🐻 VUG $1.3M Put Bomb -- Someone Just Bought Crash Insurance on the Entire US Growth Trade!
📅 February 26, 2026 | 🔥 Unusual Activity Detected
🎯 The Quick Take
Someone just dropped $1.3 MILLION on deep out-of-the-money VUG puts at the $400 strike -- a full 14% below the current price of $464.44 -- with a September 2026 expiration. This is not a quick trade. This is a 7-month macro hedge against a complete unraveling of US large-cap growth stocks during the most decisive growth-to-value rotation we have seen since the dot-com era. With the "Big 4" hyperscalers committing $700B+ in AI capex that investors are increasingly skeptical about, the Warsh Fed Chair nomination threatening to steepen the yield curve, and midterm election year seasonality showing a 70% historical correction probability, this trade is positioned for the moment when all these headwinds converge.
📊 ETF Overview
Vanguard Growth ETF (VUG) tracks the CRSP US Large Cap Growth Index, providing broad exposure to the largest US growth stocks:
- 📈 What it tracks: US large-cap growth stocks -- the mega-cap tech and innovation leaders that drove the market for the past 3 years
- 💰 AUM: ~$350B (one of the largest growth ETFs in existence)
- 🏢 Top Holdings: NVDA (13.2%), AAPL (11.5%), MSFT (9.6%), GOOGL (5.9%), AMZN (4.8%), META (~4%) -- top 10 = 64.6% of the fund
- 📊 Current Price: ~$464.44
- 📊 52-Week Range: $316.14 - $505.38
- 📊 YTD Return: -4.7% (while VTV (value) is up +8.5% -- a staggering 13+ point gap)
- 💸 Expense Ratio: 0.03% -- dirt cheap
- 📊 Beta: 1.25 (moves 25% more than the broad market)
- 🔥 Key Story: VUG is ground zero for the Great Rotation of 2026 -- money is flowing out of growth and into value, energy, industrials, and small-caps at a pace Wall Street is comparing to the dot-com rotation
💰 The Option Flow Breakdown
📊 The Tape (February 26, 2026 @ 11:09:08)
| Time | Symbol | Side | Type | Expiration | Premium | Strike | Volume | OI | Size | Spot | Option Price |
|---|---|---|---|---|---|---|---|---|---|---|---|
| 11:09:08 | VUG | BUY | PUT $400 | 2026-09-18 | $1.3M | $400 | 1,800 | 3 | 1,200 | $464.44 | $10.94 |
Classification: Long Put (BTO) -- Bearish Hedge / Crash Insurance
🤓 What This Actually Means
Let me break this down -- because the numbers here tell a very specific story about how someone is thinking about the next 7 months for US growth stocks.
The raw numbers:
- 💸 $1.3M in premium for 1,200 contracts of the September 18, 2026 $400 puts
- 📊 Volume of 1,800 vs. OI of just 3 -- this is a Vol/OI ratio of 600x. There was essentially zero existing interest at this strike before this trade. Someone walked in and created this position from scratch
- 🎯 $400 strike is 14% below the current price of $464.44 -- this is deep, deep out-of-the-money
- ⏰ 204 days to expiration -- this is not a weekly gamble, this is a 7-month strategic hedge
- 💰 $10.94 per contract -- relatively cheap premium for 7 months of crash protection on a $464 ETF
- 📊 Breakeven at ~$389 -- VUG would need to fall roughly 16.2% from current levels for this to pay off at expiration
What this tells us:
- 🐋 This is institutional hedging. A $1.3M single-block put purchase on an ETF, 14% OTM, with 7 months of time -- this is not someone making a quick directional bet. This is portfolio insurance from someone with significant growth stock exposure who wants protection through the entire catalyst-dense H1 2026 window and into the midterm election cycle
- 🧮 The math works as a portfolio hedge. If this institution holds $50-100M in growth equities, $1.3M represents 1.3-2.6% of the portfolio value -- a reasonable insurance premium for 7 months of tail protection
- 📉 They are targeting a specific scenario: a 14%+ decline in US large-cap growth stocks by September. Given midterm year seasonality and the velocity of the current rotation, this is not outlandish -- it is statistically within the historical distribution of intra-year drawdowns
📈 Technical Setup / Chart Check-Up
YTD Performance
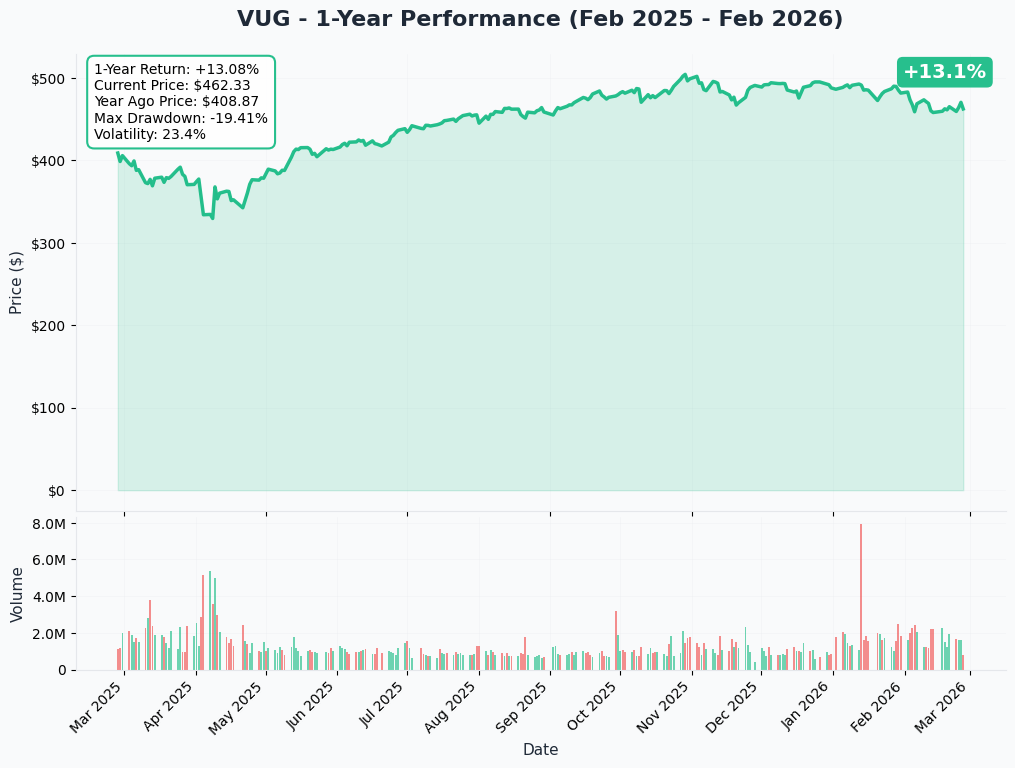
VUG is having a rough year. Down 4.7% YTD while its value counterpart VTV is up 8.5% -- that is a 13+ percentage point performance gap that tells you everything about where the market's mood has shifted:
- 📉 MSFT (-17.9% YTD) is the biggest drag -- crashed 11% in a single day after reporting $37.5B in quarterly AI capex with only 3.3% Copilot adoption
- 📊 NVDA (-4.7% on Feb 26) despite beating Q4 earnings ($68.1B vs. $66.2B consensus) -- a classic "sell the news" that highlights how elevated expectations have become
- 📈 AMZN (-9% YTD) after announcing $200B in 2026 AI capex -- investors are questioning the ROI timeline
- 🔄 The Great Rotation is real: Energy +21%, Materials +17%, Staples +15%, Industrials +12% -- while mega-cap growth bleeds
- 📊 Trading roughly 8% below the 52-week high of $505.38 and the bleeding has not stopped
Key takeaway: VUG is not just underperforming -- it is actively losing ground while the rest of the market rallies. The concentration risk is brutal: with the top 10 holdings at 64.6% of the fund, a bad week for 2-3 names can drag the entire ETF.
📊 Gamma-Based Support & Resistance Analysis
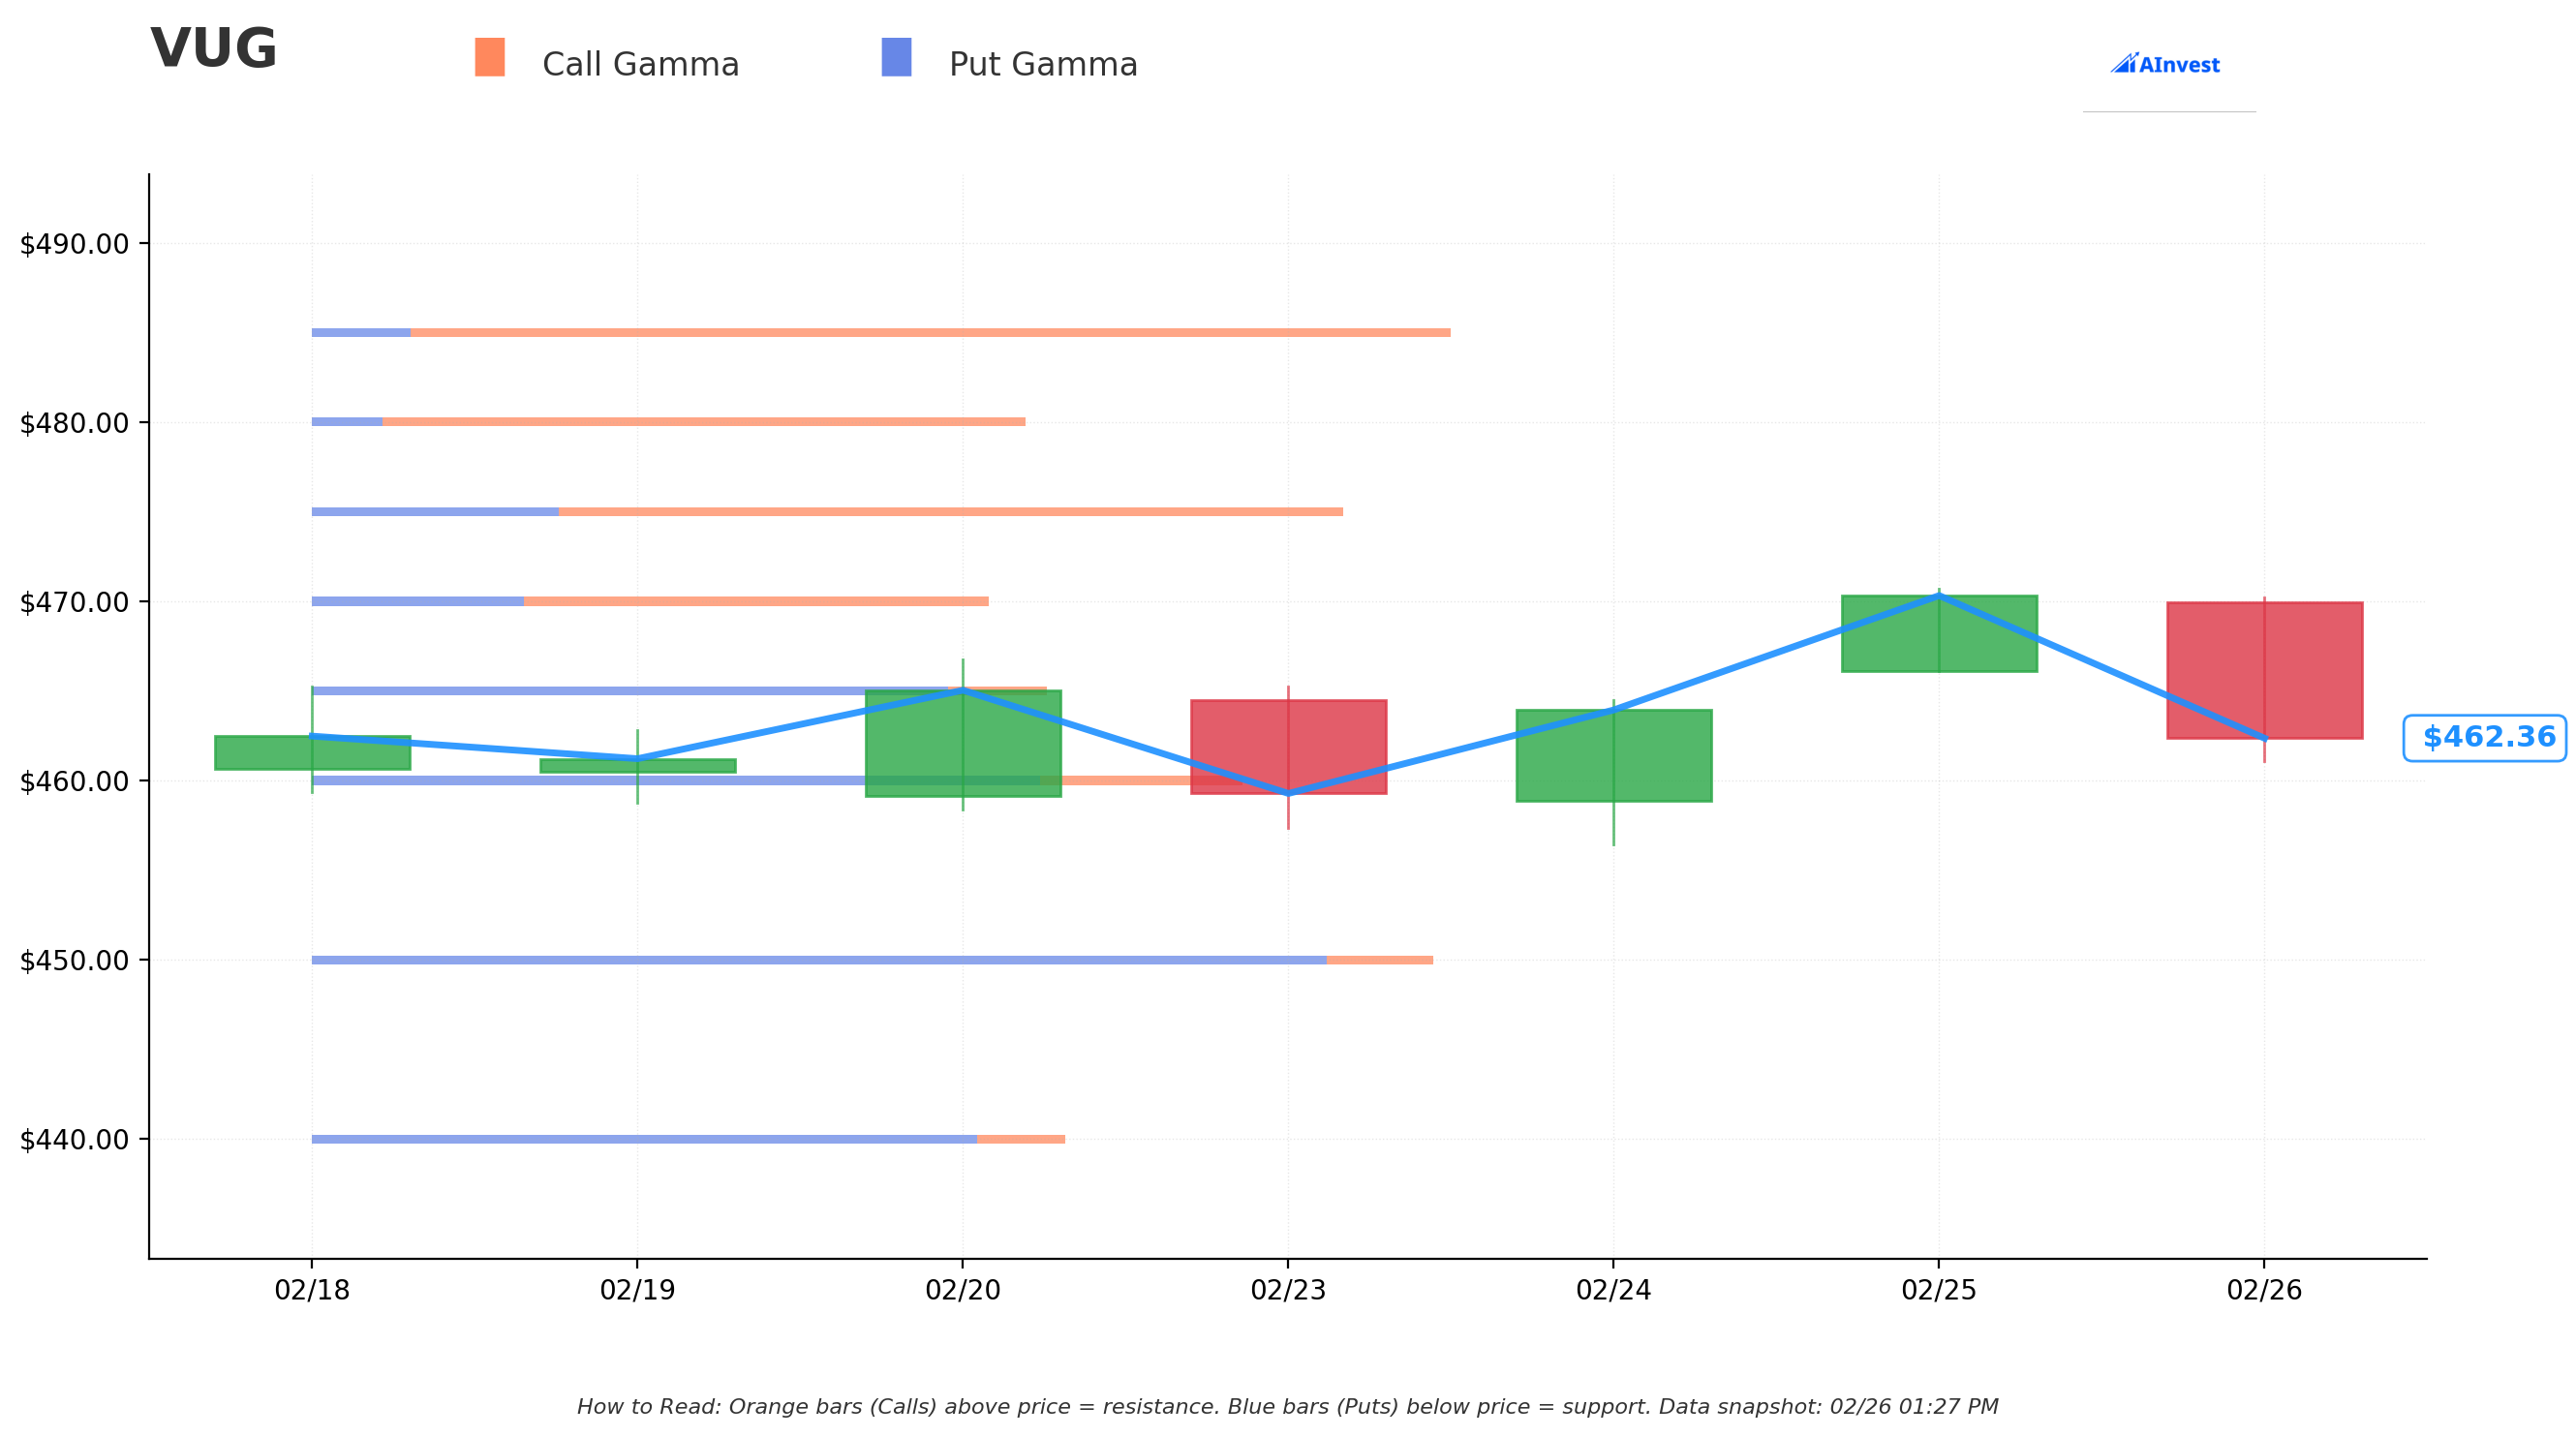
Current Price: $462.07
The gamma exposure map reveals where options dealers have stacked their positions -- creating natural floors and ceilings for VUG's price action:
🔵 Support Levels (Put Gamma Below Price):
- $460 -- Immediate support with the strongest total gamma concentration (0.17 GEX). Just 0.4% below current price -- this is the short-term floor market makers will defend
- $450 -- Heavy support zone at 0.20 total GEX (2.6% below). This is the first major stop if $460 breaks
- $440 -- Secondary support at 0.13 GEX (4.8% below). A move here would represent a meaningful correction
- $425 -- Structural floor at 0.11 GEX (8.0% below). Breaking this would be a serious technical breakdown
🟠 Resistance Levels (Call Gamma Above Price):
- $465 -- Immediate resistance just 0.6% above (0.13 GEX). VUG needs to punch through this to shift momentum
- $470 -- First real hurdle at 1.7% above (0.12 GEX). Net GEX flips positive here -- call gamma dominates
- $475 -- Major resistance at 0.18 total GEX (2.8% above). Biggest call gamma wall on the upside
- $480 -- Strong resistance at 0.13 GEX (3.9% above). Clearing this opens the door to $485+
- $485 -- Strongest single call GEX level at 0.20 total gamma (5.0% above). The ultimate near-term ceiling
- $490 -- Extended resistance at 0.10 GEX (6.0% above)
What this means for traders:
VUG is pinched between $460 support and $465 resistance -- a very tight range. The near-term bias is actually slightly bullish based on net GEX (total call gamma of 1.30 vs. total put gamma of 1.01), but the path higher faces stacked resistance at $470, $475, $480, and $485. Below $460, the next serious support is $450 -- and below that, gamma thins out considerably.
Critical context for the put trade: The $400 strike is far, far below any current gamma support level. The lowest gamma support on the board is $425 (8% below current). The put buyer is insuring against a scenario where ALL gamma support levels collapse -- a true waterfall decline. Think of gamma levels as a series of catch-nets: the put buyer is betting on the scenario where each net breaks under the weight of selling, one after another.
Net GEX Bias: Bullish -- but do not be lulled into complacency. Bullish dealer positioning means in a selloff, dealers would be selling delta to stay hedged, which can actually accelerate downward moves. This is exactly why institutions buy tail protection even when the near-term gamma picture looks supportive.
📊 Implied Move Analysis
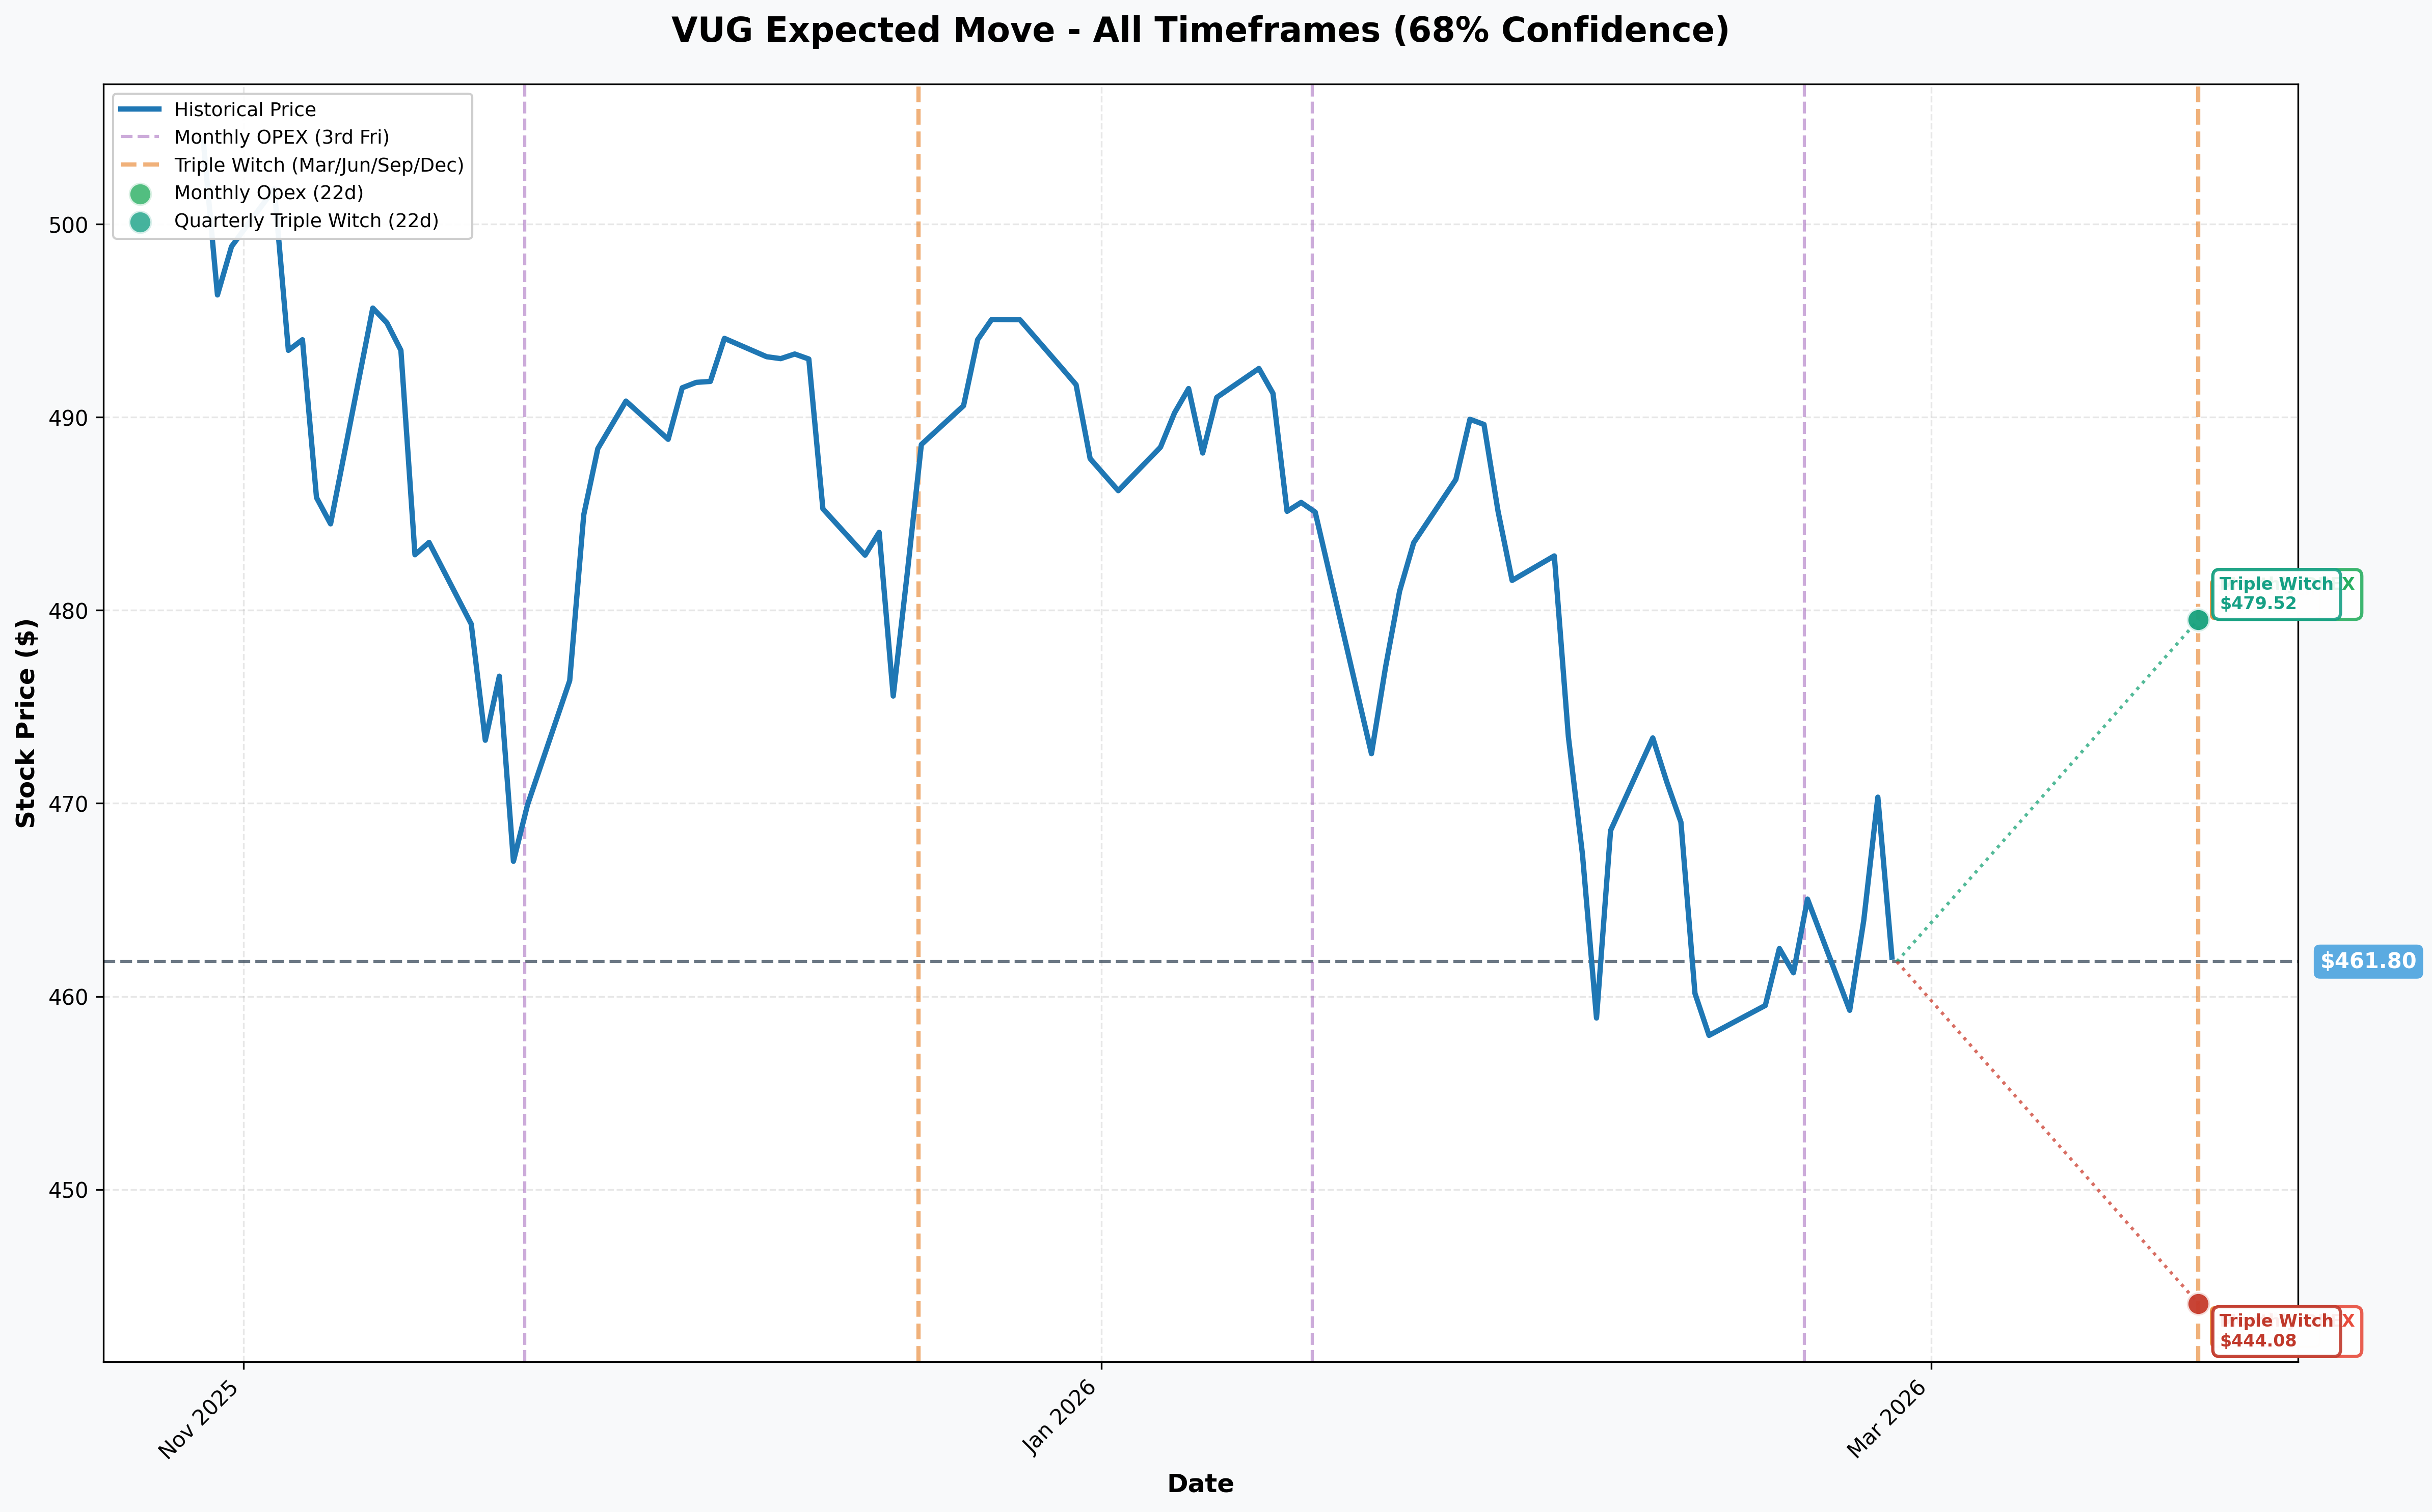
Options market pricing for the next expiration cycle:
- 📅 Monthly OPEX / Triple Witch (March 20 -- 22 days): ±$17.72 (±3.84%) --> Range: $444.08 - $479.52
Translation:
The options market expects VUG to stay within roughly $444 to $480 through the March 20 Triple Witch expiration. Now consider the put trade:
- 📊 $400 put strike = $44 below the implied lower bound ($444) -- well outside the expected distribution by a wide margin
- 📊 But the put expires on September 18 -- not March 20. Over 7 months, the implied range is significantly wider
- 📊 An annualized implied move of ~3.84% monthly translates to roughly ±11-12% over the 7-month window -- putting the lower bound around $410-415
- 📊 The $400 strike is still below even this extended range, but only marginally -- making it a legitimate tail risk hedge rather than a completely absurd target
The key insight: On a monthly timeframe, $400 looks crazy far away. On a 7-month timeframe that includes midterm election seasonality (average 18% intra-year drawdown) and the densest catalyst window in years, $400 is only about 1 standard deviation below the extended expected range. The options market may actually be underpricing the probability of a severe growth stock drawdown given the rotation dynamics.
🎪 Catalysts
🔥 Upcoming Catalysts (Now Through September 2026)
March 2026 -- Warsh Senate Confirmation Hearings 🏦
This could reshape the entire rate outlook:
- ⚠️ Kevin Warsh signals aggressive QT (active asset sales, not passive runoff) paired with front-loaded rate cuts
- 📈 "Bear steepening" of the yield curve is the worst possible outcome for growth stock valuations -- long-end rates rise even as short rates fall
- 💥 Immediate market reaction to the nomination: gold -18%, Bitcoin -25%, dollar stronger
- 🎯 Impact on VUG: HIGH -- growth stocks trade on duration; higher long-end rates compress their valuations directly
March-April 2026 -- Big Tech Earnings Gauntlet 📊
The next wave of earnings for VUG's top holdings will be make-or-break:
- 📅 Apple (11.5% weight) -- FQ2 FY2026. Analyst consensus remains "Buy" at $298.75 PT but AI integration progress under scrutiny
- 📅 Microsoft (9.6% weight) -- FQ3 FY2026. CRITICAL -- Azure growth deceleration watch; are they seeing any return on the $100B/year AI spend?
- 📅 Alphabet, Amazon, Meta (~15% combined weight) -- AI capex ROI scrutiny intensifies. Combined spending approaching $700B with Meta's FCF projected to drop ~90%
May 2026 -- NVIDIA Q1 FY2027 Earnings 🎯
- 📊 NVIDIA is VUG's largest holding at 13.2% -- a single-name risk that can move the entire ETF
- 📈 Must deliver on the $78B revenue guidance bar -- the most aggressive forward guidance in semiconductor history
- ⚠️ Any miss or guidance cut would crater VUG's biggest position and ripple across the entire growth complex
Mid-2026 -- Tariff Escalation Risk ⚖️
- 📊 Effective US tariff rate at ~13.5%, highest since mid-1940s
- 💻 Electronics price hikes of 10-30% directly impact the supply chains of VUG's top holdings
- 🎯 Average tax increase of $1,500/household could dampen consumer spending on tech products
H2 2026 -- Fed Rate Decisions 🏦
- 📊 Currently 3.50-3.75%; expected to reach ~3.0% by year-end via 2-3 cuts
- ⚠️ But Warsh's aggressive QT stance could steepen the long end even as the short end falls -- a net negative for growth stock valuations
November 2026 -- Midterm Elections 🗳️
- 📊 70% historical probability of a correction in midterm years
- 📉 Average intra-year drawdown of 18% in midterm years -- a move from VUG's recent $505 high to $414 would be exactly 18%
- 🎯 The September 18 expiration captures the pre-election uncertainty peak without extending into the post-election rally that historically follows
✅ Recent Catalysts (Already Happened)
NVIDIA Q4 FY2026 Earnings -- February 25, 2026 📊
- 📈 Revenue: $68.1B (vs. $66.2B consensus), up 73% YoY
- 💰 EPS: $1.62 adjusted (vs. $1.53 consensus)
- 📉 Stock dropped 4.7% on February 26 despite the beat -- a classic sell-the-news response reflecting sky-high expectations
- ⚠️ This is exactly the pattern the put buyer is hedging against -- great numbers no longer move the needle when the market has already priced perfection
Microsoft FQ2 FY2026 Earnings -- January 28, 2026 💥
- 📉 Stock crashed 11% intraday (worst since March 2020) after reporting $37.5B in quarterly AI capex -- a 66% YoY increase
- 📊 Only 3.3% Copilot adoption rate undermines the $100B/year capex thesis
- 📈 Stifel downgraded MSFT on AI spending and Azure growth deceleration
- 🎯 Now down 17.9% YTD -- VUG's third-largest holding is already in correction territory
The "Warsh Shock" -- February 24, 2026 🏦
- 📊 President Trump nominated Kevin Warsh to succeed Jerome Powell as Fed Chair
- 📉 Warsh signals aggressive balance sheet reduction that would pressure growth multiples
- 💥 Senate Banking Committee confirmation hearings expected throughout March
DeepSeek Disruption -- Ongoing 🤖
- 📊 DeepSeek reportedly set to release a new AI model -- threatening another Nasdaq selloff
- 💰 The original DeepSeek R1 model (trained for ~$6M) disrupted the narrative that $700B in AI capex is necessary
- ⚠️ Big Tech collectively lost $1 trillion in market cap on AI monetization skepticism
🎲 Price Targets & Probabilities
Using gamma levels, implied move data, the catalyst calendar, and historical midterm year patterns, here are the scenarios through the September 18, 2026 expiration:
📈 Bull Case (30% probability)
Target: $485-$505+
How we get there:
- 🚀 Big Tech earnings in April-May deliver strong results AND credible AI monetization timelines -- calming capex skepticism
- 📊 Growth stocks still expected to deliver +27.1% profit growth in 2026 -- if they execute, valuations get justified
- 🏦 Fed delivers 2-3 rate cuts, bringing rates toward 3.0% -- directly supports growth multiples
- 🔄 Rotation stabilizes or reverses as value becomes crowded and growth becomes relatively cheap
- 📈 VUG clears the stacked resistance at $475-$485 (strongest call gamma zones) and retests the $505 52-week high
- 💰 VUG 1-year net inflows of $18.25B suggest institutional conviction has not broken
Put trade P&L: Expires worthless. Loss = -$1.3M (100% of premium)
This is the expected outcome for an insurance trade. The institution would happily lose $1.3M because their growth stock portfolio would be worth significantly more.
🎯 Base Case (40% probability)
Target: $430-$465 (Range-Bound Grind)
Most likely scenario:
- ✅ VUG oscillates between gamma support ($450-$460) and resistance ($470-$475) for months
- 📊 Earnings are a mixed bag -- some beats, some misses -- no clear narrative shift
- 🔄 Rotation continues at a moderate pace but does not accelerate into a rout
- 📈 Warsh confirmation creates volatility but does not fundamentally change the rate path in 2026
- 🏦 Fed holds rates longer than expected, but eventually starts cutting in H2
- 📊 VUG ends the period roughly flat to modestly lower as leadership slowly broadens
Put trade P&L: Expires worthless. Loss = -$1.3M (100% of premium)
Same as the bull case -- the insurance is not needed. At roughly 1-2% of the hedged portfolio value, $1.3M is the cost of peace of mind through an extremely uncertain 7 months.
📉 Bear Case -- The Hedge Pays Off (25-30% probability)
Target: $380-$425
The scenario this trade is built for:
- 😰 The Great Rotation accelerates into a full-blown exodus from growth stocks -- Wall Street's dot-com comparison starts to feel prophetic
- 📉 NVIDIA misses its $78B revenue guidance bar in May -- VUG's largest holding (13.2%) gaps down 15%+, dragging the entire ETF
- 💻 AI capex skepticism reaches a tipping point: investors demand ROI evidence that the $700B in Big Tech spending will ever generate commensurate returns
- 🏦 Warsh's aggressive QT stance steepens the yield curve, compressing growth multiples by 20-30%
- ⚖️ Tariffs escalate to 15%+ with retaliatory measures, hitting tech supply chains and consumer demand
- 📊 Midterm election uncertainty peaks -- historical 18% average intra-year drawdown from peak
- 📈 Valuation context: growth stocks at 39x trailing P/E vs. value at 22x -- there is a LOT of room for multiple compression
- 🤖 DeepSeek releases a new model that further undermines the AI capex narrative
Put trade P&L at $400:
- 📊 Each $400 put would be worth approximately $0 at expiration (ATM). But at prices below $400 -- say $380 -- each contract would be worth ~$20 per share = $2,000 per contract
- 💰 At $380: 1,200 contracts x $2,000 = $2.4M payout on a $1.3M investment (roughly 1.8x return)
- 💰 At $360: 1,200 contracts x $4,000 = $4.8M payout (roughly 3.7x return)
- 🎯 Even at $400 exactly, the intrinsic value near zero is offset by the fact that with weeks remaining before expiry, these puts would carry substantial time value if VUG is declining rapidly
Why 25-35% is the right probability: Historical midterm year data shows 70% probability of some correction. But VUG is not the S&P 500 -- it is a concentrated, high-beta (1.25) growth basket already down 4.7% YTD with deteriorating momentum. A 14% decline from the $464 level to $400 would represent a roughly 21% decline from the $505 52-week high -- well within the 18% average midterm drawdown, especially for a high-beta fund.
💡 Trading Ideas
🛡️ Conservative: "Growth Insurance Policy" -- Protective Put Spread
Play: Buy VUG September 18, 2026 $440 puts, sell September 18, 2026 $400 puts
Why this works:
- 📊 $440 is right at the gamma support zone (4.8% below current) -- protection starts at a realistic level
- 🛡️ Defined risk: you pay the net debit of roughly $6-8 per spread ($600-800)
- 💰 Max profit: $40 per spread minus debit ($32-34 per spread) if VUG closes below $400
- 📈 Risk/reward: roughly 4:1 to 5:1 -- risk $700 to make $3,300 at max
- ⏰ September 18 expiration matches the institutional timeframe -- covers every major catalyst through midterm election season
- 📊 No time decay pressure for months -- you can be patient and right
Position sizing: 5-10 spreads at ~$7 each = $3,500-$7,000 max risk. This is genuine portfolio insurance -- spend no more than 1-2% of your growth stock exposure.
Risk level: Moderate (defined risk) | Skill level: Intermediate
⚖️ Balanced: "Rotation Hedge" -- Calendar Put Spread
Play: Buy VUG September 18, 2026 $450 put, sell VUG June 19, 2026 $450 put
Why this works:
- 🔄 Profits from the rotation theme -- if VUG drifts lower slowly over months, the calendar spread benefits from time decay working in your favor on the short leg
- 📊 $450 is the heavy gamma support zone (2.6% below). If it breaks, this trade starts paying off
- 💰 The short June put decays faster than your long September put -- you collect the time difference
- 📈 After the June put expires, you are left with a September $450 put with time still remaining
- 🎯 Ideal scenario: VUG drifts toward $445-455 by June OPEX, then accelerates lower into midterm seasonality
- ⏰ Captures the earnings gauntlet (April-May) for VUG's top holdings
Position sizing: 5-10 calendar spreads at roughly $4-6 each = $2,000-$6,000 invested.
Risk level: Moderate (defined risk, needs patience) | Skill level: Intermediate-Advanced
🚀 Aggressive: "Growth Crash Bet" -- Deep OTM Puts
Play: Buy VUG September 18, 2026 $400 puts (same trade as the whale)
Why this is tempting (and why it is risky):
- 💸 At ~$10.94 per contract, you get 7 months of crash protection on a $464 ETF for roughly 2.4% of the underlying price
- 📊 The Vol/OI ratio of 600x means you are following institutional money into a brand new position
- 🎯 If VUG hits $380 by September, each contract goes from $10.94 to ~$20 -- an 83% gain
- 📊 If VUG hits $350 (a true crash scenario), each contract would be worth ~$50 -- a 356% return
- ⏰ Seven months gives the thesis time to play out through all the catalyst density
Why it could blow up:
- 📉 75%+ chance these expire worthless. A 14% decline in 7 months is possible but not probable
- 💸 Time decay accelerates as you approach September -- if VUG is still above $430 by July, these will lose value rapidly
- 📊 Growth stocks could snap back if AI capex skepticism fades or rate cuts come sooner than expected
- ⚠️ VUG's strong inflows ($18.25B over 12 months) suggest institutional conviction in growth has not fully broken
Position sizing: Risk ONLY what you can afford to lose completely. 5 contracts at ~$1,094 each = $5,470 at risk. Potentially worth $10,000-$25,000 if VUG drops to $380-$350.
Risk level: HIGH (can lose 100% of premium) | Skill level: Advanced
⚠️ Risk Factors
Do not ignore these -- both for the put trade AND for your growth stock exposure:
-
📉 This put will most likely expire worthless. Let's be honest: a 14% decline to $400 in 7 months is possible but the base case probability is only 25-35%. This is insurance designed to pay off in tail scenarios. Do NOT blindly copy this trade thinking the institution "knows" a crash is coming. They are hedging, not predicting.
-
🔄 The rotation could reverse as fast as it started. Growth-to-value rotations have historically been violent but also mean-reverting over 12-18 month periods. If AI capex starts showing tangible ROI, money could flood back into growth stocks quickly.
-
📊 Growth earnings are still growing at +27.1%. Despite the valuation concerns, growth stocks are generating real earnings growth. The Shiller CAPE at 40.72 is elevated but earnings-supported valuations are more resilient than speculative ones. This is not 1999 when companies had no earnings.
-
🏦 Rate cuts are still coming. The Fed is expected to deliver 2-3 cuts in 2026, bringing rates toward 3.0%. Lower rates disproportionately benefit growth stock valuations. If cuts come sooner or deeper, VUG could rip higher.
-
💰 VUG is still attracting strong inflows. Despite negative YTD returns, VUG has pulled in $18.25B in 12-month inflows and $1.17B in the last month alone. Passive allocation flows remain a powerful tailwind that can offset active rotation. Massive inflows into a declining fund can also mean buy-the-dip institutional conviction.
-
📊 Concentration cuts both ways. Yes, the top 10 holdings at 64.6% creates downside risk. But it also means if NVDA or AAPL have a blowout quarter, VUG can rally 3-5% in a single session. The asymmetry is real in both directions.
-
⚖️ Tariff impact is uncertain. The Section 122 framework has a 150-day limit and faces legal challenges. If tariffs are struck down or softened, a major headwind disappears.
🎯 The Bottom Line
Here's the deal: Someone with significant growth stock exposure just spent $1.3M buying 7-month crash insurance on VUG, targeting a 14% decline to $400. This is NOT a prediction that growth stocks are about to collapse. This is the financial equivalent of buying flood insurance when the weather forecast shows storms for the next 7 months.
The storm clouds are real:
- 📉 VUG is down 4.7% YTD while value is up 8.5% -- a 13+ point gap that Wall Street is comparing to the dot-com rotation
- 💻 Big Tech is committed to $700B+ in AI capex with investors increasingly demanding proof it will pay off
- 🏦 The Warsh nomination introduces yield curve steepening risk that directly targets growth stock valuations
- 📊 NVIDIA's sell-the-news reaction (-4.7% on a beat) shows the market is no longer rewarding even great numbers
- 📅 Midterm year seasonality gives a 70% probability of correction with an average 18% intra-year drawdown
- 📊 Growth valuations at 39x trailing P/E (vs. value at 22x) leave zero margin for error
If you own VUG or heavy growth exposure:
- ✅ Consider adding modest put protection (1-2% of your growth allocation) through September to cover the catalyst-dense period
- 📊 Watch $450-$460 as the critical gamma support zone -- a sustained break below $450 would be the first real warning sign
- 🎯 The $475-$485 resistance zone is the upside gate -- clearing it convincingly would signal the rotation is fading
- ⏰ Mark April-May earnings for MSFT, NVDA, AAPL as the make-or-break moment for VUG's direction through year-end
If you are watching from the sidelines:
- 👀 This is a signal of institutional caution, not panic -- the institution still owns growth stocks, they are just buying protection
- 📊 Growth stocks still expected to deliver +27.1% earnings growth -- the fundamental story is not broken
- 🎯 A dip to $420-$430 (the -8% to -10% range) could present an excellent entry point for long-term growth believers
- ⏰ Best approach: let the April-May earnings cycle play out before making big allocation decisions
If you are bearish on growth:
- 📊 The put buyer validated the thesis that 25-35% probability of a major growth drawdown is worth hedging against
- 🎯 Put spreads in the $440/$400 zone offer the best risk/reward for betting on the rotation deepening
- ⚠️ Shorting VUG outright at $464 -- down 8% from highs -- is dangerous. Use defined-risk structures only
- 🔄 The relative trade (long VTV / short VUG) captures the rotation without needing an absolute crash
Key dates to mark:
- 📅 March 2026 -- Warsh Senate confirmation hearings -- yield curve implications for growth multiples
- 📅 March 20 -- Triple Witch / Monthly OPEX (implied range: $444-$480)
- 📅 April 2026 -- MSFT, GOOGL, AMZN, META earnings -- AI capex ROI scrutiny
- 📅 May 2026 -- NVIDIA Q1 FY2027 earnings -- must hit $78B revenue bar
- 📅 Mid-2026 -- Tariff escalation risk window / DeepSeek new model release
- 📅 September 18, 2026 -- THIS TRADE EXPIRES -- the verdict on 7 months of growth stock hedging
- 📅 November 2026 -- Midterm elections -- 70% correction probability hangs over the market all year
Final thought: The Great Rotation of 2026 is the most important market narrative this year, and VUG sits at the epicenter of it. This $1.3M put purchase is not a panic trade -- it is a calculated bet that the combination of AI capex skepticism, yield curve steepening, record growth valuations, and midterm seasonality creates a 25-35% chance that growth stocks give back a year of gains in 7 months. That probability might sound low, but when you are managing serious money, a 1-in-3 chance of a 14%+ drawdown is exactly what you hedge against.
The institution paid $1.3M for the right to sleep through whatever happens next. If you are heavily exposed to growth stocks, ask yourself: what is your number? 💪
Disclaimer: Options trading involves substantial risk of loss and is not suitable for all investors. This analysis is for educational purposes only and not financial advice. Past performance does not guarantee future results. The trades described here involve institutional-scale positions that carry significant capital requirements. VUG options may have wider bid-ask spreads than individual stock options. Deep out-of-the-money puts are expected to expire worthless the vast majority of the time -- that is the nature of insurance. Always do your own research and consider consulting a licensed financial advisor before trading.
About Vanguard Growth ETF (VUG): One of the largest US growth ETFs with ~$350B in assets, tracking the CRSP US Large Cap Growth Index. VUG provides broad exposure to US large-cap growth stocks including NVIDIA, Apple, Microsoft, Alphabet, Amazon, and Meta. Managed by Vanguard with an expense ratio of just 0.03%. VUG serves as a core growth allocation vehicle for both retail and institutional investors.