WDAY Unusual Options Activity Analysis
Date: February 10, 2026 Ticker: WDAY | Workday, Inc. Current Price: $154.53 Market Cap: $40.65 billion Sector: Enterprise Software / HCM
📊 Executive Summary
A sophisticated institutional trader has established a $11.5 million bearish risk reversal on Workday (WDAY) with January 2027 expiration. The structure consists of long in-the-money puts and short out-of-the-money calls, creating a net credit position that profits from further downside or range-bound trading through early 2027. This positioning comes one day after CEO Carl Eschenbach's abrupt departure and ahead of Q4 earnings on February 24.
Key Finding: The combination of CEO transition risk, 38% YTD decline, and 400 layoffs creates a compelling backdrop for this bearish institutional bet. The very low open interest on these strikes (96 OI on puts, 9 OI on calls) confirms this is fresh positioning, not a roll or adjustment.
📈 Trade Details
Trade Summary Table
| Time | Direction | Strike | Exp | Premium | Volume | OI | Spot | Symbol |
|---|---|---|---|---|---|---|---|---|
| 12:24:17 | BUY PUT | $180 | Jan 15, 2027 | $4.4M | 1,100 | 96 | $154.53 | WDAY250115P180 |
| 12:22:06 | SELL CALL | $195 | Jan 15, 2027 | $4.2M | 3,000 | 9 | $154.29 | WDAY250115C195 |
| 12:37:28 | SELL CALL | $195 | Jan 15, 2027 | $2.9M | 2,050 | 9 | $154.45 | WDAY250115C195 |
Strategy: Bearish Risk Reversal
Structure:
- Long: 1,100 x $180 Puts @ $40.00 = $4.4M debit
- Short: 5,050 x $195 Calls @ ~$14.20 avg = $7.1M credit
Net Position: ~$2.7M net credit received
Moneyness Analysis:
- $180 Put: 25.47 points ITM (16.5% ITM) - Deep intrinsic value
- $195 Call: 40.47 points OTM (26.2% OTM) - Significant buffer
🎯 Strategy Analysis
Payoff Profile (at January 2027 Expiration)
| WDAY Price | Put P/L | Call P/L | Net P/L |
|---|---|---|---|
| $120 | +$6.2M | +$7.1M | +$13.3M |
| $140 | +$4.0M | +$7.1M | +$11.1M |
| $154 (current) | +$2.5M | +$7.1M | +$9.6M |
| $180 | -$4.4M | +$7.1M | +$2.7M |
| $195 | -$4.4M | +$7.1M | +$2.7M |
| $220 | -$4.4M | -$5.5M | -$9.9M |
Breakeven Analysis
- Downside: No breakeven - position is profitable at any price below $195
- Upside Breakeven: ~$209 (strikes + net credit / share)
- Maximum Gain: Unlimited to the downside (realistically ~$13M+ if WDAY approaches $100)
- Maximum Loss: Unlimited to the upside (if WDAY rallies significantly above $220)
Position Greeks (Estimated)
| Greek | Put Position | Call Position | Net |
|---|---|---|---|
| Delta | -1,100 * 0.85 = -935 | -5,050 * 0.25 = -1,263 | -2,198 delta |
| Gamma | +22 | -50 | -28 |
| Theta | -$450/day | +$850/day | +$400/day |
| Vega | +$2,200 | -$5,050 | -$2,850 |
Interpretation:
- Net Short Delta: Position profits ~$2,200 per $1 decline in WDAY
- Positive Theta: Collects ~$400/day in time decay while waiting
- Short Vega: Benefits from declining implied volatility (typical post-earnings)
🔥 Catalyst Timeline
Immediate (0-14 Days)
| Date | Event | Impact |
|---|---|---|
| Feb 9, 2026 | CEO Eschenbach stepped down | 🔴 Stock -8%, sentiment shock |
| Feb 4, 2026 | 400 layoffs announced | 🔴 $135M restructuring charges |
| Feb 24, 2026 | Q4 FY26 Earnings | ⚠️ KEY EVENT - FY27 guidance critical |
Medium-Term (1-6 Months)
- AI Agent Launches (Q1 2026): Illuminate platform expansion
- EU Sovereign Cloud: European market expansion
- FY27 Guidance: Market expects mid-teens subscription growth
Why This Trade Timing Matters
- CEO Transition Uncertainty: Abrupt departure after <2 years raises execution questions
- Pre-Earnings Positioning: 14 days before Q4 results with elevated IV
- Restructuring Overhang: $135M charges and morale impact not fully priced
- Analyst Downgrades: Evercore cut PT from $300 to $200
📉 Technical & Volatility Context
YTD Performance
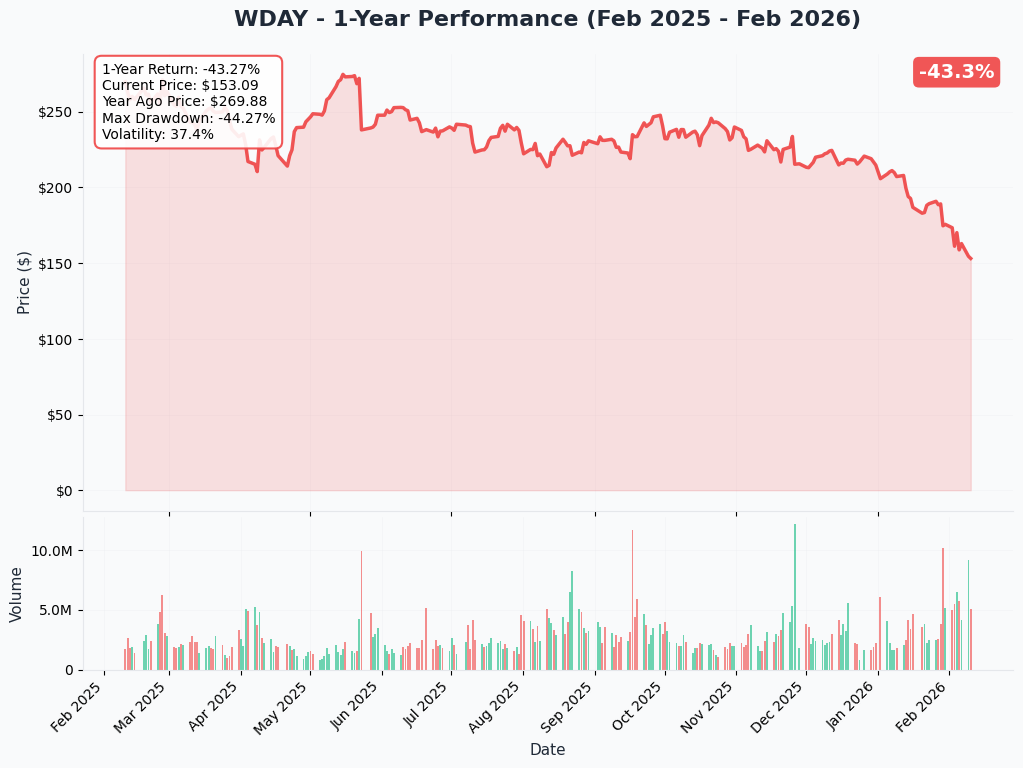
Key Levels:
- 52-Week High: $249.92 (March 2025)
- 52-Week Low: $154.00 (Feb 9, 2026) - Just breached
- YTD Decline: -38%
- 30-Day Decline: -22.85%
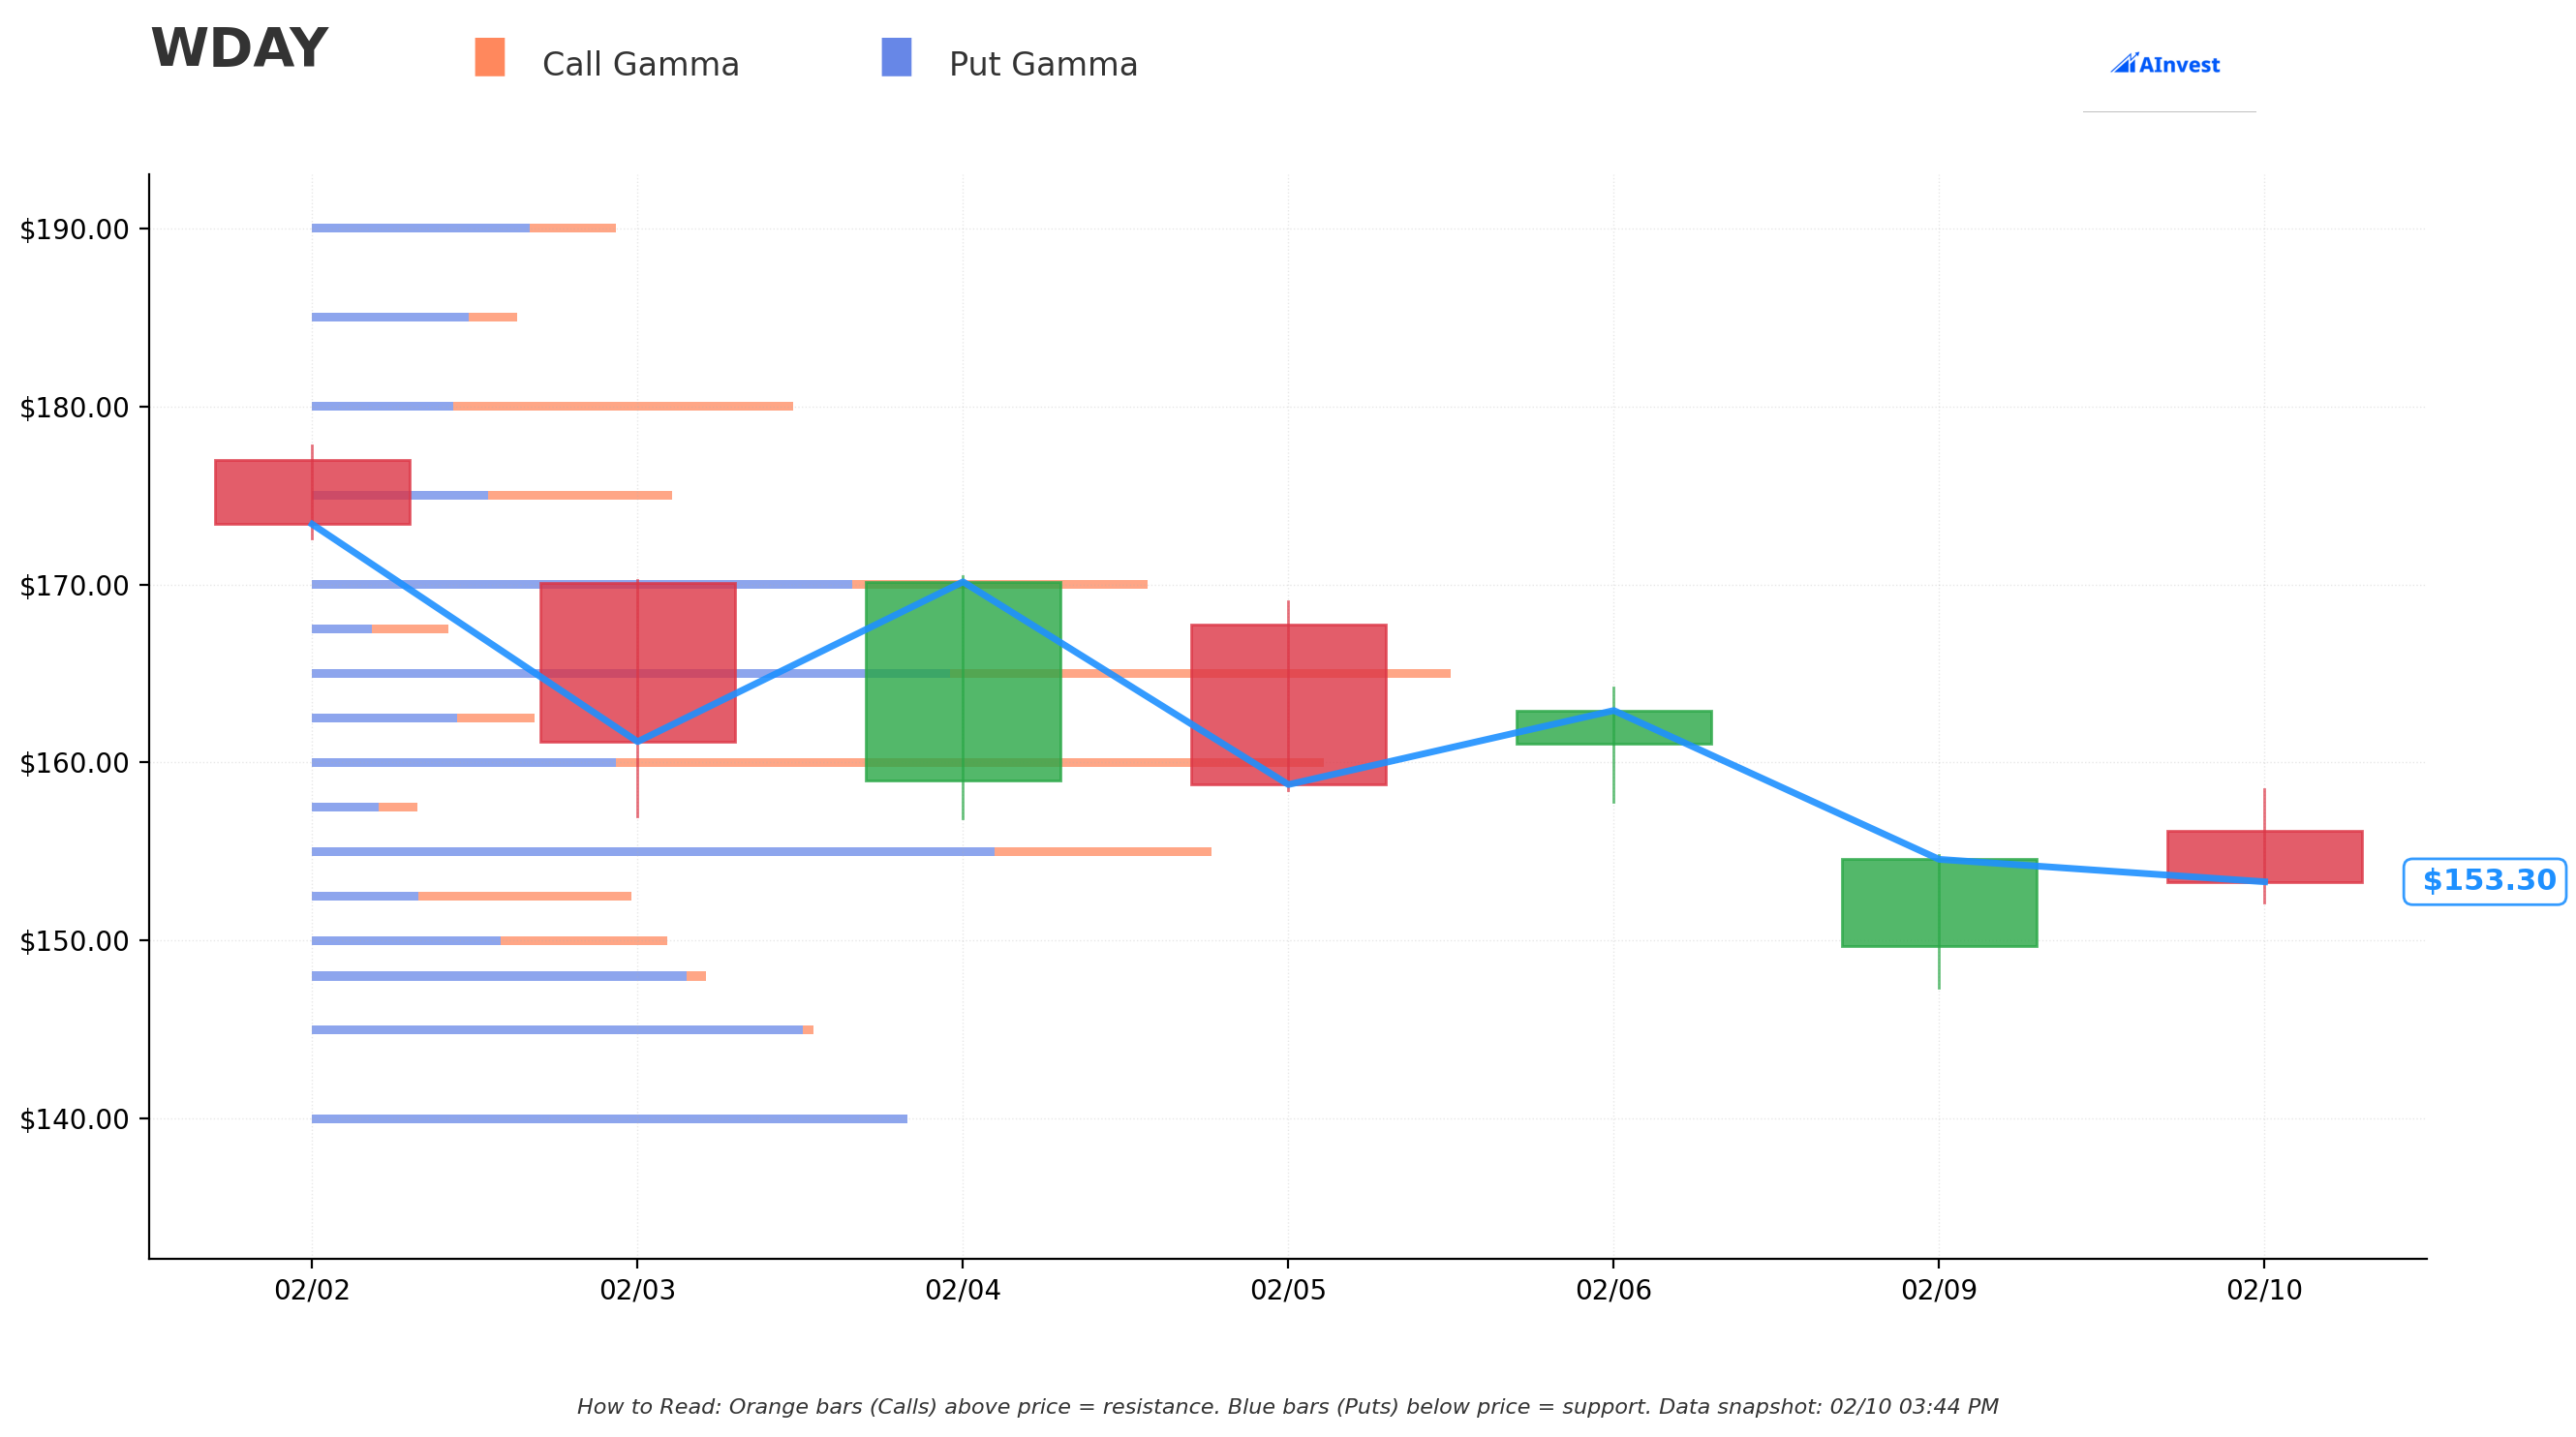
Gamma Support/Resistance
Implied Move Analysis
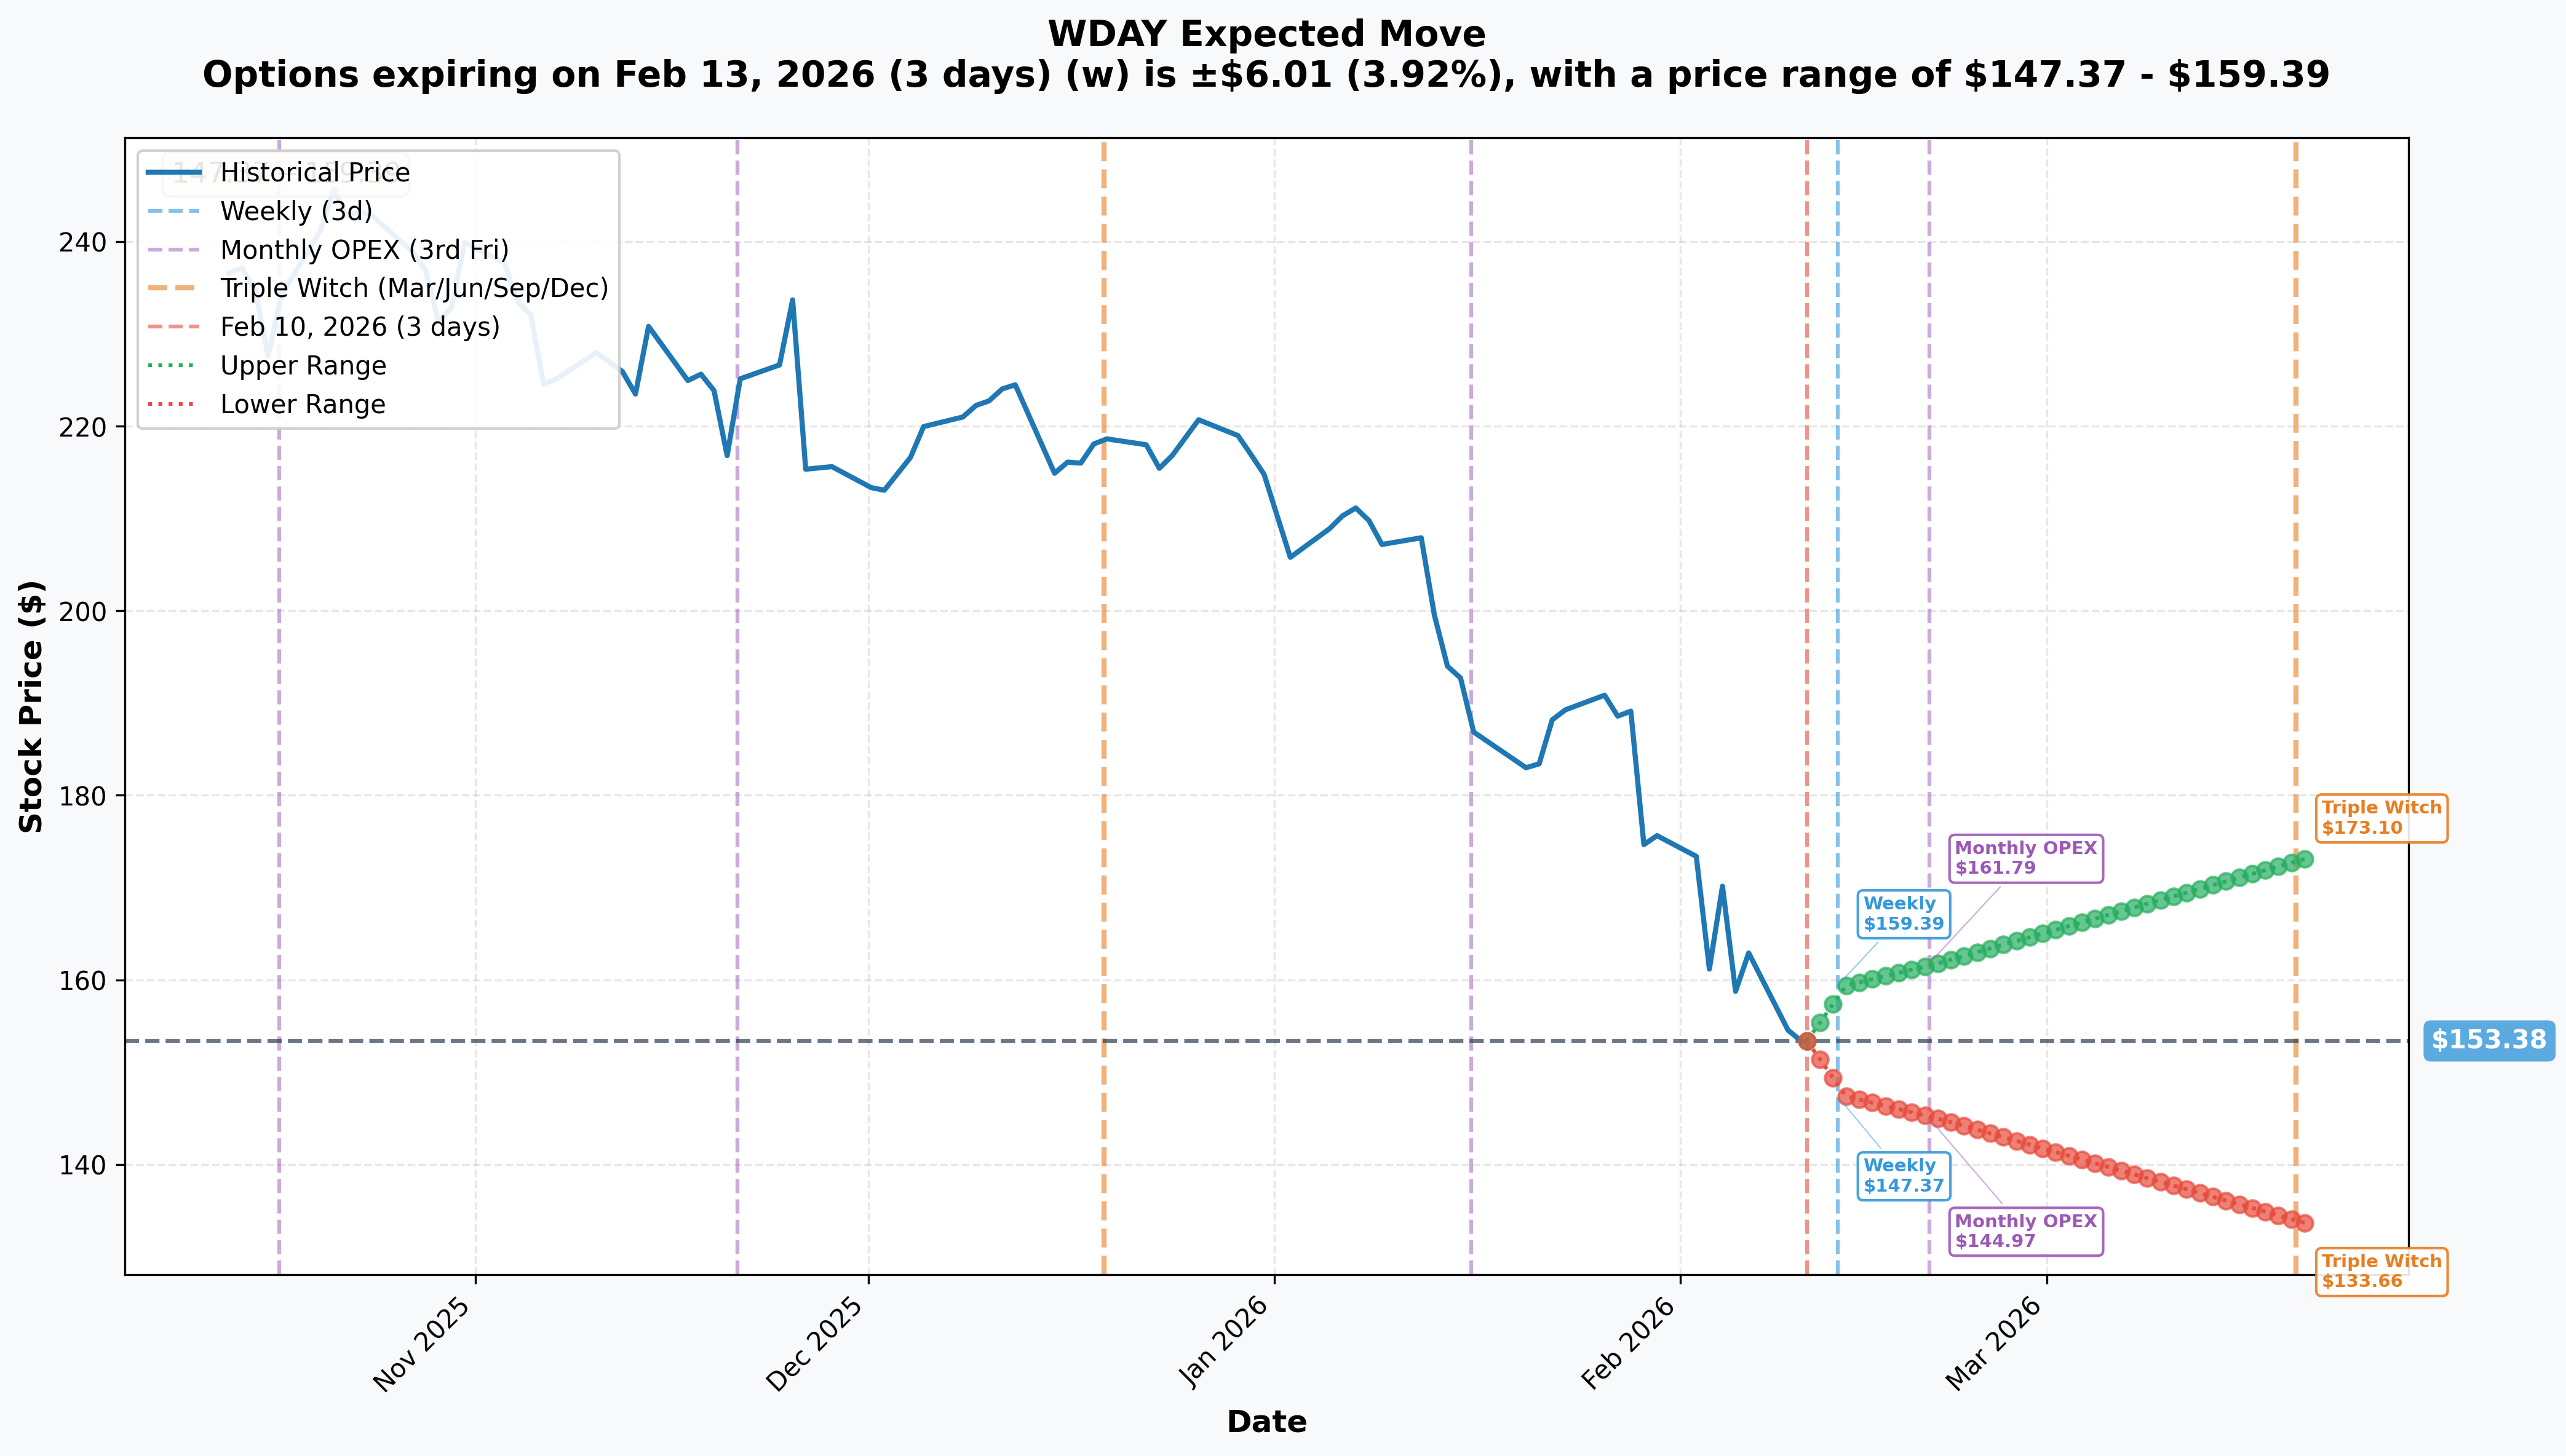
| Timeframe | Implied Move | Range |
|---|---|---|
| Weekly (Feb 13) | 3.92% | $147.37 - $159.39 |
| Monthly OPEX (Feb 20) | 5.49% | $144.97 - $161.79 |
| Triple Witch (Mar 20) | 12.86% | $133.66 - $173.10 |
Note: The Jan 2027 LEAPS trade extends well beyond current IV pricing, suggesting the trader expects prolonged underperformance rather than a quick mean-reversion.
🏛️ Institutional Positioning Signals
Open Interest Analysis
| Strike | Type | OI Before | Trade Volume | Signal |
|---|---|---|---|---|
| $180 | Put | 96 | 1,100 | 🔴 11x normal volume - New position |
| $195 | Call | 9 | 5,050 | 🔴 561x normal volume - New position |
Interpretation: Near-zero prior OI confirms this is fresh institutional positioning, not a hedge adjustment or roll from existing positions.
Trade Characteristics
| Metric | Value | Institutional Signal |
|---|---|---|
| Total Premium | $11.5M | ✅ Large notional |
| Execution Quality | 3 prints, 15 min window | ✅ Algo execution |
| Strike Selection | LEAPS, ITM put | ✅ Sophisticated structure |
| Net Position | Credit | ✅ Financed trade |
Institutional Ownership Context
- Vanguard: 11.74% (25.0M shares)
- BlackRock: ~7.68%
- T. Rowe Price: ~5.09%
- Recent Insider Sales: $17.58M on Jan 8, 2026 (6 transactions)
📊 Company Fundamentals
Financial Snapshot
| Metric | Q3 FY26 | YoY Change |
|---|---|---|
| Total Revenue | $2.43B | +12.6% |
| Subscription Revenue | $2.24B | +14.6% |
| Operating Margin (Non-GAAP) | 28.5% | +270 bps |
| EPS (Non-GAAP) | $2.32 | +22.8% |
| Subscription Backlog | $25.96B | +17% |
| Gross Revenue Retention | 97% | Stable |
Valuation Metrics
| Metric | Current | Historical Avg |
|---|---|---|
| P/E (Non-GAAP) | ~17x | 35x |
| P/S | ~4.5x | 8x |
| EV/Revenue | ~4.2x | 7x |
Note: Valuation compression reflects growth deceleration from 20%+ to 14% subscription growth.
⚖️ Bull vs Bear Case
🐻 Bear Case (Supports This Trade)
- Leadership Vacuum: CEO departure after <2 years signals deeper issues
- Growth Deceleration: 14% subscription growth vs 20%+ historical
- Restructuring Drag: $135M charges, 400 layoffs impact operations
- Competitive Pressure: SAP Joule AI more extensible, Oracle dominant internationally
- Elongated Sales Cycles: Enterprise customers delaying decisions
- Technical Breakdown: 52-week lows breached, no clear support until $130-140
- Analyst Skepticism: Evercore "leaky bucket" commentary, PT cuts accelerating
🐂 Bull Case (Trade Risks)
- Founder Return: Bhusri's deep institutional knowledge stabilizes company
- Fundamentals Intact: 97% retention, $26B backlog, positive cash flow
- AI Momentum: 75% of new deals include AI products
- Valuation Support: Multi-year low P/S may attract value buyers
- IT Spending Tailwind: Enterprise software +15% in 2026 (Gartner)
- Oversold Bounce: RSI at extreme levels, mean-reversion potential
🎯 Trade Thesis Summary
What The Trader Believes
- WDAY stays below $195 through Jan 2027: Keeps full $7.1M call premium
- Further downside likely: Put gains exceed $25.47 intrinsic value per $1 decline
- CEO transition creates prolonged uncertainty: Not a one-day event
- Q4 earnings and FY27 guidance disappoint: Elongated cycles and restructuring drag
- No acquisition or takeout: $195 cap implies no belief in strategic M&A
Probability Assessment
| Scenario | Probability | P/L Impact |
|---|---|---|
| WDAY <$150 by Jan 2027 | 35% | +$10M+ |
| WDAY $150-$180 | 30% | +$3-10M |
| WDAY $180-$195 | 20% | +$2.7M |
| WDAY >$195 | 15% | Variable loss |
Expected Value: Strongly positive given structure and timing.
⚠️ Risk Disclosures
Key Risks to This Trade
- Acquisition Premium: Strategic buyer could push WDAY above $195
- AI Catalyst Surge: Breakthrough Illuminate adoption drives re-rating
- Q4 Beat-and-Raise: Strong FY27 guidance triggers squeeze
- Mean Reversion: 38% decline already may be overdone
- Short Squeeze: Low float + options positioning creates squeeze risk
Position Sizing Considerations
- $11.5M notional suggests institutional fund with $500M+ AUM
- Position represents ~0.03% of WDAY market cap
- 5,050 short calls = potential obligation to deliver 505,000 shares
📋 Monitoring Checklist
Pre-Earnings (Feb 10-24)
- Track analyst estimate revisions
- Monitor short interest changes
- Watch for additional LEAPS activity
- Follow insider transaction filings
Post-Earnings (Feb 24+)
- FY27 subscription growth guidance (target: >15% to negate trade)
- Operating margin trajectory
- Commentary on CEO transition and strategic direction
- Customer churn metrics
Ongoing
- Weekly OI changes at $180 and $195 strikes
- Competitor earnings (SAP, Oracle) for sector context
- AI product adoption metrics
🔗 Quick Links
- Stock: WDAY on AInvest
- $180 Put: WDAY250115P180
- $195 Call: WDAY250115C195
- Company Website: workday.com
Analysis generated by Options Flow Analytics | February 10, 2026
Disclaimer: This analysis is for informational purposes only and does not constitute investment advice. Options trading involves substantial risk of loss. Past performance is not indicative of future results.