🚨 XLB: $6.3M Put Spread ROLL Signals Institutional Fear - Materials Sector Brace for Impact!
📅 February 3, 2026 | 🔥 EXTREMELY UNUSUAL Activity Detected
🎯 The Quick Take
Someone just rolled UP their put protection on XLB, spending a net $1.7M to upgrade from $46 puts to $48.5 puts - that's moving their downside hedge closer to current prices! With a z-score of 23.35 (that's 23x normal activity!), this isn't your typical portfolio adjustment. When big money pays MORE to protect against SMALLER drops, they're telling you something: they see trouble coming for materials stocks, and soon.
💼 Company Overview
XLB - Materials Select Sector SPDR Fund
| Metric | Value |
|---|---|
| Type | ETF (Exchange-Traded Fund) |
| Exchange | NYSE Arca |
| AUM | $6.12B |
| Current Price | $50.62 |
| 52-Week Range | $36.56 - $50.62 |
| Expense Ratio | 0.08% |
| Dividend Yield | 1.92% |
What XLB Tracks: The Materials Select Sector tracks the S&P 500 materials sector - think chemicals, metals, construction materials, and containers. Top holdings include industrial gas giant Linde (13.35%), gold miner Newmont (8.71%), and copper producer Freeport-McMoRan (5.88%).
Why It Matters: Materials is the canary in the coal mine for economic cycles. When institutions hedge materials exposure, they're often betting on economic slowdown.
💰 The Option Flow Breakdown
📊 What Just Happened
Trade 1 - Closing the Old Protection:
| Field | Value |
|---|---|
| ⏰ Time | 10:46:04 |
| 📉 Direction | SELL PUT (STC) |
| 📅 Expiration | 2026-03-20 |
| 🎯 Strike | $46 |
| 🔥 Volume | 64,000 contracts |
| 💰 Premium | $2.3M received |
| ⚠️ Z-Score | 3.72 (EXTREMELY UNUSUAL) |
Trade 2 - Opening New, Closer Protection:
| Field | Value |
|---|---|
| ⏰ Time | 10:46:04 |
| 📈 Direction | BUY PUT (BTO) |
| 📅 Expiration | 2026-03-20 |
| 🎯 Strike | $48.5 |
| 🔥 Volume | 64,000 contracts |
| 💰 Premium | $4M paid |
| ⚠️ Z-Score | 23.35 (23x normal!) |
| 📈 Vol/OI Ratio | 4.267 |
🧾 Net Position: 💸 $1.7M debit to ROLL UP protection from $46 to $48.5
🤓 What This Actually Means
Let me break this down in plain English:
The Old Position: This trader had puts at $46 - protection that kicks in if XLB drops ~9% from current levels.
The New Position: They upgraded to $48.5 puts - protection that kicks in after just a ~4% drop.
Why This is HUGE: 1️⃣ They PAID $1.7M extra for this upgrade (rolls usually try to collect premium, not pay it) 2️⃣ Same expiration date means they expect trouble BEFORE March 20 3️⃣ Moving protection closer to current price = expecting near-term weakness 4️⃣ 64,000 contracts controls 6.4M shares worth ~$324M of XLB
Translation: Someone managing a massive materials position just told you they'd rather pay $1.7M to protect against a small drop than keep cheaper insurance against a bigger crash. That screams "I think we're going down, and SOON."
📈 Technical Setup / Chart Check-Up
YTD Price Action
XLB has rallied 8.64% YTD and just touched its 52-week high of $50.62. But here's the thing - this might be as good as it gets.
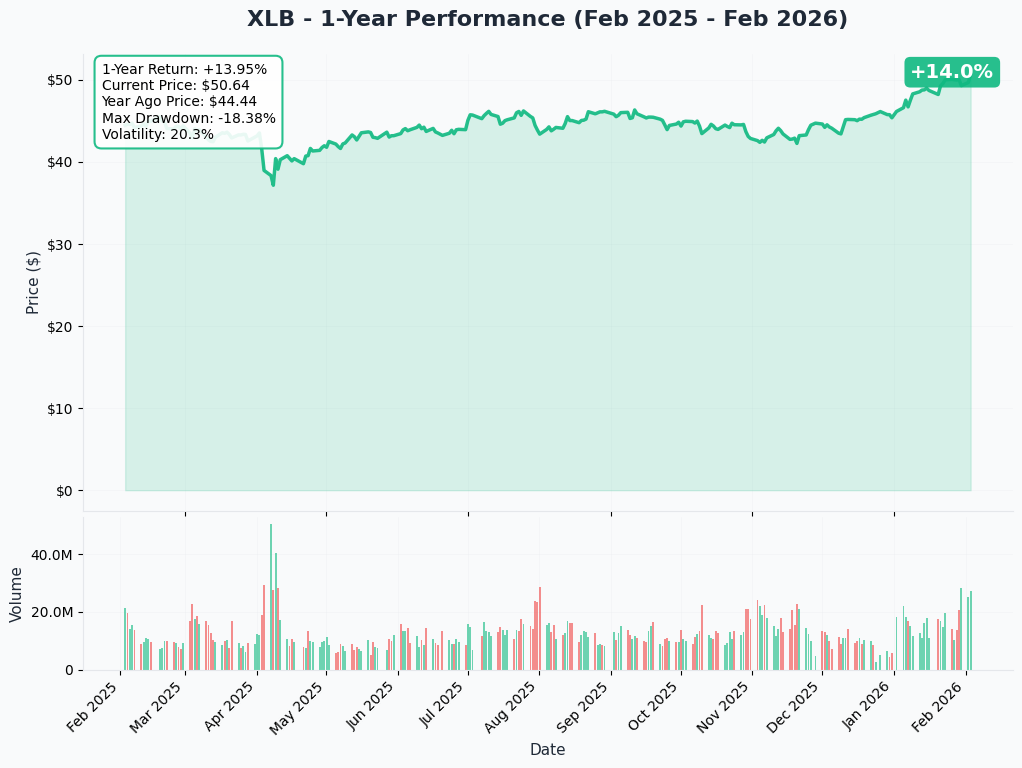
The ETF crossed above its 50-day moving average in December 2025 and gained 7.64% in just one month (December 16 - January 16). That's a solid run, but being at 52-week highs while someone rolls UP their put protection? That's a classic "smart money hedging at the top" signal.
📊 Gamma-Based Support & Resistance Analysis
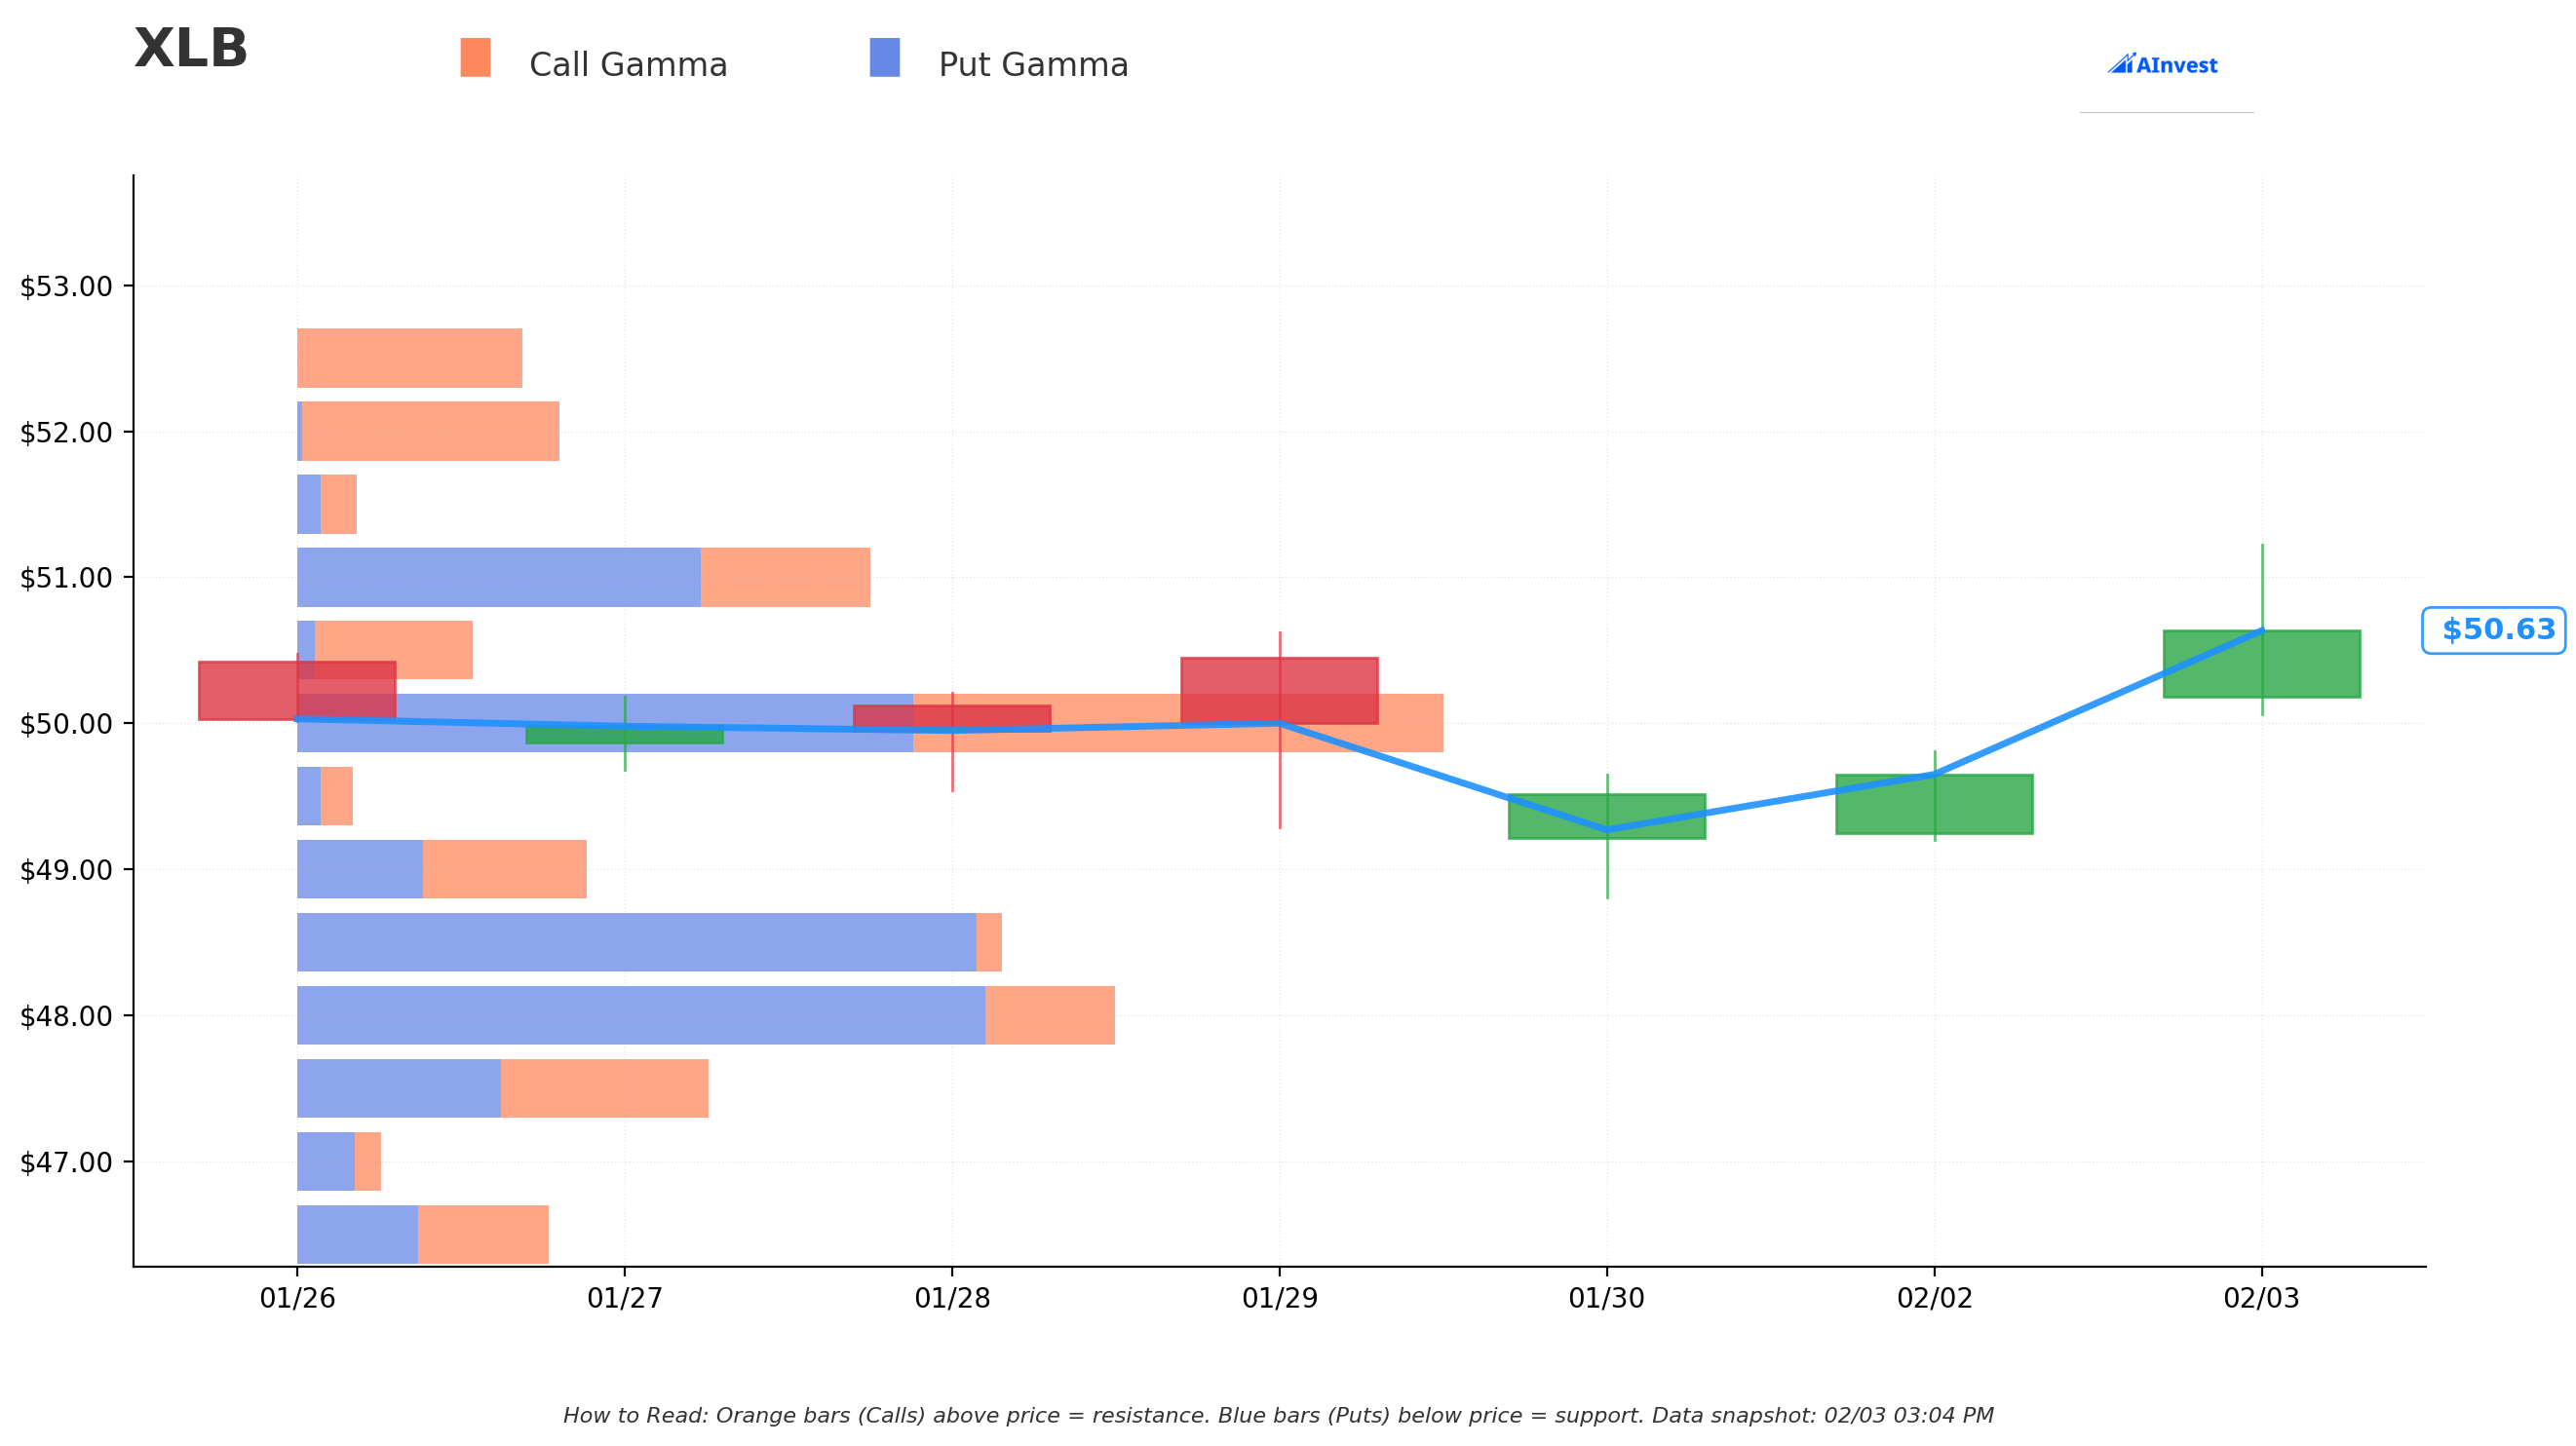
Key Gamma Levels from GEX Data:
| Strike | Gamma Exposure | Distance from Price | Significance |
|---|---|---|---|
| $51 | 5.1B | +0.7% | 🟠 Nearest resistance |
| $50 | 10.1B | -1.2% | 🔵 STRONG support |
| $48.5 | 6.2B | -4.2% | 🔵 New put strike level |
| $48 | 7.2B | -5.2% | 🔵 Secondary support |
| $46 | 16.4B | -9.1% | 🔵 MASSIVE support wall |
What the Gamma Tells Us:
🔵 $46 is a FORTRESS - That 16.4B gamma wall means market makers are heavily positioned there. Price would have serious trouble breaking below.
🔵 $50 as First Defense - The 10.1B gamma at $50 creates initial support just below current prices.
🟠 Limited Upside - Only 5.1B at $51 resistance, but XLB is already AT its highs with deteriorating fundamentals.
The Roll Makes Sense: The trader moved from $46 (the floor) to $48.5 (the soft zone). They're not worried about a crash to $46 - they're worried about a grind down to the $48-49 area.
📉 Implied Move Analysis
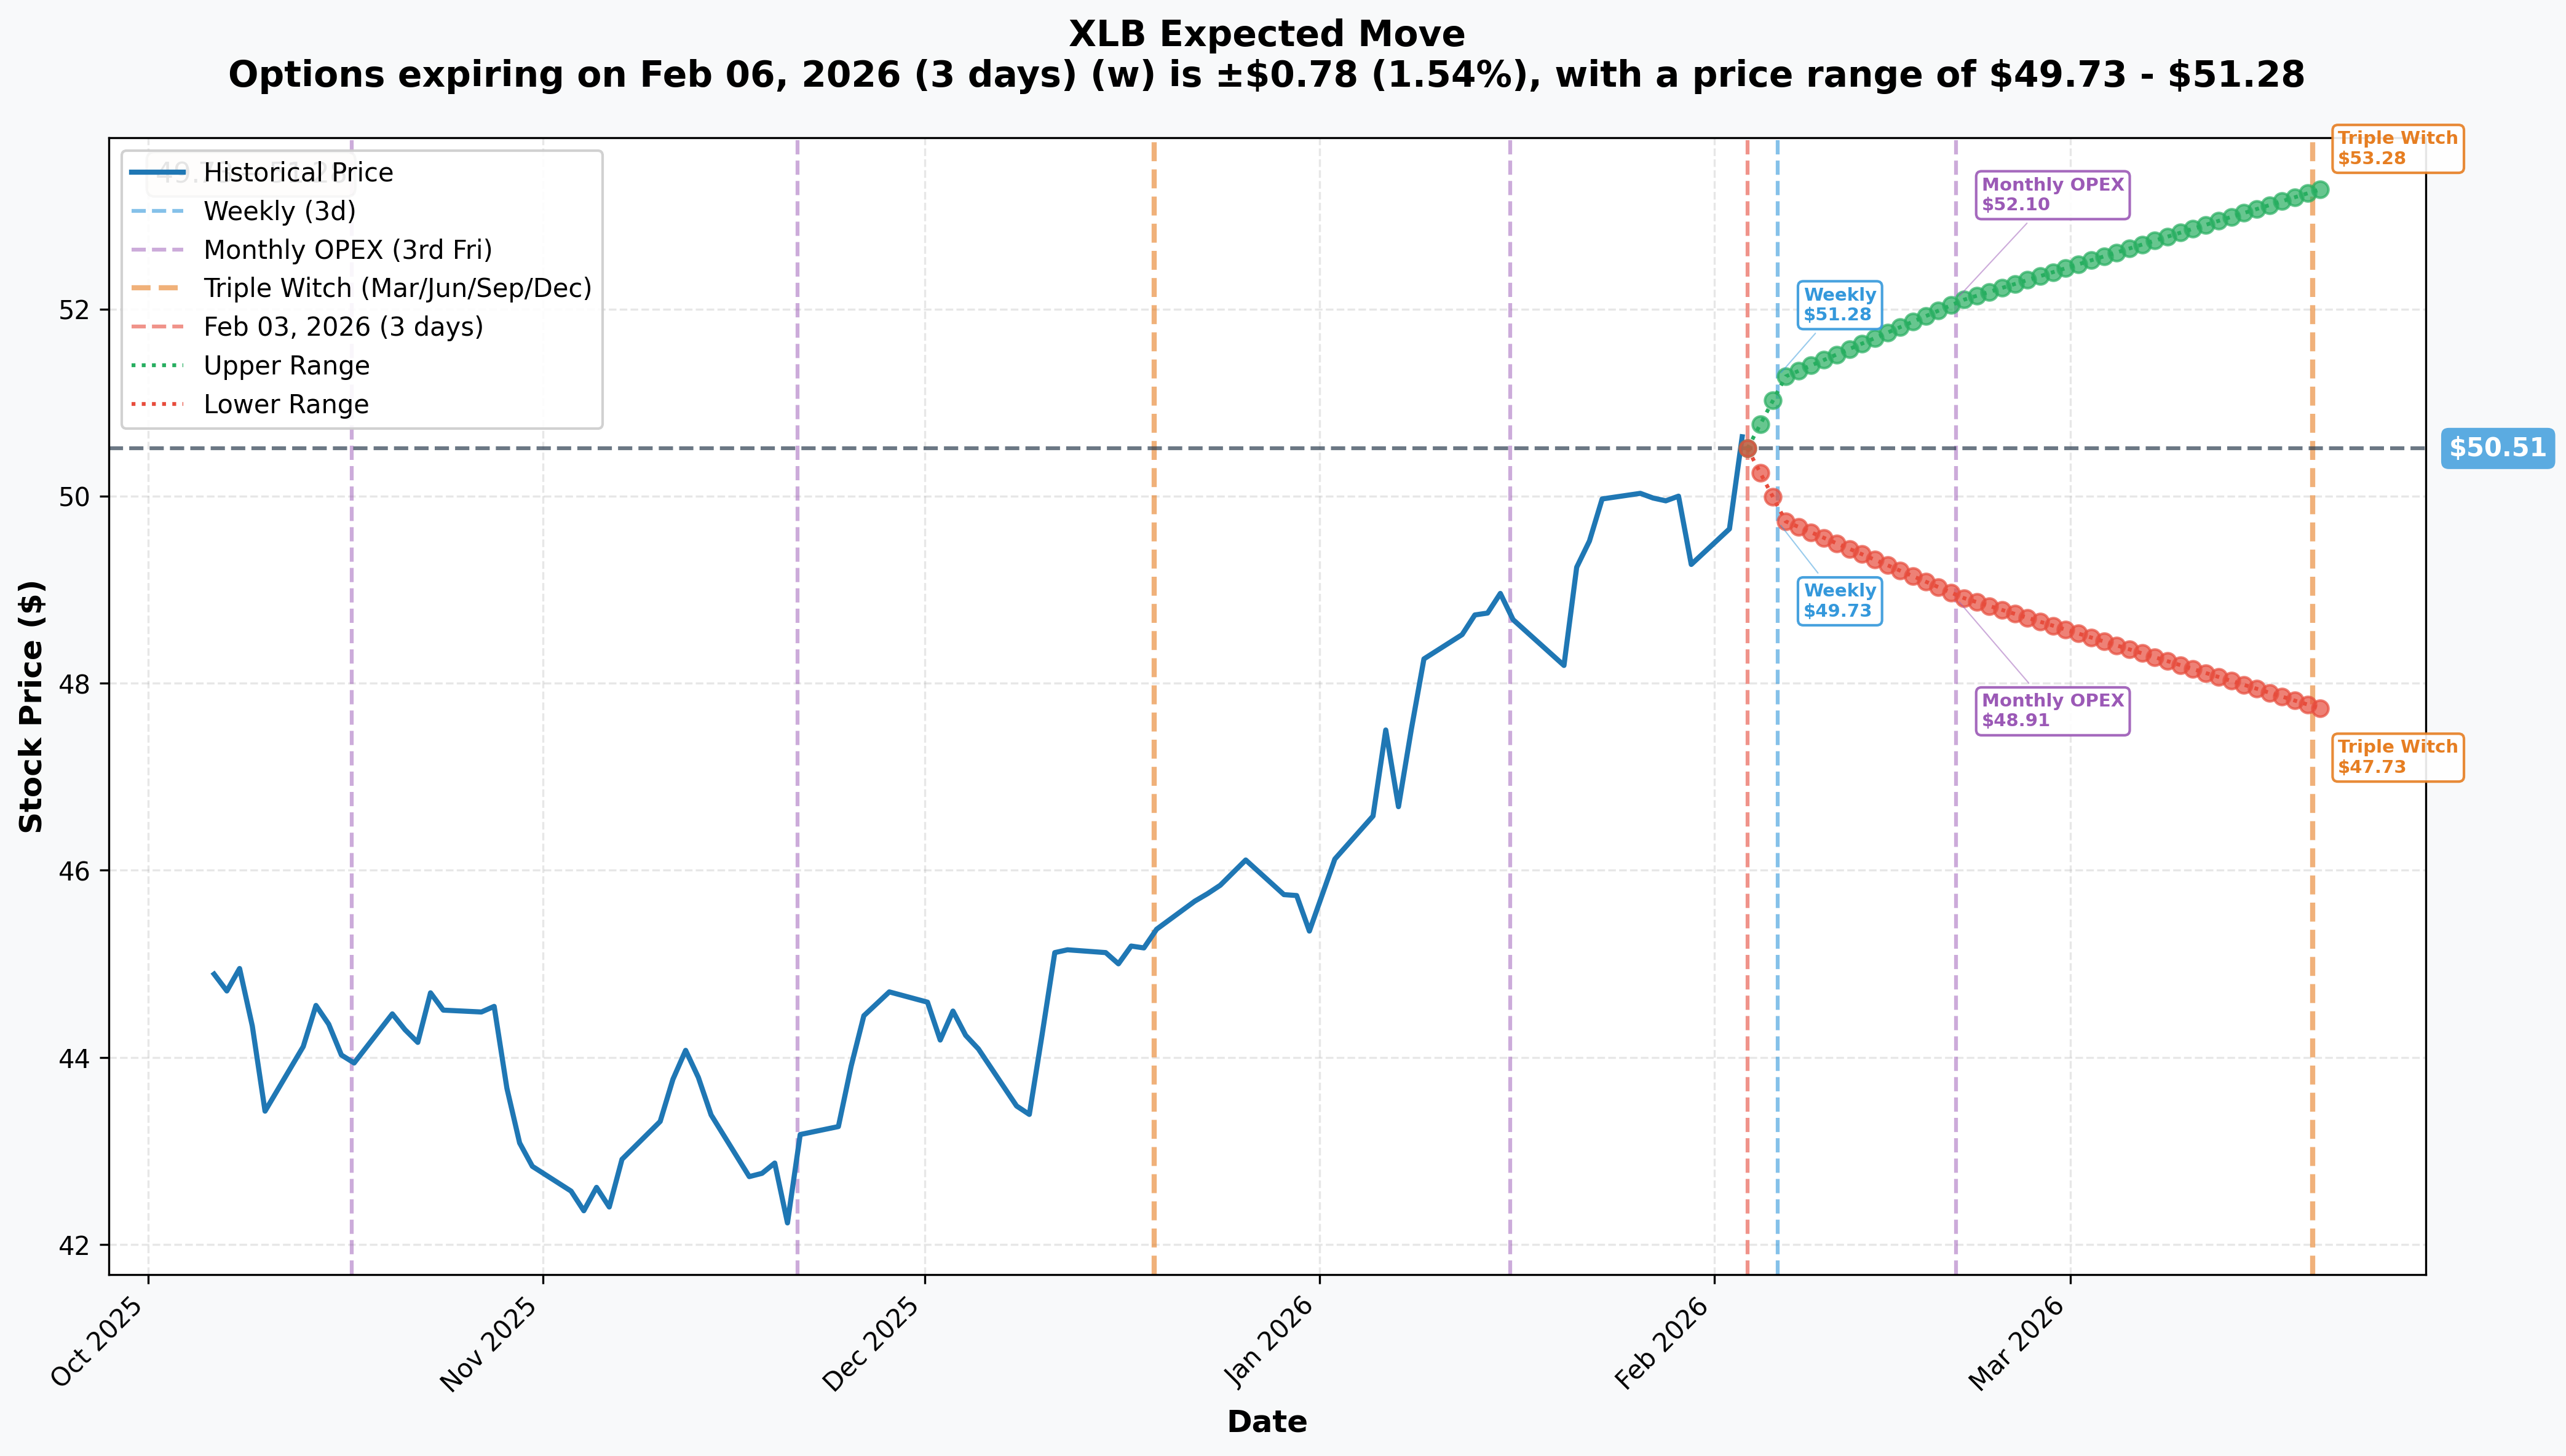
Based on current options pricing, the market expects XLB to move approximately +/- 3-4% by March expiration.
Implied Move Scenarios: ⬆️ Upside Target: ~$52.50 (resistance zone) ⬇️ Downside Target: ~$48.50 (coincidentally, the new put strike!)
The trader positioned their new protection RIGHT at the expected downside move. Smart money is betting on XLB hitting that lower bound.
🎪 Catalysts
📅 Upcoming Events (February - July 2026)
| Date | Event | Potential Impact |
|---|---|---|
| Feb 27, 2026 | Delayed Construction Spending Data (Nov/Dec 2025) | 🚨 HIGH - First look at Q4 2025 trends post-shutdown |
| Q1 2026 | Sherwin-Williams Earnings (~April 27) | ⚠️ MEDIUM - Q1 EPS est: $2.37, already guided below consensus |
| Q1 2026 | Linde Earnings | ⚠️ MEDIUM - Backlog conversion key metric |
| Early 2026 | Supreme Court Tariff Ruling | 🚨 HIGH - Could reshape 50% steel/aluminum tariffs |
| Ongoing | NAHB Housing Market Index | ⚠️ MEDIUM - Fell to 37 in January (near pandemic lows) |
⏪ Recent Catalysts (Already Happened)
⚠️ Tariff Escalation (June 2025 - Present)
- 50% steel and aluminum tariffs now in effect under Proclamation 10947
- 407 additional product categories added to Section 232 tariffs
- US Midwest Premium up 20% YTD for steel, 65% YTD for aluminum
- Largest US tax increase as % of GDP since 1993 - $1,500 per household
📉 Chemical Industry Downcycle Confirmed
- 2026 US chemical production projected to CONTRACT 0.2% - originally expected +3.5%!
- Sherwin-Williams guided BELOW estimates citing "softer-for-longer demand"
- Overcapacity in polyethylene, polypropylene, olefins, and aromatics
🏠 Construction Spending Weakness
- October 2025: Construction spending 1.0% BELOW prior year
- First 10 months of 2025: 1.4% below prior year
- Housing starts forecast to DECLINE in 2026 (1.34M vs 1.37M in 2025)
🇨🇳 China Stimulus Disappointment
- Beijing announced consumption-focused stimulus, NOT infrastructure
- Property sector remains weak with low household confidence
- Iron ore demand outlook muted vs historical cycles
🎲 Price Targets & Probabilities
Based on gamma levels, implied move analysis, and catalyst timing:
🐻 Bear Case (Most Likely: 55% Probability)
Target: $46-48
- Chemical industry contraction materializes in earnings
- February 27 construction data disappoints
- Gold miners (Newmont) can't offset sector weakness
- Massive $46 gamma wall provides floor
⚖️ Base Case (35% Probability)
Target: $49-50.50
- XLB consolidates near current levels
- Mixed earnings with gold miners offsetting chemical weakness
- $50 gamma support holds
- Trade chop between gamma levels
🐂 Bull Case (10% Probability)
Target: $52-54
- Surprise China infrastructure pivot
- Fed signals aggressive rate cuts
- Gold rally continues driving Newmont higher
- Tariff legal challenges succeed
Why Bear Case is Most Likely: 1️⃣ Someone just paid $1.7M to move protection CLOSER to current price 2️⃣ Z-score of 23.35 is 23x normal - this isn't noise 3️⃣ Chemical industry (largest XLB sector) in confirmed contraction 4️⃣ Housing/construction data trending negative 5️⃣ XLB at 52-week highs with deteriorating fundamentals = classic setup for reversal
💡 Trading Ideas
🛡️ Conservative: "Materials Insurance" (Low Risk)
Strategy: Buy March 2026 $49 Put Why This Works: You're buying protection just below current price, similar to what the institutional trader is doing. If XLB drops to the $48 area (where gamma support clusters), you profit.
| Detail | Value |
|---|---|
| Entry | Buy XLB Mar 20 $49 Put |
| Estimated Cost | ~$1.00-1.50/contract ($100-150 per contract) |
| Breakeven | $47.50-48.00 |
| Profit Target | $46 (move with gamma wall) |
| Max Risk | Premium paid |
| Time Horizon | 45 days |
Who This Is For: Portfolio owners wanting to hedge materials exposure through earnings season.
⚖️ Balanced: "Follow the Whale" (Medium Risk)
Strategy: Buy March 2026 $48.5/$46 Put Spread Why This Works: You're replicating the exact institutional trade. Same strikes, same expiration, just smaller size.
| Detail | Value |
|---|---|
| Entry | Buy $48.5 Put, Sell $46 Put (March 20) |
| Estimated Cost | ~$0.75-1.00/contract ($75-100 per spread) |
| Max Profit | $1.50-1.75/contract at $46 or below |
| Breakeven | ~$47.50 |
| Max Risk | Premium paid |
| Profit Potential | ~100-150% |
Who This Is For: Traders who want directional exposure with defined risk, following institutional flow.
🚀 Aggressive: "Materials Meltdown" (Higher Risk)
Strategy: Buy March 2026 $48 Put (Outright) Why This Works: Pure directional bet on XLB weakness. Higher delta than spreads means more profit per point down.
| Detail | Value |
|---|---|
| Entry | Buy XLB Mar 20 $48 Put |
| Estimated Cost | ~$0.50-0.75/contract |
| Profit Target | XLB to $46 (200-300% gain potential) |
| Stop Loss | Close if XLB breaks above $52 |
| Max Risk | 100% of premium |
Who This Is For: Traders with high conviction on materials weakness who can stomach volatility.
⚠️ Risk Factors
What Could Make This Trade WRONG:
1️⃣ Gold Rally Continues
- Newmont (8.71% of XLB) surged 32.68% in Q4 2025
- Gold hit all-time high of $5,595 on January 29, 2026
- Continued safe-haven demand could offset chemical/construction weakness
2️⃣ China Pivots to Infrastructure
- If consumption stimulus fails, Beijing could return to traditional infrastructure spending
- This would spike iron ore and base metals demand
- Materials stocks would rally hard
3️⃣ Fed Cuts Rates Aggressively
- Materials is highly interest-rate sensitive
- Lower rates = better housing affordability = construction rebound
- Rate cut cycle could trigger sector rotation into cyclicals
4️⃣ Tariff Legal Victory
- Supreme Court reviewing IEEPA tariff legality
- Favorable ruling could remove 50% steel/aluminum tariffs
- Would be massively bullish for materials margin outlook
5️⃣ Position is a Hedge, Not a Bet
- This could be a fund manager protecting long stock exposure
- The stock position could outperform the put loss
- Don't assume every put buyer is purely bearish
🎯 The Bottom Line
Real talk: When someone pays $1.7M to move their put protection CLOSER to current prices - at 52-week highs, with 23x normal volume - that's a red flag you can see from space.
The materials sector faces a perfect storm: 🔸 Chemical industry in outright contraction (-0.2% production) 🔸 Construction spending declining YoY 🔸 50% tariffs compressing margins everywhere 🔸 84% of manufacturing executives expecting recession 🔸 Housing starts projected to FALL in 2026
Action Plan:
📋 If You Own Materials Stocks: Consider hedging with puts before February 27 construction data. The institutional money is doing exactly this.
📋 If You're Looking to Trade: The $48.5/$46 put spread mirrors institutional positioning with defined risk. Sweet spot for risk/reward.
📋 If You're Bullish: Wait for confirmation. Let the February 27 data release pass. If construction surprises to the upside, you'll have a better entry anyway.
Mark Your Calendar: 📅 February 27, 2026 - Delayed construction spending data drops. This is likely what the trader is positioning for.
The Big Picture: When gold miners are the only thing holding up a materials ETF and everything else is rolling over, that's not strength - that's a warning sign dressed in shiny metal.
🔗 Quick Links
📈 XLB Stock Page 📉 XLB Mar 20 $46 Put Chart 📉 XLB Mar 20 $48.5 Put Chart
⚠️ Disclaimer: This analysis is for educational purposes only and does not constitute financial advice. Options involve significant risk of loss and are not suitable for all investors. The unusual activity highlighted may represent hedging, speculation, or portfolio rebalancing - the true intent is unknown. Always conduct your own research and consider consulting a financial advisor before trading options.
Data sourced from: Stock Analysis, Yahoo Finance, Deloitte Insights, US Census Bureau, NAHB