🐋 XLB: $11.5M Put Structure Hits the Tape -- Someone Just Built a Massive Materials Hedge!
📅 March 5, 2026 | 🔥 Unusual Activity Detected
🎯 The Quick Take
Someone just dropped $11.5M in total premium across a 3-leg put structure on XLB (Materials Select Sector SPDR Fund) -- all hitting at the exact same second. The anchor trade is a 60,000-contract $50 put sale worth $7.4M, combined with a $45/$44 put spread below it. With 43 days to April 17 expiration, and tariff chaos hammering the materials sector, this is either a massively confident bet that XLB holds above $50 -- or a sophisticated institutional unwind. Either way, $11.5M demands attention. 👀
💰 The Option Flow Breakdown
📊 What Just Happened
Here is the exact tape from 12:06:07 ET on March 5, 2026:
| Time | Symbol | Side | Buy/Sell | C/P | Strike | Volume | OI | Expiration | Size | Premium | Spot | Option Price |
|---|---|---|---|---|---|---|---|---|---|---|---|---|
| 12:06:07 | XLB | MID | SELL | PUT | $44 | 72K | 4 | 2026-04-17 | 72,000 | $2M | $51.13 | $0.28 |
| 12:06:07 | XLB | MID | BUY | PUT | $45 | 62K | 70K | 2026-04-17 | 62,208 | $2.1M | $51.13 | $0.34 |
| 12:06:07 | XLB | MID | SELL | PUT | $50 | 60K | 42 | 2026-04-17 | 60,000 | $7.4M | $51.13 | $1.23 |
🤓 What This Actually Means
Let me break this down in plain English because this trade is a doozy:
The Structure: Short Put Ladder / Put Spread Combo
🔵 Leg 1 -- SELL $50 Put (the anchor): This is the big kahuna. Someone sold 60,000 puts at the $50 strike for $1.23 each, collecting $7.4M in premium. XLB is at $51.13, so these are barely out of the money -- just $1.13 below spot. The Vol/OI ratio is 1,429x (60K volume vs. only 42 OI), meaning this position basically didn't exist before today. Z-score: 5,804 -- that is off-the-charts unusual. We're talking about activity that's roughly 5,800x above the normal statistical baseline. This kind of reading shows up maybe a handful of times a year across all tickers.
🔵 Leg 2 -- BUY $45 Put (the hedge): They bought 62,208 puts at $45 for $0.34 each, spending $2.1M. This is the downside protection -- if XLB craters, they're covered below $45. The OI here was 70K, so there was existing open interest. The Z-score of 1.69 (above average) and the "Close Long Put" classification suggest this leg may be closing an existing long $45 put position.
🔵 Leg 3 -- SELL $44 Put (the wing): They sold 72,000 puts at $44 for $0.28 each, collecting $2M. Vol/OI ratio is 18,000x (72K volume vs. only 4 OI!) -- this position literally went from nothing to 72,000 contracts in a single second. This wing partially offsets the cost of the $45 put hedge.
Net Credit/Debit Breakdown:
📈 Collected from $50P sale: +$1.23 📉 Paid for $45P purchase: -$0.34 📈 Collected from $44P sale: +$0.28 💰 Net credit per contract: ~$1.17 (roughly $7M net across ~60K contracts)
Translation for us regular folks: This trader is saying: "I believe XLB stays above $50 for the next 43 days. I'm collecting massive premium on that bet, and I'm hedging my downside between $45-$44 just in case." If XLB stays above $50 at April expiration, they keep the full ~$7M net credit. The maximum risk zone is between $44 and $45 if XLB completely falls apart.
📈 Technical Setup / Chart Check-Up
YTD Chart
XLB has been on a solid uptrend over the past year, rallying from the $37-38 lows in April 2025 to a 52-week high of $54.14. The ETF currently sits at $51, trading well above both the 50-day moving average (around $49-50) and the 200-day moving average ($47). The recent pullback from $54 to $51 represents a healthy ~5.8% consolidation.
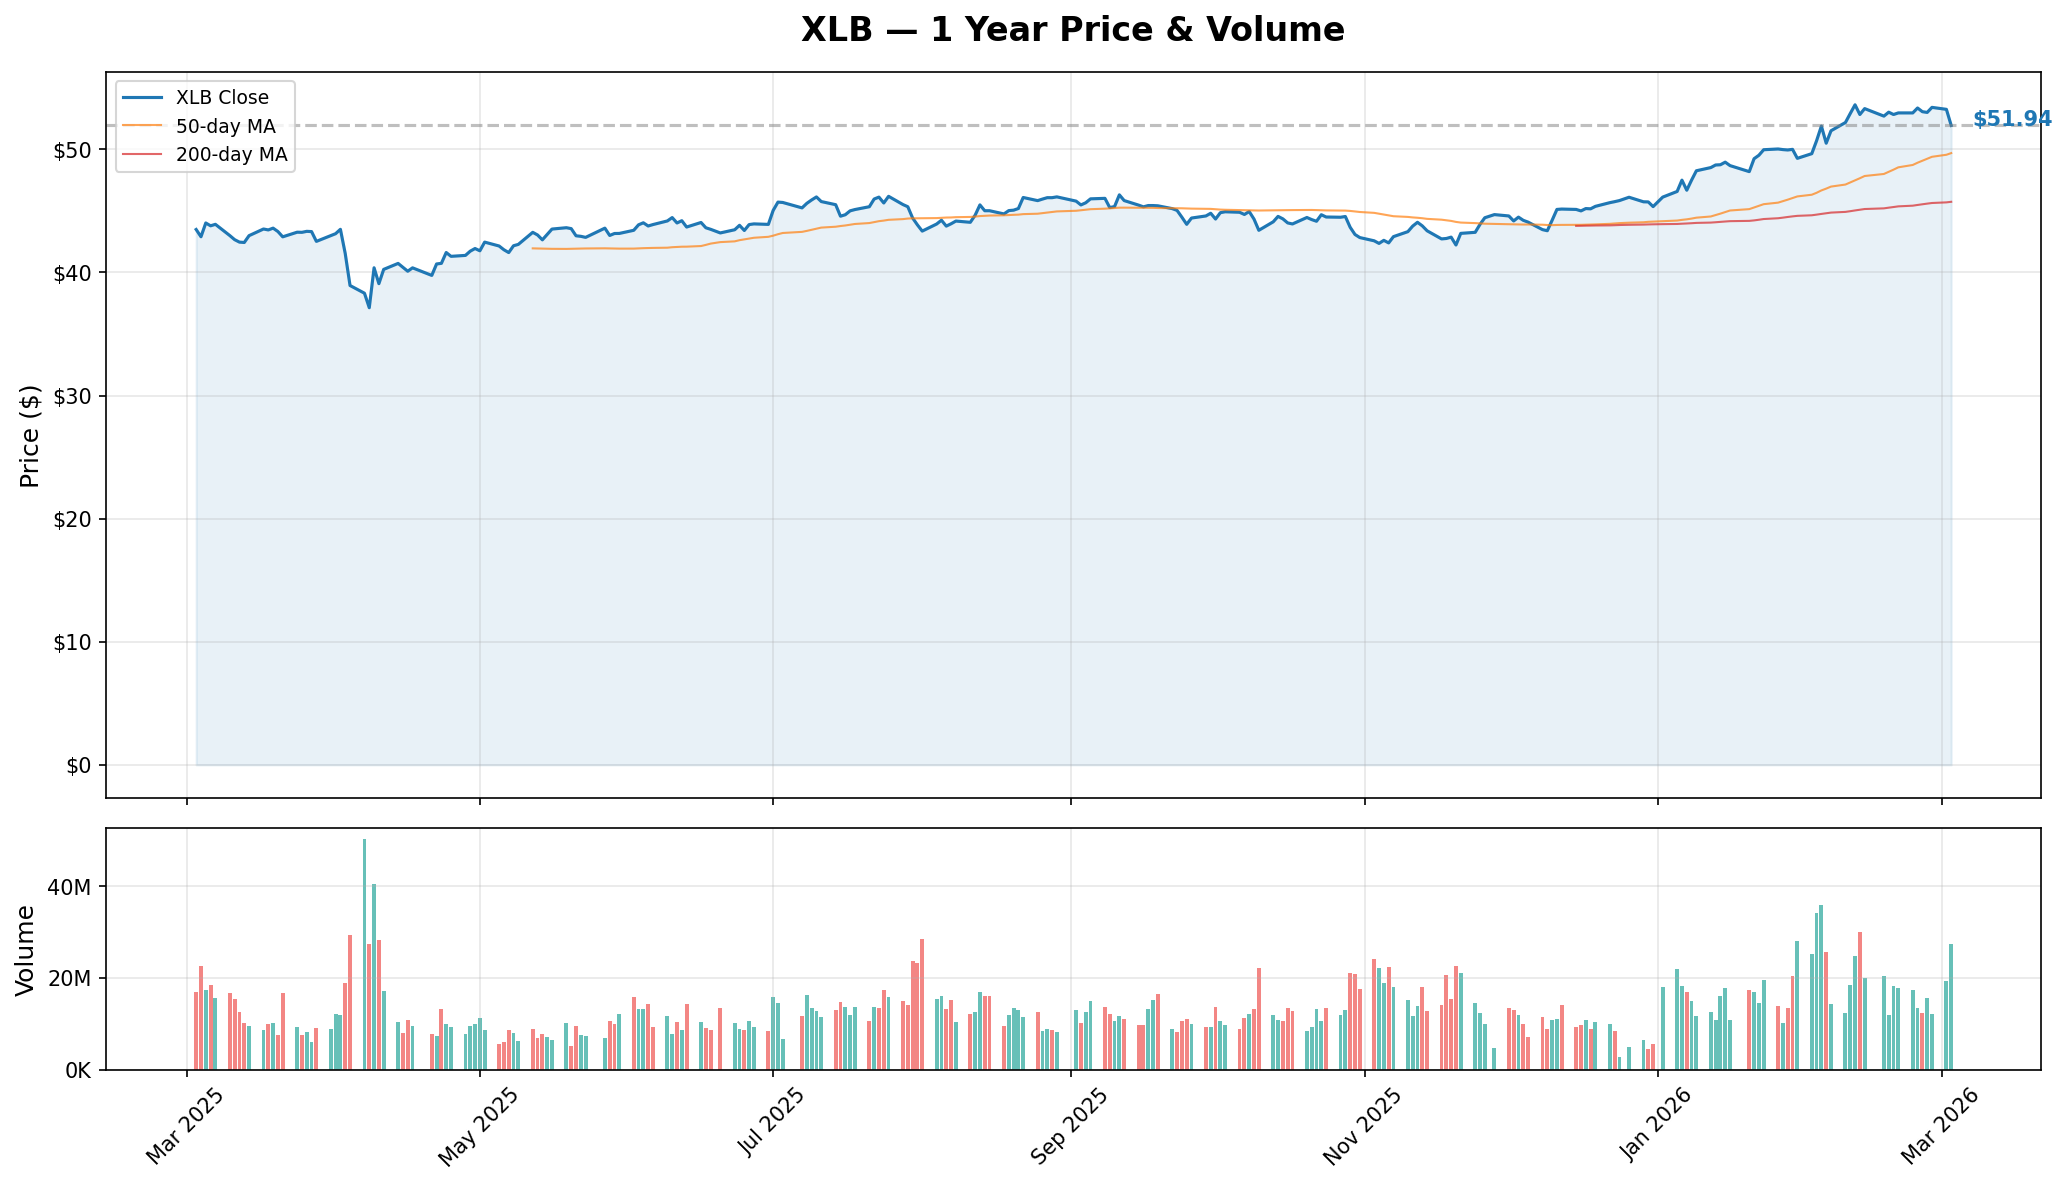
Key observations from the chart: 📈 Strong uptrend since mid-2025, with price consistently above both moving averages 📊 Recent volume spikes in late February/early March suggest institutional repositioning 🔵 The $50 level (where today's massive put was sold) aligns perfectly with the rising 50-day MA -- a natural support zone
🔵🟠 Gamma-Based Support & Resistance Analysis
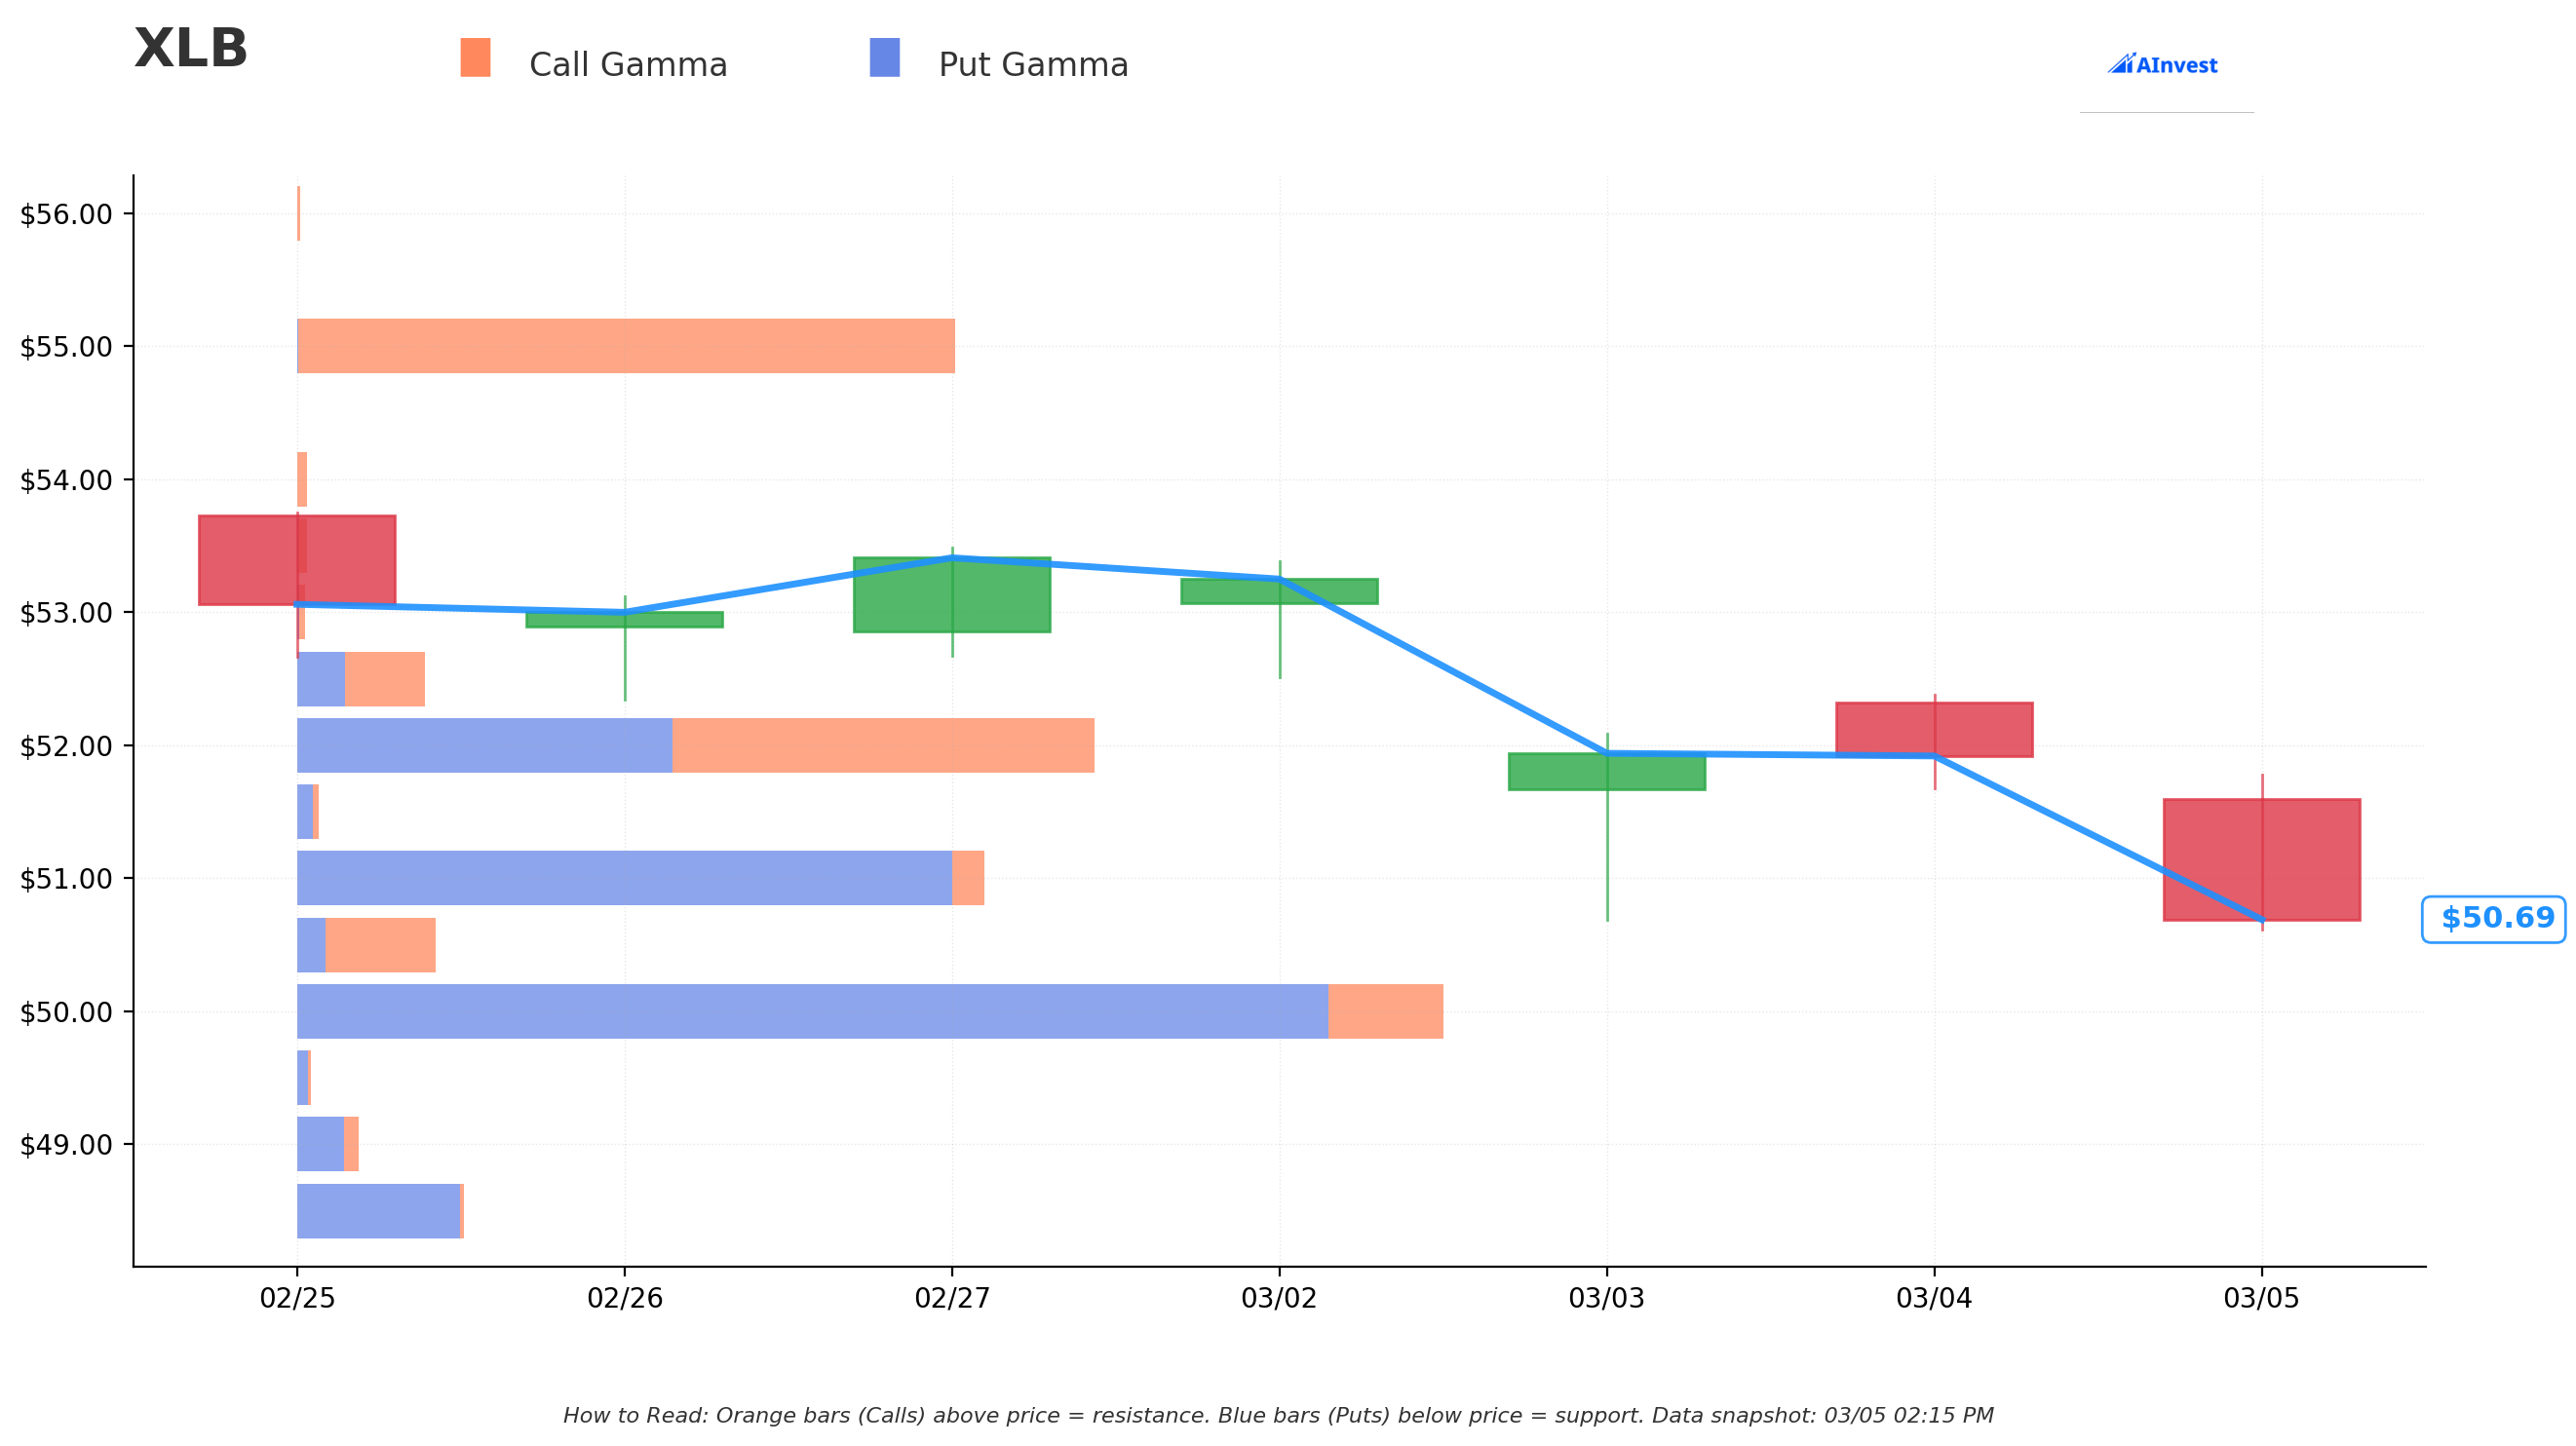
How to read this chart: 🔵 Blue bars (Put Gamma) below the current price show where options activity creates natural support floors. 🟠 Orange bars (Call Gamma) above the price show resistance ceilings. Bigger bars = stronger levels. These levels shift daily as options are traded.
Key Gamma Levels:
📊 $50 Strike -- MASSIVE Put Gamma Support: This is by far the largest gamma concentration on the board. The enormous 60K put sale today adds significant dealer gamma at $50, which acts as a magnet. When dealers are long gamma at a strike (from buying puts that were sold to them, then hedging), they tend to buy dips and sell rips -- stabilizing price around that level. This $50 strike is now a gamma wall.
📊 $51 Strike -- Current battleground: Mixed gamma with both put and call activity. Price is oscillating right here.
📊 $52-$53 Strikes -- Near-term resistance: Call gamma builds up here, especially from earlier sessions. Orange bars visible in recent days suggest sellers at these levels.
📊 $55 Strike -- Upside ceiling: Significant call gamma from prior weeks shows the market capped upside at $55 before pulling back.
📊 $48-$49 Strikes -- Secondary support: Some put gamma below, but the $50 level is far more dominant after today's flow.
📊 Implied Move Analysis
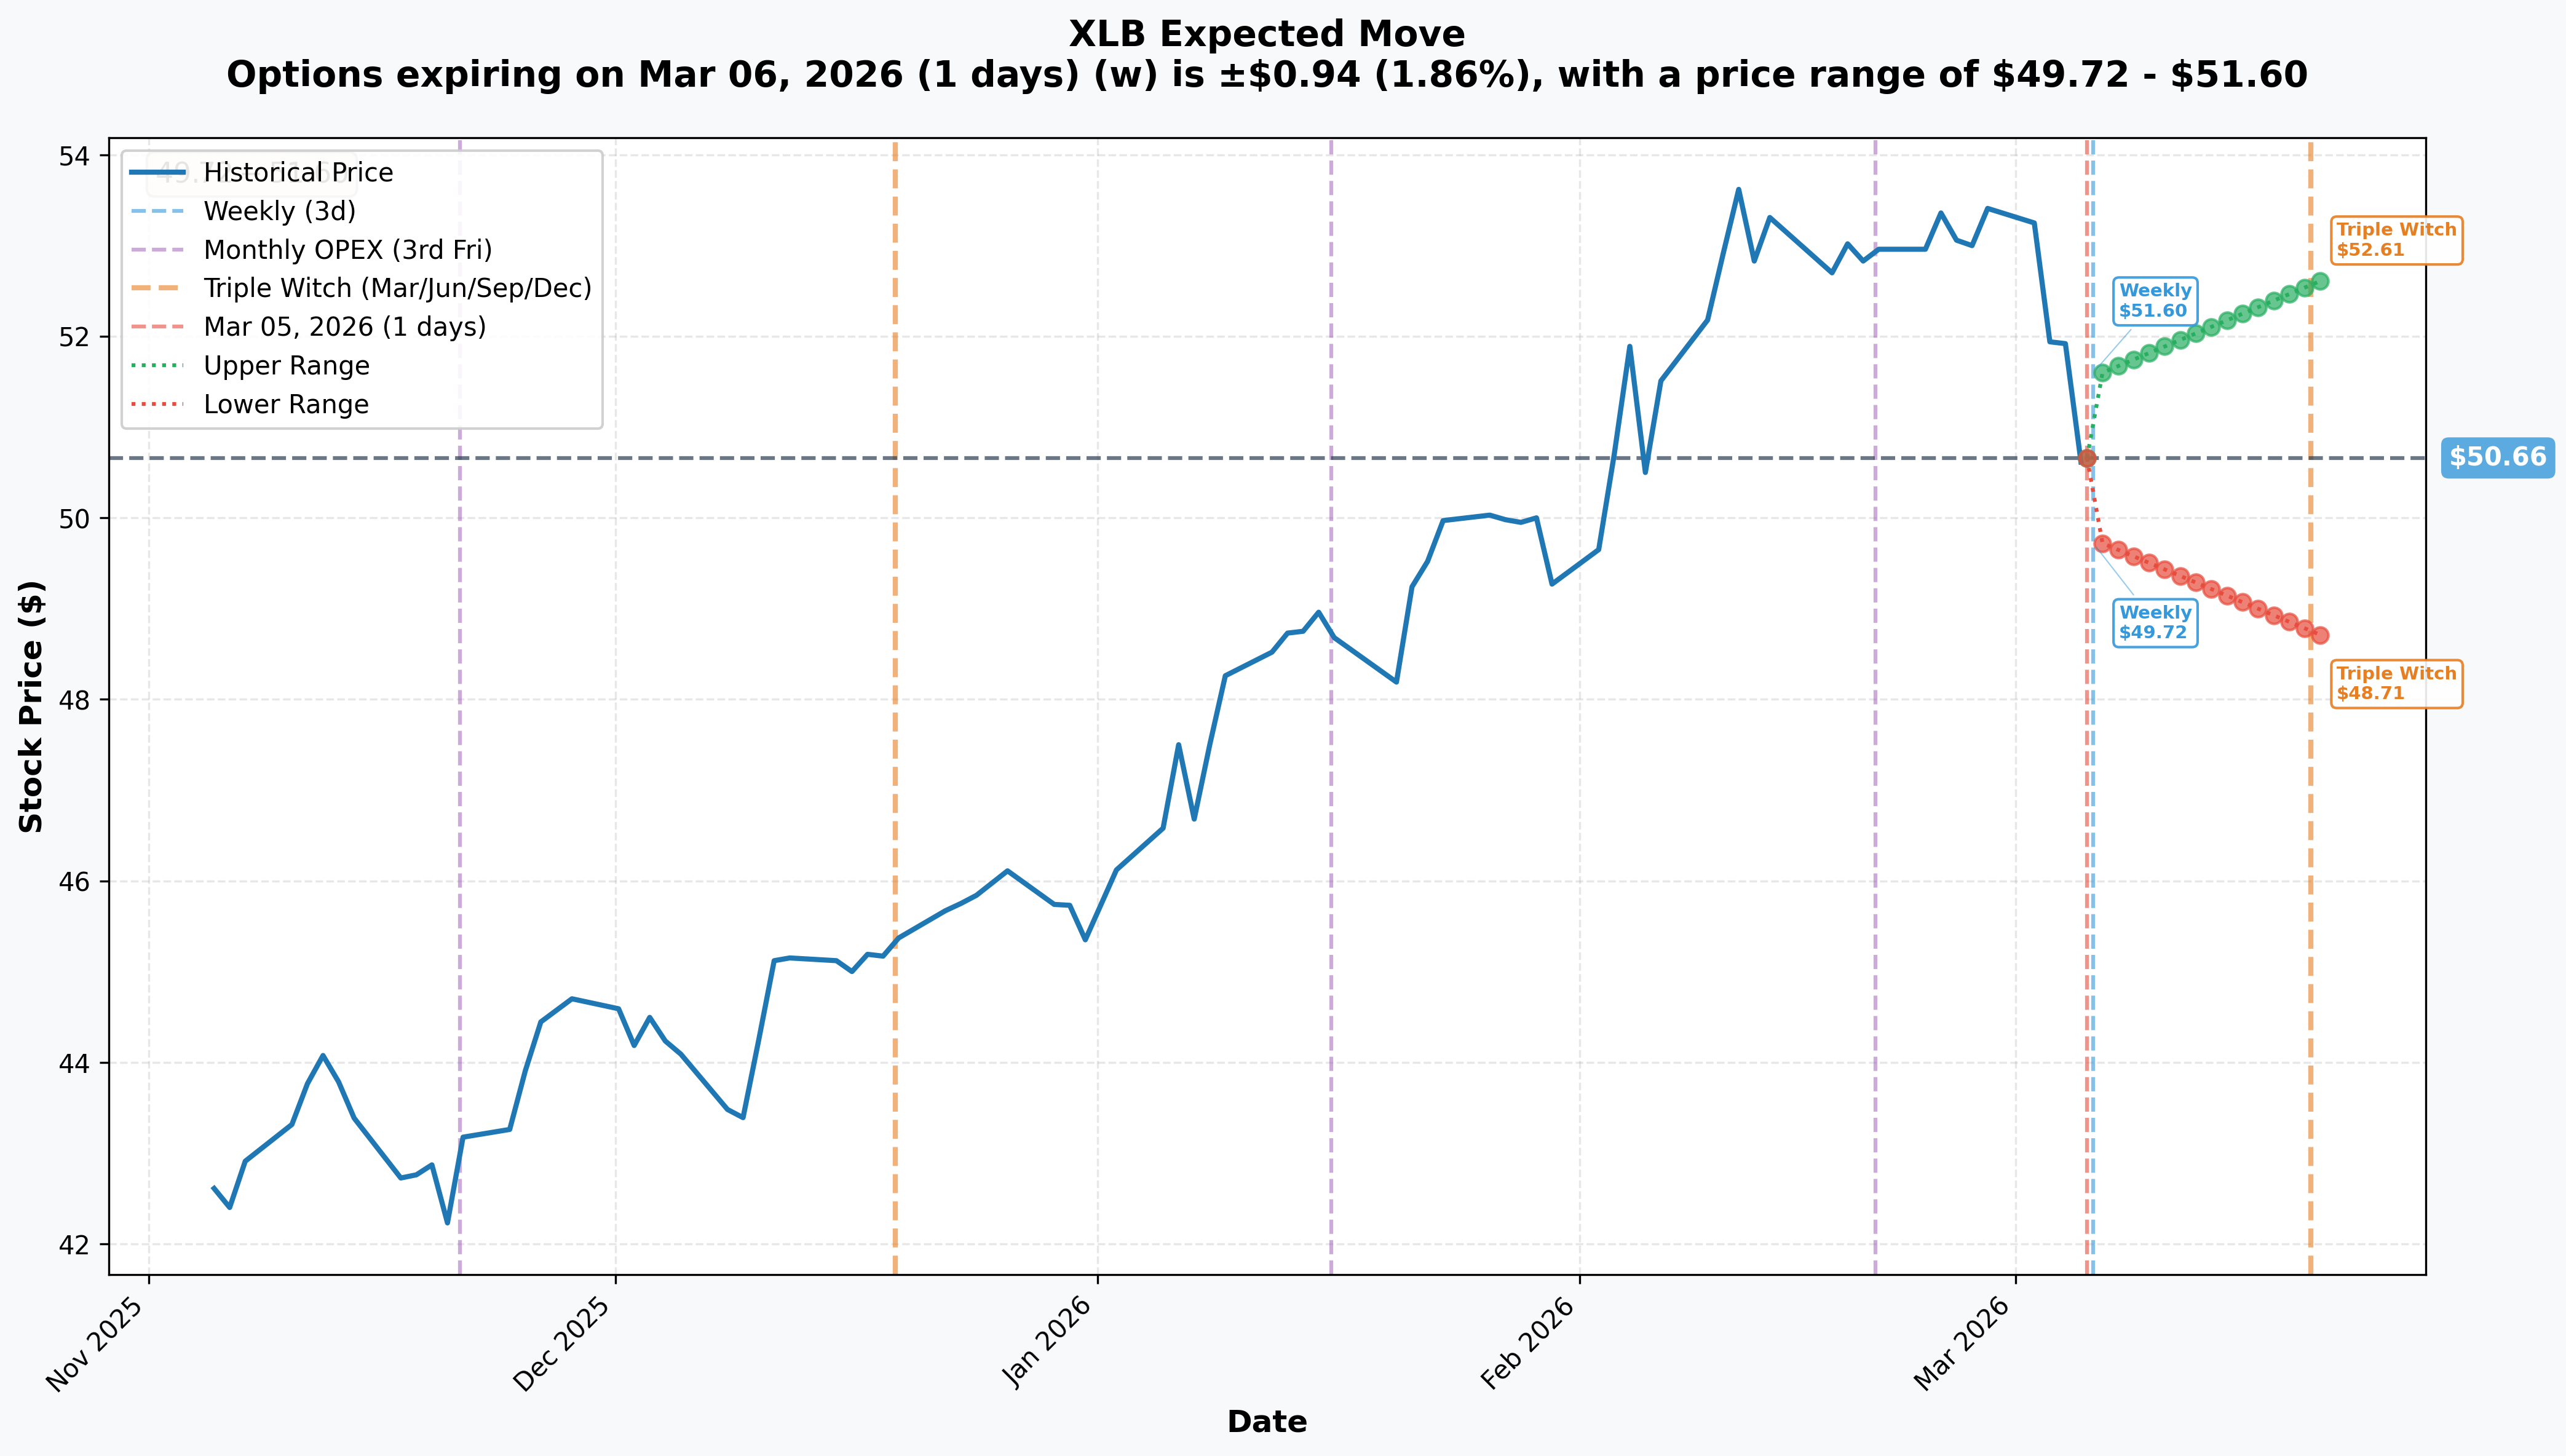
What the options market is pricing in for XLB moves:
📅 Weekly (expiring March 6): +/-$0.94 (1.86%) -- Range: $49.72 to $51.60 📅 Monthly OPEX / Triple Witch (March 20): +/-$1.95 (3.84%) -- Range: $48.71 to $52.61
The April 17 expiration (43 days out) would imply a wider range, roughly $47-$54 based on current IV levels around 15%. This is important -- the $50 put that was sold sits within the one-sigma move, meaning there's roughly a 68-84% probability XLB stays above $50 by expiration.
🏢 ETF Overview
XLB -- Materials Select Sector SPDR Fund is one of the original SPDR sector ETFs tracking the S&P 500 Materials sector. It trades on NYSE Arca and holds approximately 139 million shares outstanding.
Top 5 Holdings: 🔹 Linde (LIN) -- 14.1% -- Industrial gases giant 🔹 Newmont (NEM) -- 7.9% -- World's largest gold miner 🔹 Freeport-McMoRan (FCX) -- 5.7% -- Copper mining leader 🔹 Sherwin-Williams (SHW) -- 4.9% -- Paints and coatings 🔹 Ecolab (ECL) -- 4.6% -- Specialty chemicals
The ETF gives you broad exposure to chemicals (~35%), metals & mining (~17%), construction materials (~12.5%), and steel (~7.4%). It has been a top-performing sector YTD, riding record commodity prices.
🎪 Catalysts
✅ What Already Happened (Priced In)
🔵 Supreme Court IEEPA Tariff Ruling (February 20): The court struck down IEEPA-based tariffs in a 6-3 decision. The administration pivoted to Section 122 authority, imposing a 15% temporary import surcharge. This created uncertainty but is now mostly digested.
🔵 Section 232 Tariffs Intact: 50% tariffs on steel, aluminum, and semi-finished copper remain unaffected by the court ruling -- this protects domestic pricing for Nucor, Steel Dynamics, and Freeport.
🔵 Copper at Record Highs: LME copper hit $13,238/ton in January 2026, fueled by AI/data center demand (projected 475K tons in 2026) and supply deficits.
🔵 Gold Above $4,700: Gold near $4,734/oz with Newmont posting FY2025 net income of $7.2B.
🔵 Chemicals Spared from Tariffs: Large-volume chemical products are on the exemption list, which is bullish for ~35% of the ETF.
📅 What's Coming (Not Yet Priced In)
📌 March 26 -- Linde ex-dividend ($1.60/share) -- Minor but LIN is 14.1% of the ETF
📌 April (TBD) -- Fed FOMC Meeting -- A rate cut from the current 3.50-3.75% would be a significant catalyst for construction materials names (SHW, MLM, VMC = ~12.7% of XLB)
📌 April 23 -- FCX and NEM Q1 Earnings -- Freeport-McMoRan (5.7%) and Newmont (7.9%) report the same day. Combined 13.6% of the ETF reporting on the same day -- high-impact event.
📌 April 30 -- LIN Q1 Earnings -- Linde (14.1% of XLB) reports. The biggest single holding.
📌 May 15 -- New Fed Chair Kevin Warsh sworn in -- Has signaled more rate cuts
📌 June 30 -- Commerce Department copper market update -- Could determine phased duties on refined copper starting January 2027
📌 September 30 -- IIJA infrastructure authorization expires -- Massive catalyst for CRH, MLM, VMC, NUE. The pending highway bill is expected to be "significantly higher" than IIJA.
⚡ The key timing note: The April 17 expiration on these puts falls right before the biggest catalysts (FCX/NEM earnings April 23, LIN April 30). This trader deliberately chose an expiration that avoids earnings risk. Smart.
🎲 Price Targets & Probabilities
Using gamma levels, implied move data, and catalyst timing, here's how the scenarios shake out for XLB through the April 17 expiration:
🐂 Bull Case: $53-$54 (Probability: ~25%)
Target: $54.14 (52-week high retest)
What gets us here: Fed signals April rate cut, EU tariff easing on derivative steel/aluminum products materializes (Bloomberg reported it's expected "within weeks"), copper holds above $12,500, and risk appetite returns. Call gamma resistance at $52-$53 would need to be absorbed, but the underlying uptrend supports it. The implied move to Triple Witch gives an upper range of $52.61 -- a break above that opens the door to $54.
⚖️ Base Case: $50-$52 (Probability: ~55%)
Target: $51 (current range)
The most likely scenario. The massive $50 gamma wall from today's trade creates a strong floor, while call gamma at $52-$53 caps the upside. XLB chops between $50 and $52 as markets digest tariff uncertainty and wait for Q1 earnings. The trader who sold the $50 puts wins in this scenario, keeping the full ~$7M net credit. The weekly implied range ($49.72-$51.60) and monthly range ($48.71-$52.61) both support this consolidation thesis.
🐻 Bear Case: $47-$49 (Probability: ~20%)
Target: $48.71 (monthly implied move lower bound)
What gets us here: Tariff escalation (Section 122 surcharge raised further), copper reversal toward $10,000/ton, China slowdown data, or a failed infrastructure bill negotiation. The $50 support breaks, opening the door to the 50-day MA zone around $47-48. In this scenario, the $50 put seller faces losses, but their $45 put hedge kicks in below $45, limiting catastrophic downside. The $44 wing sale means max pain is around the $44-$45 zone.
💡 Trading Ideas
🛡️ Conservative: "The Income Collector" -- Sell the $48 Put (April 17)
The Trade: Sell XLB $48 Put, 2026-04-17 expiration Estimated Premium: ~$0.15-$0.25 per contract Why This Works: You're following the same directional thesis as the whale (XLB stays above support) but at a much safer strike. $48 is ~6% below the current price and below the 50-day MA. The Fed is leaning dovish, infrastructure spending is a floor, and the entire commodity complex supports materials. You collect premium with a very high probability of success. Max Risk: Assignment at $48 -- but you'd own a solid sector ETF near its 50-day MA Best For: Premium collectors who want to get paid while waiting for a dip to buy XLB
⚖️ Balanced: "The Materials Floor" -- Bull Put Spread ($49/$47)
The Trade: Sell XLB $49 Put / Buy XLB $47 Put, 2026-04-17 expiration
Estimated Net Credit: $0.25-$0.40 per contract
Max Profit: Net credit received (if XLB stays above $49)
Max Risk: $2.00 minus credit received ($1.60-$1.75 per contract)
Why This Works: This mirrors the whale's confidence that XLB holds above key support, but with defined risk. The $49 strike is below the massive gamma wall at $50 and below the monthly implied move lower bound ($48.71). You'd need XLB to drop >4% in 43 days to be at risk. The $47 long put provides a hard floor.
Best For: Swing traders who like the risk/reward of selling premium below heavy support
🚀 Aggressive: "The Whale Shadow" -- Short $50/$45 Put Spread
The Trade: Sell XLB $50 Put / Buy XLB $45 Put, 2026-04-17 expiration
Estimated Net Credit: $0.80-$0.95 per contract
Max Profit: Net credit received (if XLB stays above $50)
Max Risk: $5.00 minus credit received ($4.05-$4.20 per contract)
Why This Works: This is essentially the core of what the whale did today. You're selling the near-ATM $50 put (where the massive gamma wall now sits) and buying the $45 put as insurance. You need XLB to hold $50 -- which is the 50-day MA zone and a round-number psychological level. The risk is real (XLB is only $1.13 above $50), but 43 days of theta decay works in your favor, and the commodity tailwinds support the materials sector.
Best For: Aggressive premium sellers who trust the gamma wall and want to mirror institutional flow
⚠️ Risk Factors
❗ Tariff Escalation Risk: The Section 122 surcharge (currently 15%) could be raised further. Any escalation in trade tensions would hammer materials stocks across the board. The EU tariff easing expectations could also fail to materialize.
❗ Steel Tariff Rollback: If the administration reduces Section 232 steel/aluminum tariffs, Nucor and Steel Dynamics (7.4% combined) could see sharp declines. NUE already dropped 4% on rollback rumors in February.
❗ Copper Mean-Reversion: Copper's rally to $13,000/ton has been called "unsustainable". A reversion toward $10,000 would crush FCX (5.7% of XLB).
❗ China Demand Slowdown: Subdued Chinese economic activity continues to weigh on global commodity demand. The World Bank projects commodity prices to fall 7% in 2026 to six-year lows -- metals being the notable exception.
❗ Position Size Mismatch: The volume on the $44P (72K) doesn't perfectly match the $45P (62K) or $50P (60K). This could mean partial position management or multiple overlapping strategies executing simultaneously. The $45P "Close Long Put" classification adds ambiguity.
❗ Newmont Production Trough: NEM's 2026 is a trough production year (5.3M oz vs. 5.9M in 2025) with rising all-in sustaining costs, partially offsetting the gold price tailwind for XLB's second-largest holding.
🎯 The Bottom Line
Here's the deal: A whale just laid out an $11.5M put structure on XLB that screams: "I think materials stay above $50 for the next 43 days." The anchor $50 put sale -- 60,000 contracts with a Z-score of 5,804 -- is the kind of trade that shows up a few times a year across the entire options market. The Vol/OI ratio of 1,429x on the $50 put and 18,000x on the $44 put tells you these are brand-new positions, not rollovers.
The thesis makes sense. Copper at record highs, gold above $4,700, infrastructure spending providing a floor, chemicals spared from tariffs, and a Fed leaning toward cuts -- the macro setup supports materials holding these levels. The trader also smartly chose an April 17 expiration that dodges Q1 earnings from the top holdings (FCX/NEM report April 23, LIN reports April 30).
Your action plan:
✅ If you're bullish on materials: The aggressive bull put spread ($50/$45) mirrors the whale's core position. You collect premium and benefit from the gamma wall at $50.
✅ If you're cautious but interested: The balanced put spread ($49/$47) gives you a wider margin of safety below the $50 support level with defined risk.
✅ If you're just watching: Mark your calendar for April 23 (FCX + NEM earnings) and the April FOMC meeting. These are the catalysts that could move XLB out of the $50-$52 range. Any pullback toward $49-$50 with these catalysts intact could be a buying opportunity.
📅 Key dates to watch: April FOMC (rate cut?), April 23 (FCX/NEM earnings), April 30 (LIN earnings), June 30 (copper tariff decision)
The materials sector is at an inflection point -- record commodity prices vs. tariff uncertainty. This whale is betting the floor holds. Whether you follow them is your call, but $11.5M buys a lot of conviction. 💪
⚠️ Disclaimer: This analysis is for educational and informational purposes only and should not be considered financial advice. Options trading involves substantial risk of loss and is not suitable for all investors. Always do your own research and consider your risk tolerance before making any trading decisions. Past unusual options activity is not indicative of future price movement.