🐻 XLB — $21M Put Ladder Bets Materials Sector Breaks Down!
📅 March 13, 2026 | 🔥 Unusual Activity Detected
🎯 The Quick Take
Someone just loaded up $21 MILLION worth of XLB puts this morning — all four strikes, all the same April 17 expiration, all bought simultaneously at 10:09:08. This isn't a casual hedge. It's a precision-built put ladder from a trader who thinks the materials sector is about to get crushed. With XLB sitting at $49.67 and the $50 strike barely out-of-the-money, the message is unmistakably bearish: tariffs, China weakness, and commodity mean-reversion risk could send this ETF down 10–15% before April options expire.
📊 ETF Overview
XLB — Materials Select Sector SPDR ETF tracks the Materials Select Sector Index, giving investors exposure to 29 S&P 500 materials companies spanning chemicals, metals & mining, paper & forest products, and containers & packaging.
- Total Assets: ~$6.79B
- Expense Ratio: 0.09%
- P/E Ratio: 27.39
- 52-Week Range: $36.56 – $54.14
- Current Price: $49.67 (near cycle highs — up ~21% in the prior quarter)
- SIC Category: Materials / Diversified Sector ETF
Top Holdings driving this trade's thesis:
| Holding | Weight | Why It Matters |
|---|---|---|
| Linde (LIN) | 14.05% | Industrial gases for semis & clean energy — premium valuation exposed to macro slowdown |
| Newmont (NEM) | 8.20% | Pure gold proxy — mean-reversion risk if gold retreats from all-time highs |
| Freeport-McMoRan (FCX) | 5.66% | Copper king — directly exposed to China construction and manufacturing demand |
| Sherwin-Williams (SHW) | 4.81% | Coatings & chemicals — housing and construction activity read |
| Corteva (CTVA) | 4.67% | Agricultural chemicals — tied to commodity prices and global planting season |
XLB is highly concentrated — just 29 holdings. Linde + Newmont alone represent 22% of the fund. A pullback in gold or a slowdown in Linde's semiconductor gas orders could meaningfully move the whole ETF.
💰 The Option Flow Breakdown
📊 The Tape (March 13, 2026 @ 10:09:08)
| Time | Symbol | Side | Buy/Sell | Type | Expiration | Strike | Volume | OI | Size | Spot |
|---|---|---|---|---|---|---|---|---|---|---|
| 10:09:08 | XLB | MID | BUY | PUT $50 | 2026-04-17 | $50 | 48K | ~40K | 47,760 | $49.67 |
| 10:09:08 | XLB | MID | BUY | PUT $48 | 2026-04-17 | $48 | 60K | ~30K | 60,000 | $49.67 |
| 10:09:08 | XLB | MID | BUY | PUT $44 | 2026-04-17 | $44 | 62K | ~20K | 61,560 | $49.67 |
| 10:09:08 | XLB | MID | BUY | PUT $42 | 2026-04-17 | $42 | 72K | 0 | 72,000 | $49.67 |
Total estimated premium: ~$21M | Strategy: Put Ladder (BTO) — 4 simultaneous legs, same expiration
🤓 What This Actually Means
Four puts, four different strikes, all triggered at the EXACT same timestamp. That's not random — that's a single institutional order executed as a coordinated ladder. Here's why this structure is so interesting:
- 💰 The $50 strike is nearly at-the-money (just $0.33 above spot) — this leg starts printing money almost immediately on any decline
- 📉 The $48 strike (60K contracts!) is the largest leg by size — targeting a 3.4% drop that gamma data confirms as the first real support wall
- 📊 The $44 strike aligns perfectly with a major gamma support zone at $44 where 14.2B in total gamma exposure sits
- 🆕 The $42 strike has ZERO prior open interest — this is a brand new contract. Nobody had ever traded this strike before today. The buyer is literally creating it from scratch, which tells you they're not hedging an existing position. This is pure directional conviction.
Real talk: A put ladder isn't just "buying puts." Each strike creates a different payoff zone — as XLB falls through each level, the position's profit potential grows in layers. Think of it like a waterfall: every floor XLB breaks through pours more profits into the next pool below.
Why bearish on materials RIGHT NOW?
- 🏭 Tariff risk on steel and aluminum — renewed U.S. trade policy uncertainty is raising input costs and disrupting global supply chains for metals and industrial materials
- ⚡ Iran driving energy cost inflation — elevated geopolitical tensions are pushing energy prices higher, which squeezes chemical producers (Sherwin-Williams, Corteva, specialty chemicals) who use energy-intensive manufacturing processes
- 🇨🇳 China demand uncertainty — Beijing's rare earth export controls (effective March 3, 2026) plus property sector stress are weighing on copper demand; Freeport-McMoRan (5.66% of XLB) is directly in the crosshairs
- 📈 XLB just ran 21% in one quarter — the put buyer may simply be fading an overextended move; the 52-week high is $54.14 and analyst targets cluster around $56.67, but short-term the risk/reward has shifted
Unusual Score: 🔥 EXTREME — 4 simultaneous legs with combined 241K+ contracts across a 35-day window. The $42 strike opened with zero existing interest, meaning this isn't institutional rolling or hedging of known positions. This is fresh directional exposure of the highest order.
📈 Technical Setup / Chart Check-Up
YTD Performance Chart
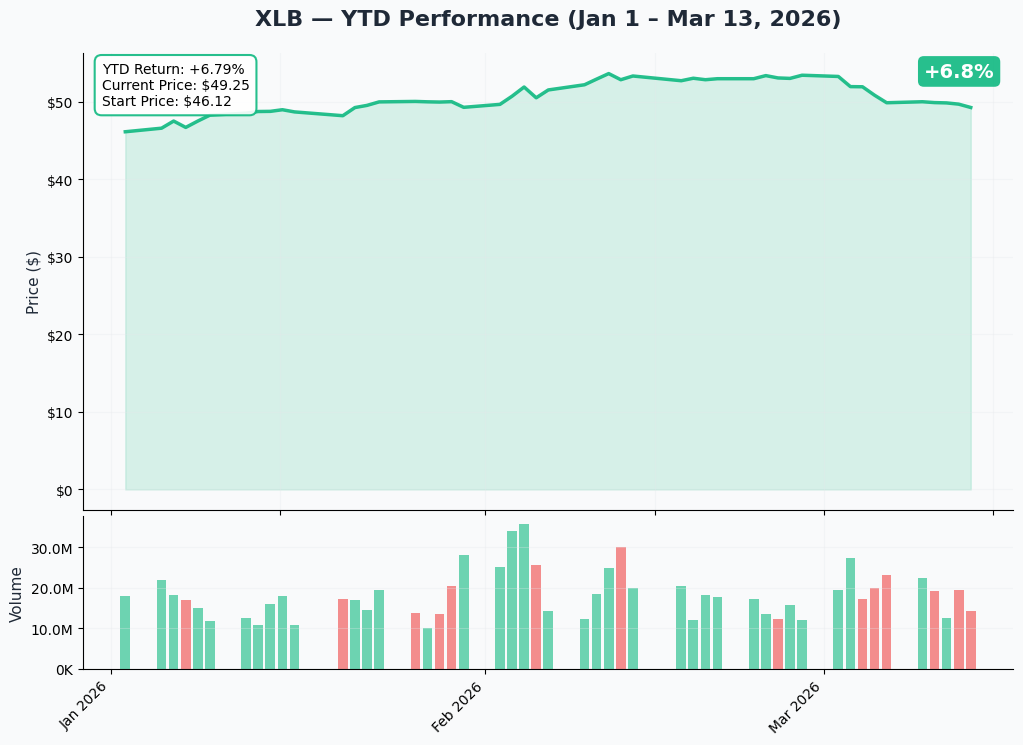
XLB has been on a tear — up ~21% in the prior quarter, riding gold, copper, and industrial gas strength. But the chart shows the ETF is now grinding near $49.67, just 8% below its 52-week high of $54.14. That's a lot of recent gains sitting on a fragile foundation:
- 🚀 Big Q4/Q1 run: Commodity bull thesis played out beautifully — copper, gold, and industrial gases all surged on China reopening optimism and green infrastructure demand
- ⚠️ Now stalling near cycle highs: The momentum that fueled the run is fading; China PMI uncertainty and tariff headwinds are creating overhead resistance
- 📊 Volume divergence: Volume on up-days has been declining while volume on risk-off days has been increasing — classic distribution pattern
- 🎢 Vulnerable to a "good news is priced in" unwind: Materials stocks discount future demand; if demand data disappoints, the sector can re-price quickly
🔵 Gamma-Based Support & Resistance
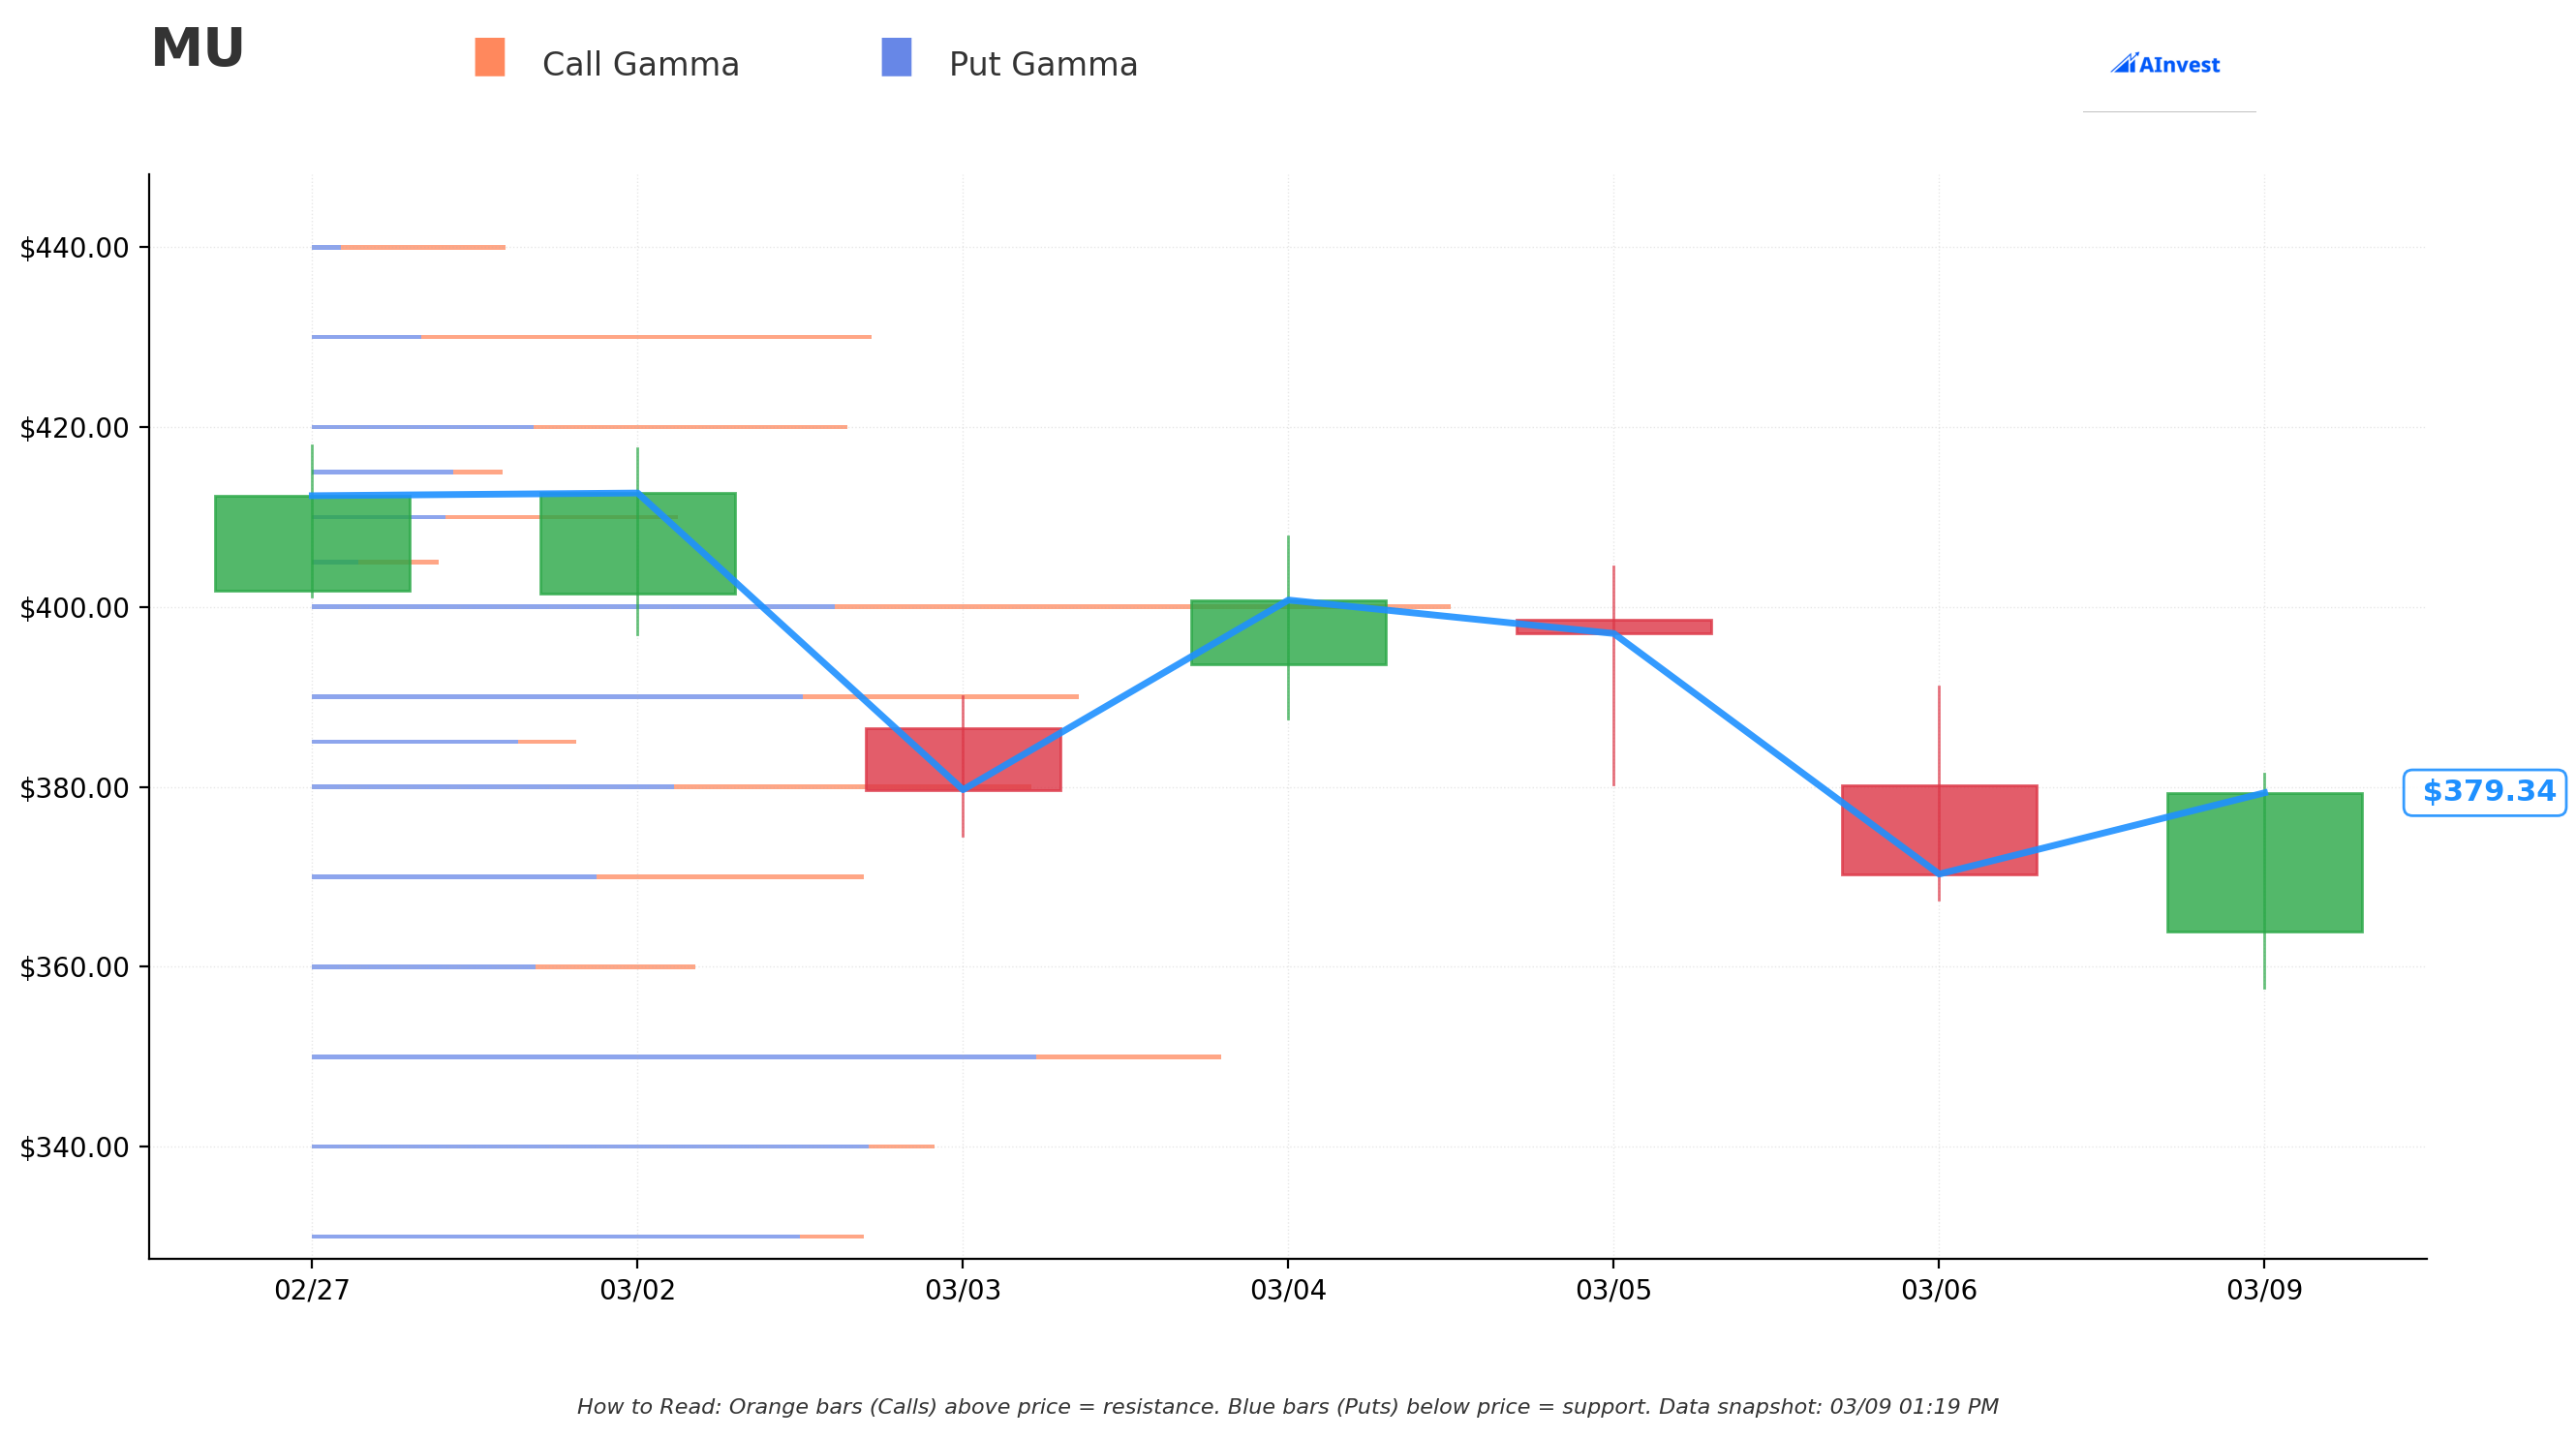
Current Price: $49.67
The gamma exposure map shows a massively lopsided setup: 188B in put gamma vs. just 73B in call gamma — the net GEX bias is officially Bearish. Market makers are hedging enormous put exposure below the current price, which creates mechanical selling pressure as XLB moves lower.
🔵 Support Levels (Put Gamma — floors where dealers buy):
| Strike | Total GEX | Distance from Spot | What This Means |
|---|---|---|---|
| $48.50 | 11.1B | -2.4% | First line of defense — dealers support here |
| $46.00 | 24.2B | -7.4% | Major support — strong put gamma wall |
| $45.00 | 23.7B | -9.2% | Secondary support zone — nearly as strong as $46 |
| $44.00 | 14.2B | -11.5% | Deep support — aligns with put ladder's $44 strike! |
| $41.00 | 5.9B | -17.5% | Disaster floor |
🟠 Resistance Levels (Call Gamma — ceilings where dealers sell):
| Strike | Total GEX | Distance from Spot | What This Means |
|---|---|---|---|
| $49.50 | 9.5B | +0.1% | Immediate overhead ceiling — barely above spot |
| $50.00 | 81.2B | +0.7% | THE WALL — single largest gamma level, dominant resistance |
| $51.00 | 5.6B | +2.7% | Minor ceiling |
| $52.00 | 18.7B | +4.7% | Next significant hurdle |
| $55.00 | 23.5B | +11.2% | Extended bull target |
What this means for traders:
The $50 strike is the most important level on the entire options map — 81.2B in total gamma exposure, with 74.4B of that being put gamma. Market makers with this much $50 exposure will systematically sell XLB rallies above $50 to stay delta-neutral. The ceiling is RIGHT HERE. And the put buyer? They struck one of their four legs at exactly $50 — the heaviest gamma level on the board. That's not a coincidence.
The net GEX bias being Bearish is significant — it means dealer hedging flows will AMPLIFY downward moves rather than absorb them. When the market is in negative gamma territory, small moves can become large moves fast.
📐 Implied Move Analysis
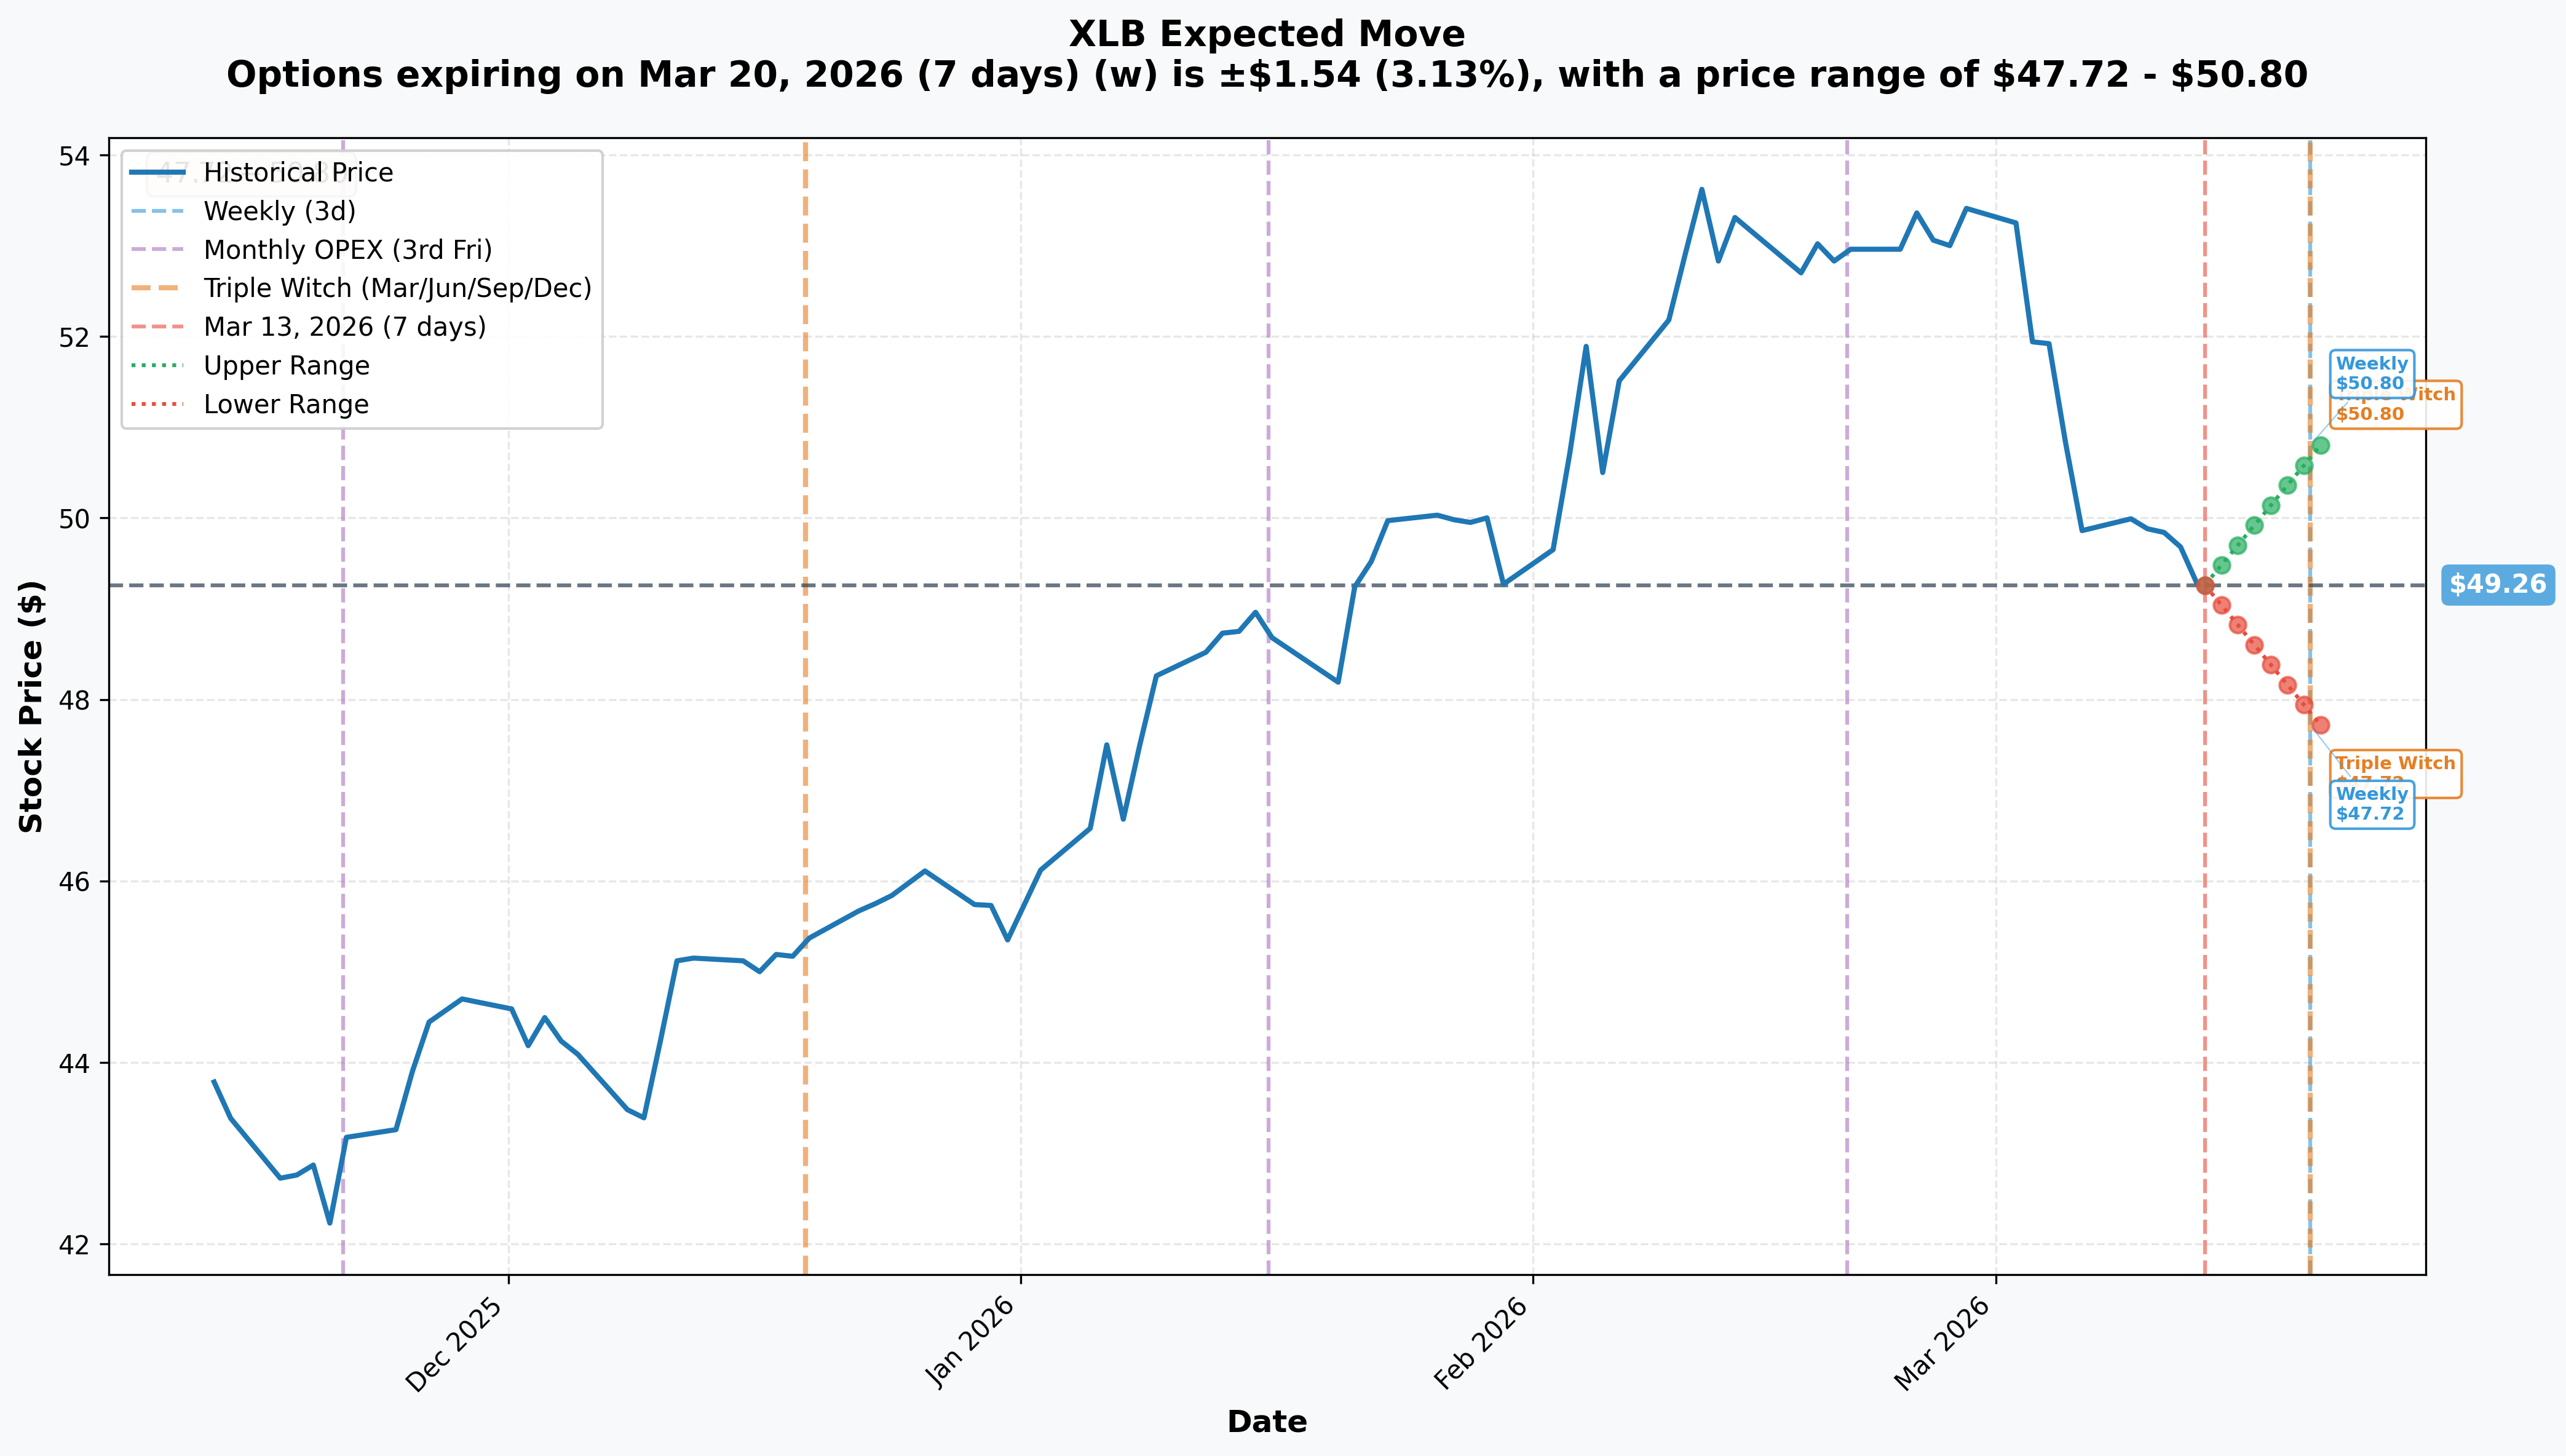
Options market pricing for upcoming expirations:
| Timeframe | Expiry | Days Out | Implied Move | Upper Range | Lower Range |
|---|---|---|---|---|---|
| 📅 Weekly / OPEX | 2026-03-20 | 7 days | ±3.13% ($1.54) | $50.80 | $47.72 |
| 📅 Triple Witch | 2026-03-20 | 7 days | ±3.13% ($1.54) | $50.80 | $47.72 |
Translation for regular folks:
The options market is pricing a ±$1.54 move (3.1%) by March 20th — the weekly OPEX which also happens to be Triple Witch. That puts the expected range at $47.72 to $50.80 over the next 7 days. Notice something? The upper range ($50.80) is barely above the massive $50 gamma wall. The market itself is telling you that a sustained break above $50 is unlikely near-term.
For the April 17 expiration where all four puts sit, the actual implied move will be larger — roughly ±5–7% based on the IV term structure. That puts the April lower range around $46–$47, squarely within the put ladder's profit zone.
Key insight: The put buyer structured their April 17 ladder with the lower strikes ($44, $42) well below where current implied moves suggest. They're betting on a move that EXCEEDS the market's current pricing — either a catalyst-driven selloff or a slow bleed that accelerates as support levels break.
🎪 Catalysts
🔥 Upcoming Catalysts (Next 5 Weeks: March 13 – April 17, 2026)
China Caixin Manufacturing PMI — ~April 1, 2026 📊
This is THE most important data point for the put ladder. A reading below 50 (contraction) would validate the bearish thesis immediately — copper demand concerns would drag Freeport-McMoRan lower, pulling XLB below the $48 gamma support. China property sector stress in early 2026 makes a weak PMI print a realistic scenario.
U.S. CPI and Fed Policy (Mid-March through April)
If U.S. inflation re-accelerates and the Fed signals delayed rate cuts or additional tightening, risk assets — especially commodity-linked materials stocks — would face double pressure: slower growth + higher discount rates. Any hawkish Fed surprise between now and April 17 could be the catalyst that unlocks the $48/$46 support breaks.
Q1 2026 Earnings Pre-Announcements (Mid-April, around expiration)
Several major XLB components report Q1 results RIGHT around the April 17 expiration date:
- 🏭 Linde (14% of XLB): Semiconductor gas demand and pricing commentary
- 🏠 Sherwin-Williams (4.8%): Housing and construction activity signal
- 🌾 Corteva (4.7%): Agricultural input demand and planting season outlook
Any negative pre-announcement from these names in the weeks leading up to expiration would directly pressure XLB and potentially trigger the put ladder's deeper payoffs.
Copper Price Trajectory
Copper near historically elevated levels but facing demand headwinds from China's property sector. A 10–15% copper pullback would disproportionately hurt Freeport-McMoRan and could be the single largest mover for XLB in this 35-day window.
Dollar Strength Risk
Fed policy divergence or global flight to safety driving dollar strength is structurally bearish for ALL commodities — gold (Newmont), copper (Freeport), agricultural inputs (Corteva) all trade inversely to the dollar. If DXY breaks higher, it hits multiple XLB holdings simultaneously.
✅ Past Catalysts (Already Happened)
XLB 21% Q4/Q1 Run (through March 2026)
XLB outperformed all sector SPDRs in the prior quarter on commodity price strength. StockInvest notes XLB is now just 8% below its 52-week high of $54.14. The put buyer may be fading this entire move — a classic "fade the breakout" strategy after a massive run.
Beijing Rare Earth Export Controls — March 3, 2026
China tightened rare earth export controls effective March 3, creating both supply chain disruption risk for chemical manufacturers and additional trade policy uncertainty for the entire materials sector. This macro overhang is already baked in, but further escalation remains a risk.
Green Infrastructure Spending (Bull Risk)
Any new U.S. or EU hydrogen/grid/EV announcement would be bullish for Linde (hydrogen), Freeport (copper), and specialty chemical makers. This is the primary risk that could invalidate the bearish put trade — watch for any policy announcements out of Washington.
🎲 Price Targets & Probabilities
Using gamma levels, implied move data, and upcoming catalysts, here are the scenarios through April 17 expiration:
📈 Bull Case (20% probability)
Target: $51–$55 (puts expire worthless)
How we get there:
- ✅ China PMI surprises to the upside (manufacturing re-accelerates)
- ✅ Copper holds elevated levels on EV/grid infrastructure demand
- ✅ Linde delivers strong semiconductor gas guidance
- 📈 Break above $50 gamma wall triggers short-covering rally
- 🌐 New green infrastructure spending announcement sparks commodity run
The put trade loses everything. At $50+ expiration, all four puts likely expire worthless — total loss of ~$21M in premium. This is the scenario that makes the put buyer's insurance unnecessary but keeps XLB holders sleeping well.
Why only 20%: The $50 gamma ceiling is massive (81.2B), the GEX bias is bearish, and multiple negative catalysts are queued up. A sustained break above $50 requires a reversal of macro headwinds that are currently building.
🎯 Base Case (50% probability)
Target: $45–$48 (moderate put profits)
Most likely scenario:
- 📉 XLB drifts lower as commodity enthusiasm fades post the 21% run
- 🇨🇳 China data is mixed — not catastrophic, but not recovery-confirming either
- ⚖️ Fed holds rates steady but tone is hawkish, pressuring commodity-related stocks
- 🔵 XLB breaks $48.50 gamma support and tests the $46–$48 zone
- 📊 The $50 and $48 puts print meaningful profits; lower strikes ($44/$42) provide optionality
At $46 expiration:
- The $50 put is $4 in-the-money — significant value
- The $48 put is $2 in-the-money
- The $44 and $42 puts expire worthless or near-worthless
Why 50%: This is the scenario the gamma map supports — XLB trending toward the major support cluster at $45–$46 where 24–47B in total put gamma creates a natural floor. Materials sector facing real headwinds, but a 15%+ collapse is not the base case.
📉 Bear Case (30% probability)
Target: $42–$44 (full ladder activates!)
What triggers the cascade:
- 😰 China March PMI comes in below 48 — manufacturing contraction signal
- 🏭 Copper breaks 10–12% on China demand fears — Freeport tanks
- 💵 Dollar surges on Fed hawkishness — simultaneous bearish pressure on gold + copper + agri
- 🚨 Tariff escalation on steel/aluminum announced — direct materials sector headwind
- 📉 XLB breaks $48, accelerates through $46, tests $44 gamma support
At $43 expiration (full ladder payoff):
- The $50 put is $7 in-the-money
- The $48 put is $5 in-the-money
- The $44 put is $1 in-the-money
- The $42 put approaches worthless but provides optionality for deeper catastrophic scenario
Why 30%: The bearish gamma bias, China macro uncertainty, tariff risks, and the 21% prior run creating mean-reversion pressure make this an uncomfortably plausible scenario. The $42 put's existence with ZERO prior OI suggests the buyer has conviction about a left-tail outcome that the market isn't fully pricing.
💡 Trading Ideas
🛡️ Conservative: Follow the Whale, Smaller Size
The "Sleep Well" Strategy — Just Mirror the Trade, Baby-Sized
Play: Buy 1–2 contracts of the XLB April 17 $50 Put for near-term bearish protection
Why this works:
- 🎯 You're copying the exact same strike the institution used — the one that starts printing money almost immediately on a decline
- 🔵 The $50 gamma wall means this put gains value the moment XLB fails to break out
- ⏰ 35 days to expiration gives plenty of time for China PMI and macro catalysts to play out
- 💰 Defined risk — maximum loss is just the premium paid
- 📊 The $50 strike is essentially at-the-money — high delta, responds quickly to price moves
Cost estimate: ~$2–3 per contract (highly dependent on current IV) = $200–$300 max risk per contract
Target exit: Close at 50–100% profit if XLB drops to $47–$48
Risk level: Low (defined risk, single leg) | Skill level: Beginner-friendly
⚖️ Balanced: Put Spread — The "Tariff Insurance" Trade
Play: Buy the $50/$46 put spread (April 17 expiration)
Structure: Buy XLB $50 Put / Sell $46 Put (same expiration)
Why this works:
- 💸 Selling the $46 put reduces your cost significantly — premiums are elevated right now
- 📊 The $46 strike aligns with the 24.2B gamma support floor — natural target for base case
- 🎯 Max profit if XLB at or below $46 at expiration: captures the full $4 spread width
- ⚖️ Defined risk on both sides — maximum loss is your net debit, maximum gain is $4 minus net debit
Estimated P&L:
- 💰 Net debit: ~$1.50–2.00 per spread
- 📈 Max profit: ~$2.00–2.50 (if XLB at or below $46 at April 17 expiration)
- 📉 Max loss: $1.50–2.00 (if XLB stays above $50)
- 🎯 Breakeven: ~$48.00–$48.50
- Risk/Reward: approximately 1:1.25 — favorable for a bearish play with confirmed institutional conviction
Position sizing: Risk 2–4% of portfolio maximum on this directional trade
Risk level: Moderate (defined risk, bearish directional) | Skill level: Intermediate
🚀 Aggressive: Ladder Copy — 3-Strike Fan for Maximum Payoff
Play: Scale into 3 of the 4 institutional strikes — $50/$48/$44 puts (skip $42 unless you want deep OTM lottery)
Why this could work:
- 💥 You're replicating the institutional structure — the most informed money on the Street set this up for a reason
- 🎰 Each strike adds a new payoff layer: $50/$48 provide near-term gains, $44 provides leveraged payoff if China data collapses
- 📉 Maximum leverage if XLB breaks 11% — the $44 puts go from nearly worthless to highly profitable very quickly
- 🔥 The $42 put being brand-new (0 OI) suggests the buyer sees tail risk the market isn't pricing — consider adding one $42 contract as a "lottery ticket"
- 📊 With 3–4 open strikes working together, you capture profits at multiple levels of a selloff
Estimated cost: 3-strike ladder could cost $4–6 net per "unit" depending on spread construction
Breakeven scenarios:
- 📈 $50 puts profitable if XLB below $50 by ~$2–3 premium
- 📉 $48 puts profitable if XLB breaks to $46.50 or below
- 💥 $44 puts become home-run territory if XLB tests $42–$43 on China shock
CRITICAL WARNING — Only attempt this if you:
- ✅ Understand multi-leg option management (each leg needs to be monitored separately)
- ✅ Can afford to lose entire premium on all legs (all puts expire worthless in bull case)
- ✅ Have a clear exit plan — especially on the $44 and $42 strikes with lower probability
- ✅ Understand that buying multiple puts MULTIPLIES theta decay — time is NOT your friend
Risk level: High (multiple legs, full premium at risk) | Skill level: Advanced only
⚠️ Risk Factors
Here's what could blow up this trade:
-
🟢 China stimulus surprise: Beijing has repeatedly stepped in with policy support when growth slows. Any infrastructure spending announcement, property sector bailout, or credit easing would send copper and materials stocks sharply higher, invalidating the entire bearish thesis. A China stimulus bazooka response to weak PMI data could send XLB back toward $52–$54 quickly.
-
💵 Dollar weakness instead of strength: If the Fed signals cuts earlier than expected or the dollar weakens on global risk-on sentiment, commodities could surge. Gold at new highs, copper rebounding — Newmont and Freeport both rally, pulling XLB higher and making the $50 put worthless.
-
🏭 Green infrastructure spending wave: Any bipartisan infrastructure deal, EU hydrogen investments, or major EV battery supply chain announcement would be directly bullish for Linde (hydrogen gases), Freeport (copper wire), and specialty chemicals. This is the structural bull case for XLB that the analyst community ($56.67 12-month target) is counting on.
-
⏰ Time decay is brutal on all four legs: With 35 days to expiration, theta is eating at every single one of these puts simultaneously. If XLB just sits at $49–$50 doing nothing for two weeks, significant premium decay occurs. The put buyer needs the CATALYST to arrive before time kills the position.
-
📊 The $50 gamma wall could create a floor: That 81.2B total gamma at $50 is the largest single level on the board. Paradoxically, this much put gamma can actually CREATE support — as XLB approaches $50 from above, dealer delta hedging activity can generate buying pressure. The put ladder needs XLB to decisively break through this level.
-
🎯 Analyst community is actually bullish: TipRanks consensus shows a "Moderate Buy" rating with a $56.67 12-month target — that's 14% upside from here. If sell-side catalysts play out (Linde semiconductor demand, green energy spending), this is a contrarian bet going against the crowd.
-
🆕 $42 strike's zero OI is a double-edged sword: A brand-new contract with no open interest can have wide bid-ask spreads and thin liquidity. If the position needs to be exited quickly at the $42 strike, slippage could be painful. The institutional buyer can stomach this; retail traders following should be aware of liquidity risk at extreme strikes.
🎯 The Bottom Line
Here's the deal: A single institutional player just spent $21 million building a precisely engineered put ladder on XLB — four strikes, four simultaneous fills, zero slippage at the worst possible time slot (mid-morning, full liquidity). The $42 strike existing with zero prior open interest is the most telling detail: this isn't hedging. This isn't rolling an existing position. This is fresh directional conviction about where materials are going in the next 35 days.
What this trade is telling us:
- 🎯 The $50 gamma wall is a ceiling, not a launchpad — the biggest gamma level on the board sits right at the current price, making a sustained breakout extremely difficult
- 💰 The materials sector just ran 21% in one quarter — the put buyer is betting on mean reversion after an overextended move
- 🏭 Tariffs on steel/aluminum + Iran-driven energy cost inflation are squeezing materials sector margins from both sides
- 🇨🇳 China uncertainty (property sector, rare earth export controls, PMI trajectory) removes the bull catalyst that drove the Q4/Q1 rally
- 🆕 The zero-OI $42 strike is a message: the buyer sees tail-risk scenarios the market hasn't priced
If you own XLB or materials ETFs:
- ✅ Consider trimming 20–30% of your position at current levels ($49–$50) — the risk/reward has shifted
- 📊 Watch the $48.50 gamma support level closely — a close below that level shifts the momentum bearish
- ⏰ Mark your calendar: China PMI (~April 1) is the key binary event before April 17 expiration
- 🛡️ If holding a significant position, a single April $50 put per 100 shares provides low-cost protection
If you're watching from the sidelines:
- 👀 The GEX data screams "bearish bias" — total put gamma (188B) is 2.6x the call gamma (73B)
- 🎯 A break below $48.50 and then $48 is the trigger — that's when this trade starts working in earnest
- 📅 April 1 China PMI + mid-April earnings pre-announcements are the catalysts to watch
Key dates to mark:
- 📅 March 20, 2026 — March OPEX / Triple Witch (7 days away, ±3.1% implied move)
- 📅 ~April 1, 2026 — China Caixin March Manufacturing PMI release
- 📅 Mid-April 2026 — Q1 earnings season starts; Linde, Sherwin-Williams, Corteva pre-announces
- 📅 April 17, 2026 — ALL FOUR puts expire; full resolution of the $21M bet
Final verdict: The materials sector is sitting at a crossroads. The 21% run is impressive, but tariffs, China uncertainty, dollar risk, and a bearish GEX structure are all pointing the same direction as this $21M put ladder. The $50 gamma wall is the line in the sand — if XLB can't break above $50 cleanly in the next few days, gravity takes over. The put ladder was built by someone who knows exactly what they're doing.
Don't chase the trade blindly — but do pay attention. When $21 million lines up with the gamma map this precisely, the market usually delivers a verdict. 📉
Disclaimer: Options trading involves substantial risk of loss and is not suitable for all investors. This analysis is for educational and informational purposes only and does not constitute financial advice, a recommendation to buy or sell any security, or an offer to provide investment advisory services. The unusual options activity described reflects large-scale institutional positioning that may involve hedging strategies, portfolio management needs, or views not applicable to individual retail traders. Past performance and unusual activity patterns do not guarantee future results. The $42 strike's zero prior open interest reflects a new contract opening — it does not imply the trade will be profitable. Always conduct your own due diligence, understand your risk tolerance, and consider consulting a licensed financial advisor before making any trading decisions. Options can expire worthless, and you can lose 100% of the premium paid.
About XLB — Materials Select Sector SPDR ETF: XLB tracks the Materials Select Sector Index, holding 29 S&P 500 materials stocks including Linde (14%), Newmont (8.2%), Freeport-McMoRan (5.7%), Sherwin-Williams (4.8%), and Corteva (4.7%). With ~$6.79B in total assets, an ultra-low 0.09% expense ratio, and broad exposure to chemicals, metals & mining, paper products, and containers, XLB is the benchmark vehicle for institutional sector-level bets on global materials demand.