⛽ XLE $38M Deep ITM Call Sales - Institutions Locking In Energy Profits! 💰
📅 February 17, 2026 | 🔥 Unusual Activity Detected
🎯 The Quick Take
Someone just dumped $38 MILLION in deep in-the-money XLE calls within 18 seconds of each other! These aren't bearish bets - they're massive covered call writes or profit-taking on a long position that's up 19% YTD. With the $48 strike 10% below current price and $42 strike a full 22% below spot, this is institutional money monetizing their energy rally gains while still participating in limited upside. Translation: Big players are saying "I've made my money, let me get paid now and cap my risk."
📊 ETF Overview
Energy Select Sector SPDR Fund (XLE) is the flagship energy sector ETF providing concentrated exposure to S&P 500 energy companies:
- Issuer: State Street Global Advisors (SPDR)
- Net Assets: $33 billion
- Expense Ratio: 0.08%
- Dividend Yield: 2.87% (TTM)
- P/E Ratio: 21.69
- Current Price: $53.60
Top Holdings Dominating the Fund:
- 🛢️ ExxonMobil (XOM): 24.40% - Just crushed Q4 with $28.8B full-year earnings
- 🛢️ Chevron (CVX): 17.90% - Record 4.05M bpd production, dividend up 4%
- 🛢️ ConocoPhillips (COP): 6.88% - $19.9B CFO with Willow project on track
- ⚙️ SLB (Schlumberger): 4.51% - Beat Q4 estimates, guiding $37B revenue for 2026
- 🔧 Williams Companies (WMB): 4.49% - 13th consecutive year of EBITDA growth
Key Insight: XLE's top 10 holdings represent 76% of total assets - this is a concentrated bet on big oil. When ExxonMobil and Chevron move, XLE moves.
💰 The Option Flow Breakdown
📊 The Tape (February 17, 2026)
| Time | Symbol | Side | Buy/Sell | Type | Expiration | Premium | Strike | Volume | OI | Size | Spot | Option Price |
|---|---|---|---|---|---|---|---|---|---|---|---|---|
| 12:18:18 | XLE | BID | SELL | CALL $48 | 2026-02-12 | $15M | $48 | 29K | 73 | 19,094 | $53.60 | $8.10 |
| 12:18:00 | XLE | BID | SELL | CALL $42 | 2026-06-18 | $23M | $42 | 29K | 30K | 19,094 | $53.60 | $12.00 |
Total Premium Collected: $38,000,000 💵
🤓 What This Actually Means
This is a massive covered call or profit-taking strategy - NOT a bearish bet! Here's the breakdown:
Trade 1 - The $48 Call Sale (Feb 12 expiration - ALREADY EXPIRED!):
- 💸 Premium collected: $15M ($8.10 per contract x 19,094 contracts)
- 📊 Deep ITM: $48 strike vs $53.60 spot = $5.60 intrinsic value
- ⚠️ Past expiration: Feb 12 already passed - this is likely assignment/exercise activity being recorded
- 🎯 Effective sale price: $48 + $8.10 = $56.10 (locked in gains above current price!)
Trade 2 - The $42 Call Sale (June 18 expiration):
- 💸 Premium collected: $23M ($12.00 per contract x 19,094 contracts)
- 📊 Deep ITM: $42 strike vs $53.60 spot = $11.60 intrinsic value
- ⏰ 4 months to expiration: Captures Q1 volatility, OPEC+ decisions, and April earnings
- 🎯 Effective sale price: $42 + $12.00 = $54.00 (near current price)
What's really happening here:
This trader likely accumulated a massive XLE position during the rally from $45 to $54+ and is now monetizing those gains in two ways:
- The expired call: Appears to be closing out or settling an assignment from last week's expiration
- The June call: Selling 4-month premium to lock in gains while retaining shares (covered call) OR synthetically selling the position at $54 effective price
The identical contract size (19,094) across both trades suggests this is ONE entity managing a ~$102M position (1.9M shares x $53.60).
Translation for regular folks: Imagine you bought XLE at $46 in January. It's now $54 - you're up 17%! Instead of selling outright, you sell deep ITM calls to:
- 💰 Collect fat premium NOW
- 🛡️ Get guaranteed exit price if called away
- ⏰ Keep holding and collecting dividends until exercise
- 📉 Protect against pullback (premium cushion)
This is sophisticated income extraction, not directional betting.
📈 Technical Setup / Chart Check-Up
YTD Performance Chart
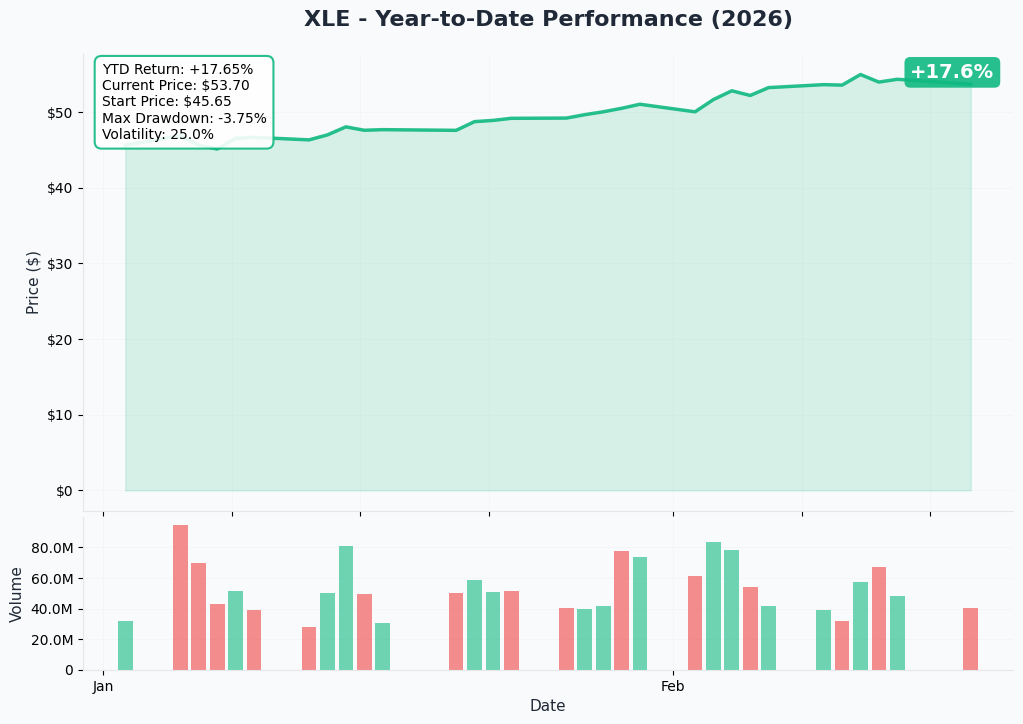
XLE has been on a tear in 2026 - up +14% to +19% YTD depending on measurement date. The rally from $45.61 (52-week low) to the current $53.60 area reflects multiple tailwinds: geopolitical risk premiums from US-Iran tensions, OPEC+ production restraint, and Trump's aggressive "Drill, Baby, Drill" energy policy.
Key observations:
- 📈 Strong uptrend: Series of higher highs and higher lows since January
- 🚀 Pivot signal: StockInvest.us notes a pivot bottom buy signal issued January 7 - XLE up 21.83% since
- 📊 Volume confirmation: Rising volume alongside price = bullish confirmation
- ⚠️ Near resistance: Trading just below 52-week high of $55.24
- 🎢 Recent momentum: Up 9.85% in last 2 weeks alone
Gamma-Based Support & Resistance Analysis
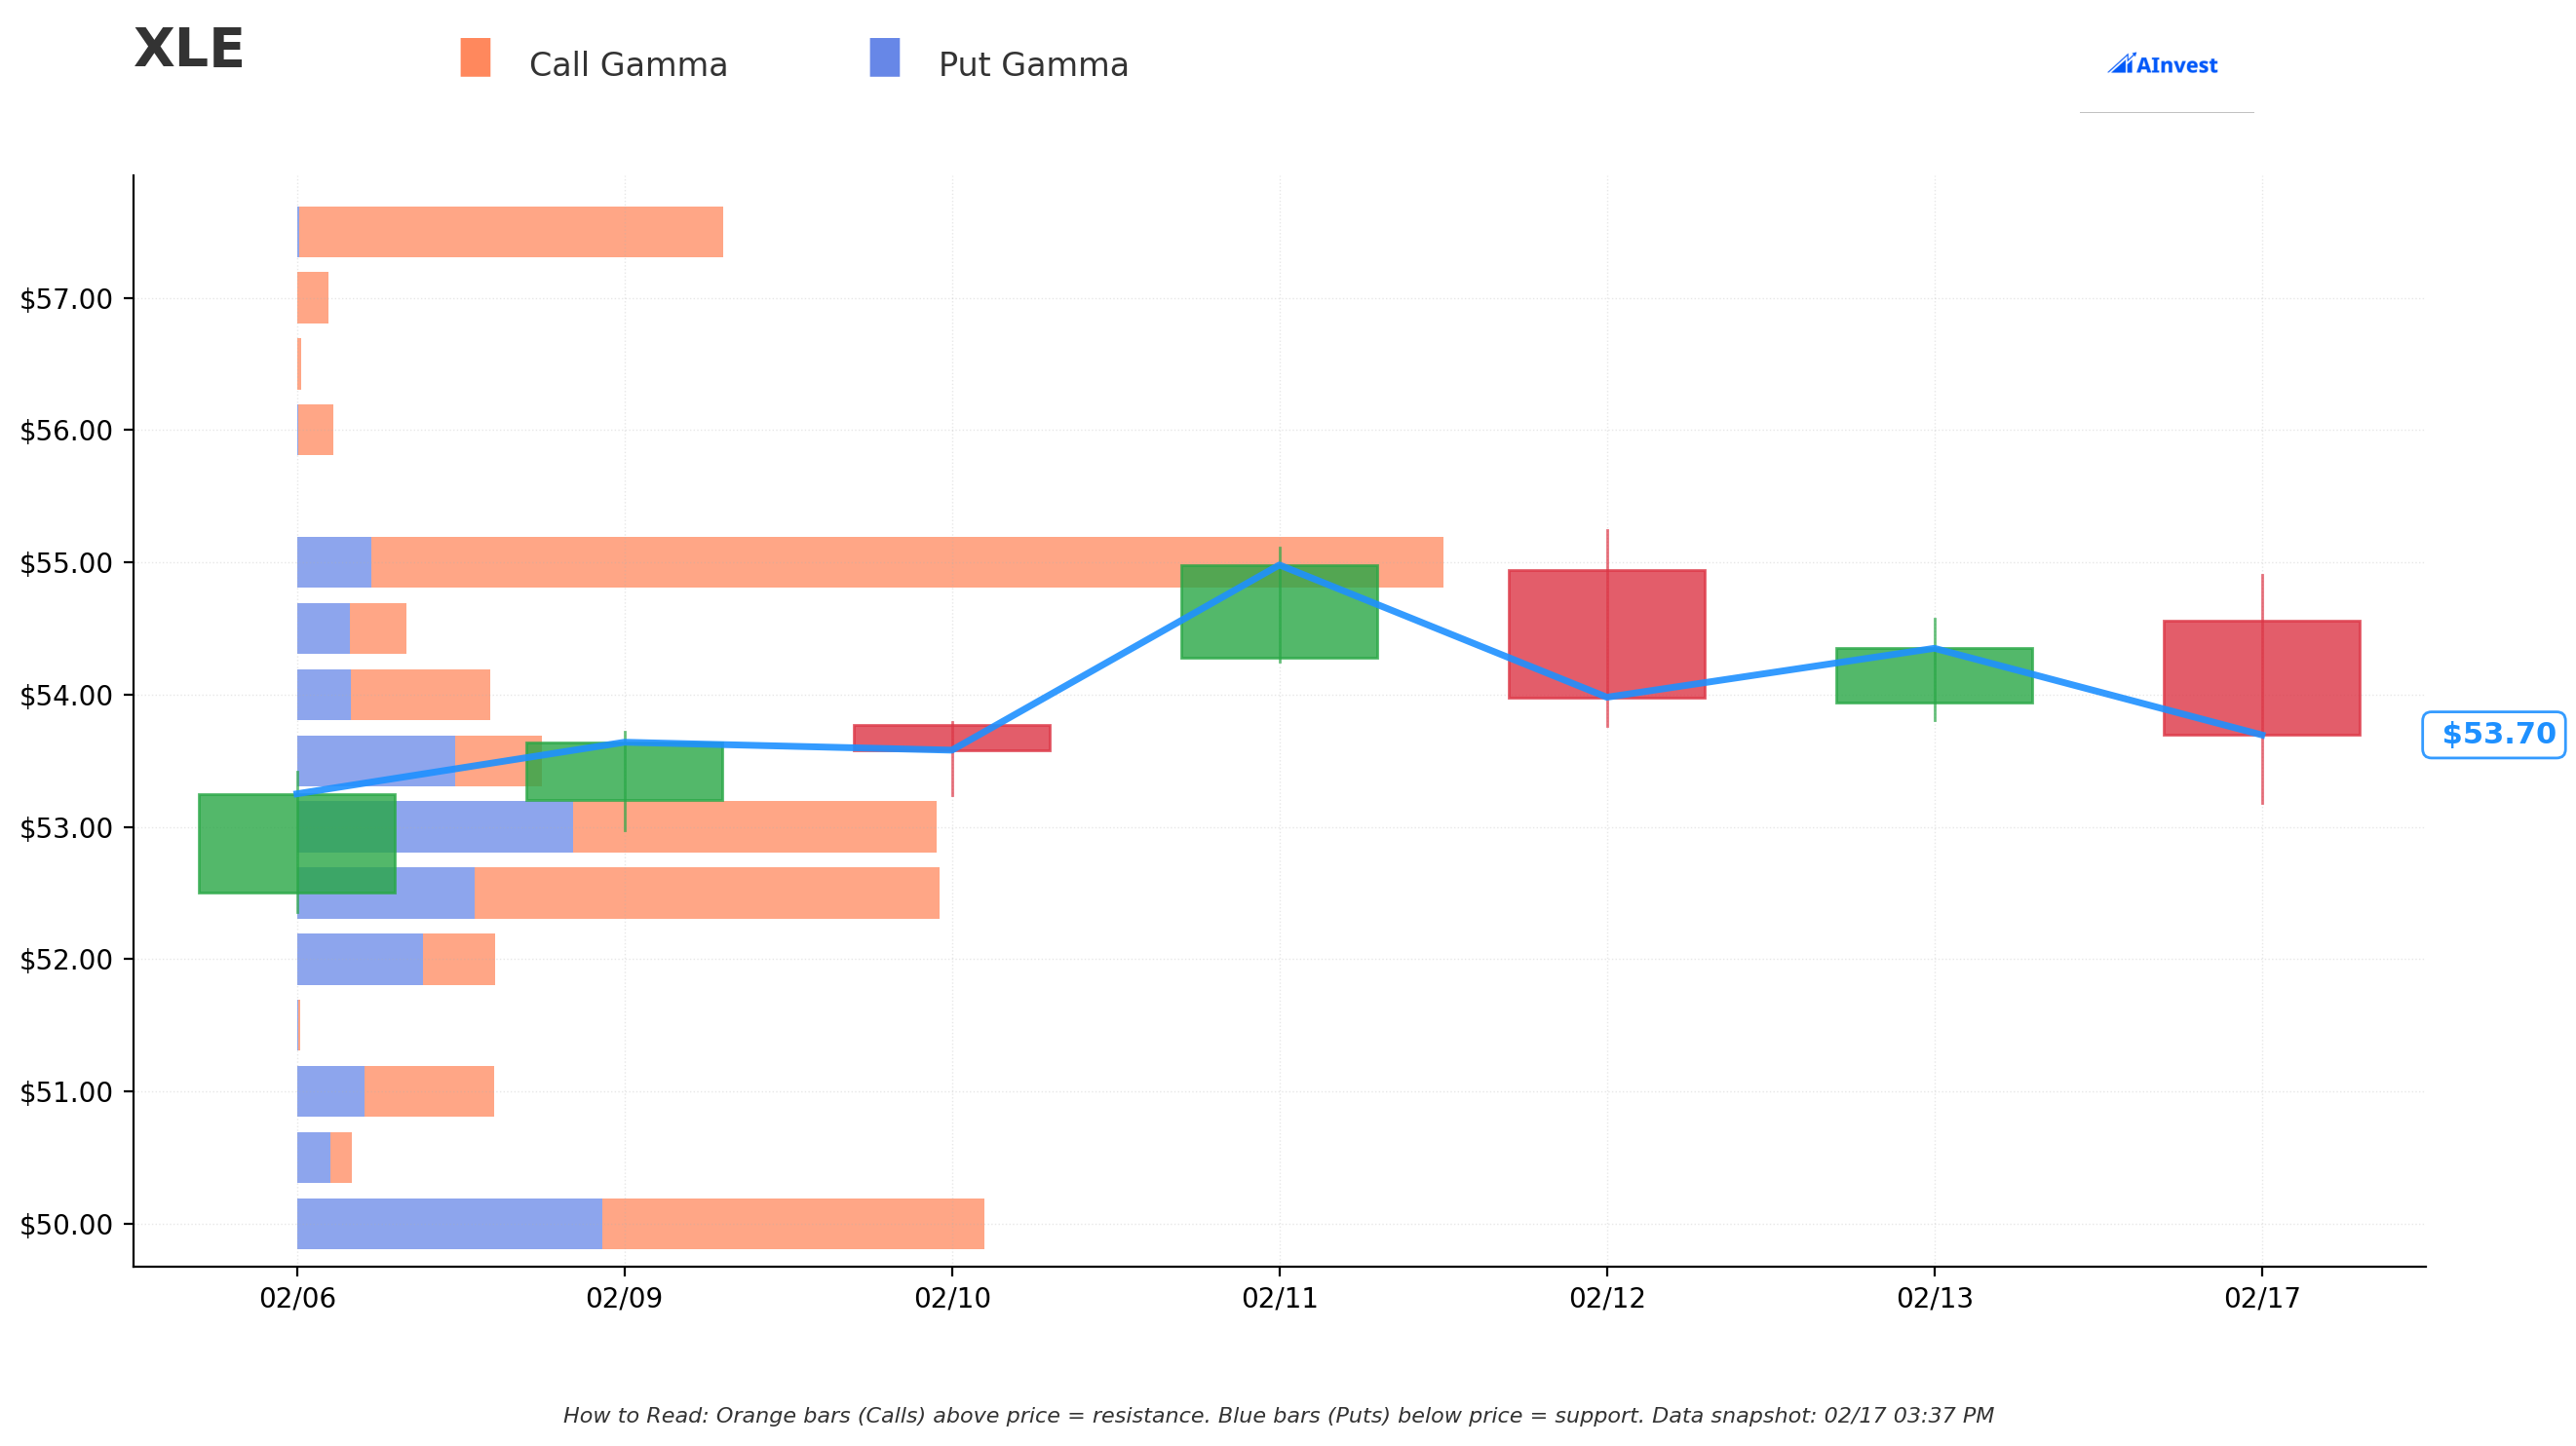
Current Price: $53.70
The gamma exposure map reveals critical price magnets that will govern near-term price action:
🔵 Support Levels (Where Dealers Buy Dips):
- $53.50 - Immediate support (-8.5 net GEX) just 0.4% below current price
- $53.00 - Secondary floor with 79B total gamma exposure (1.3% below)
- $52.50 - Strong support zone at 79.5B gamma (2.2% cushion)
- $50.00 - Major structural floor with 84.8B total gamma (6.9% drawdown)
- $47.50 - Extended support at 31.7B gamma (11.6% drop - significant correction territory)
🟠 Resistance Levels (Where Dealers Sell Rallies):
- $55.00 - MAJOR CEILING with 141.9B total gamma and +123.6 net GEX (2.4% overhead)
- $57.50 - Secondary resistance at 52.8B gamma (7.1% above)
- $60.00 - Extended upside target at 32.5B gamma (11.7% rally needed)
What this means for traders: XLE is trading in a TIGHT range between $53.50 support and crushing $55.00 resistance. The gamma data shows market makers holding enormous CALL positions at $55 (141.9B - the single largest level), which creates natural selling pressure as price approaches that ceiling.
Notice anything? The covered call seller chose strikes ($48 and $42) WELL BELOW current gamma support levels. They're not betting on crash - they're accepting assignment at profitable levels while collecting premium. The $55 gamma wall likely influenced their decision to take profits now rather than wait for uncertain breakout.
Net GEX Bias: Bullish (521.4B call gamma vs 337.9B put gamma) - overall positioning remains bullish, but the massive $55 resistance suggests capped upside near-term.
Implied Move Analysis
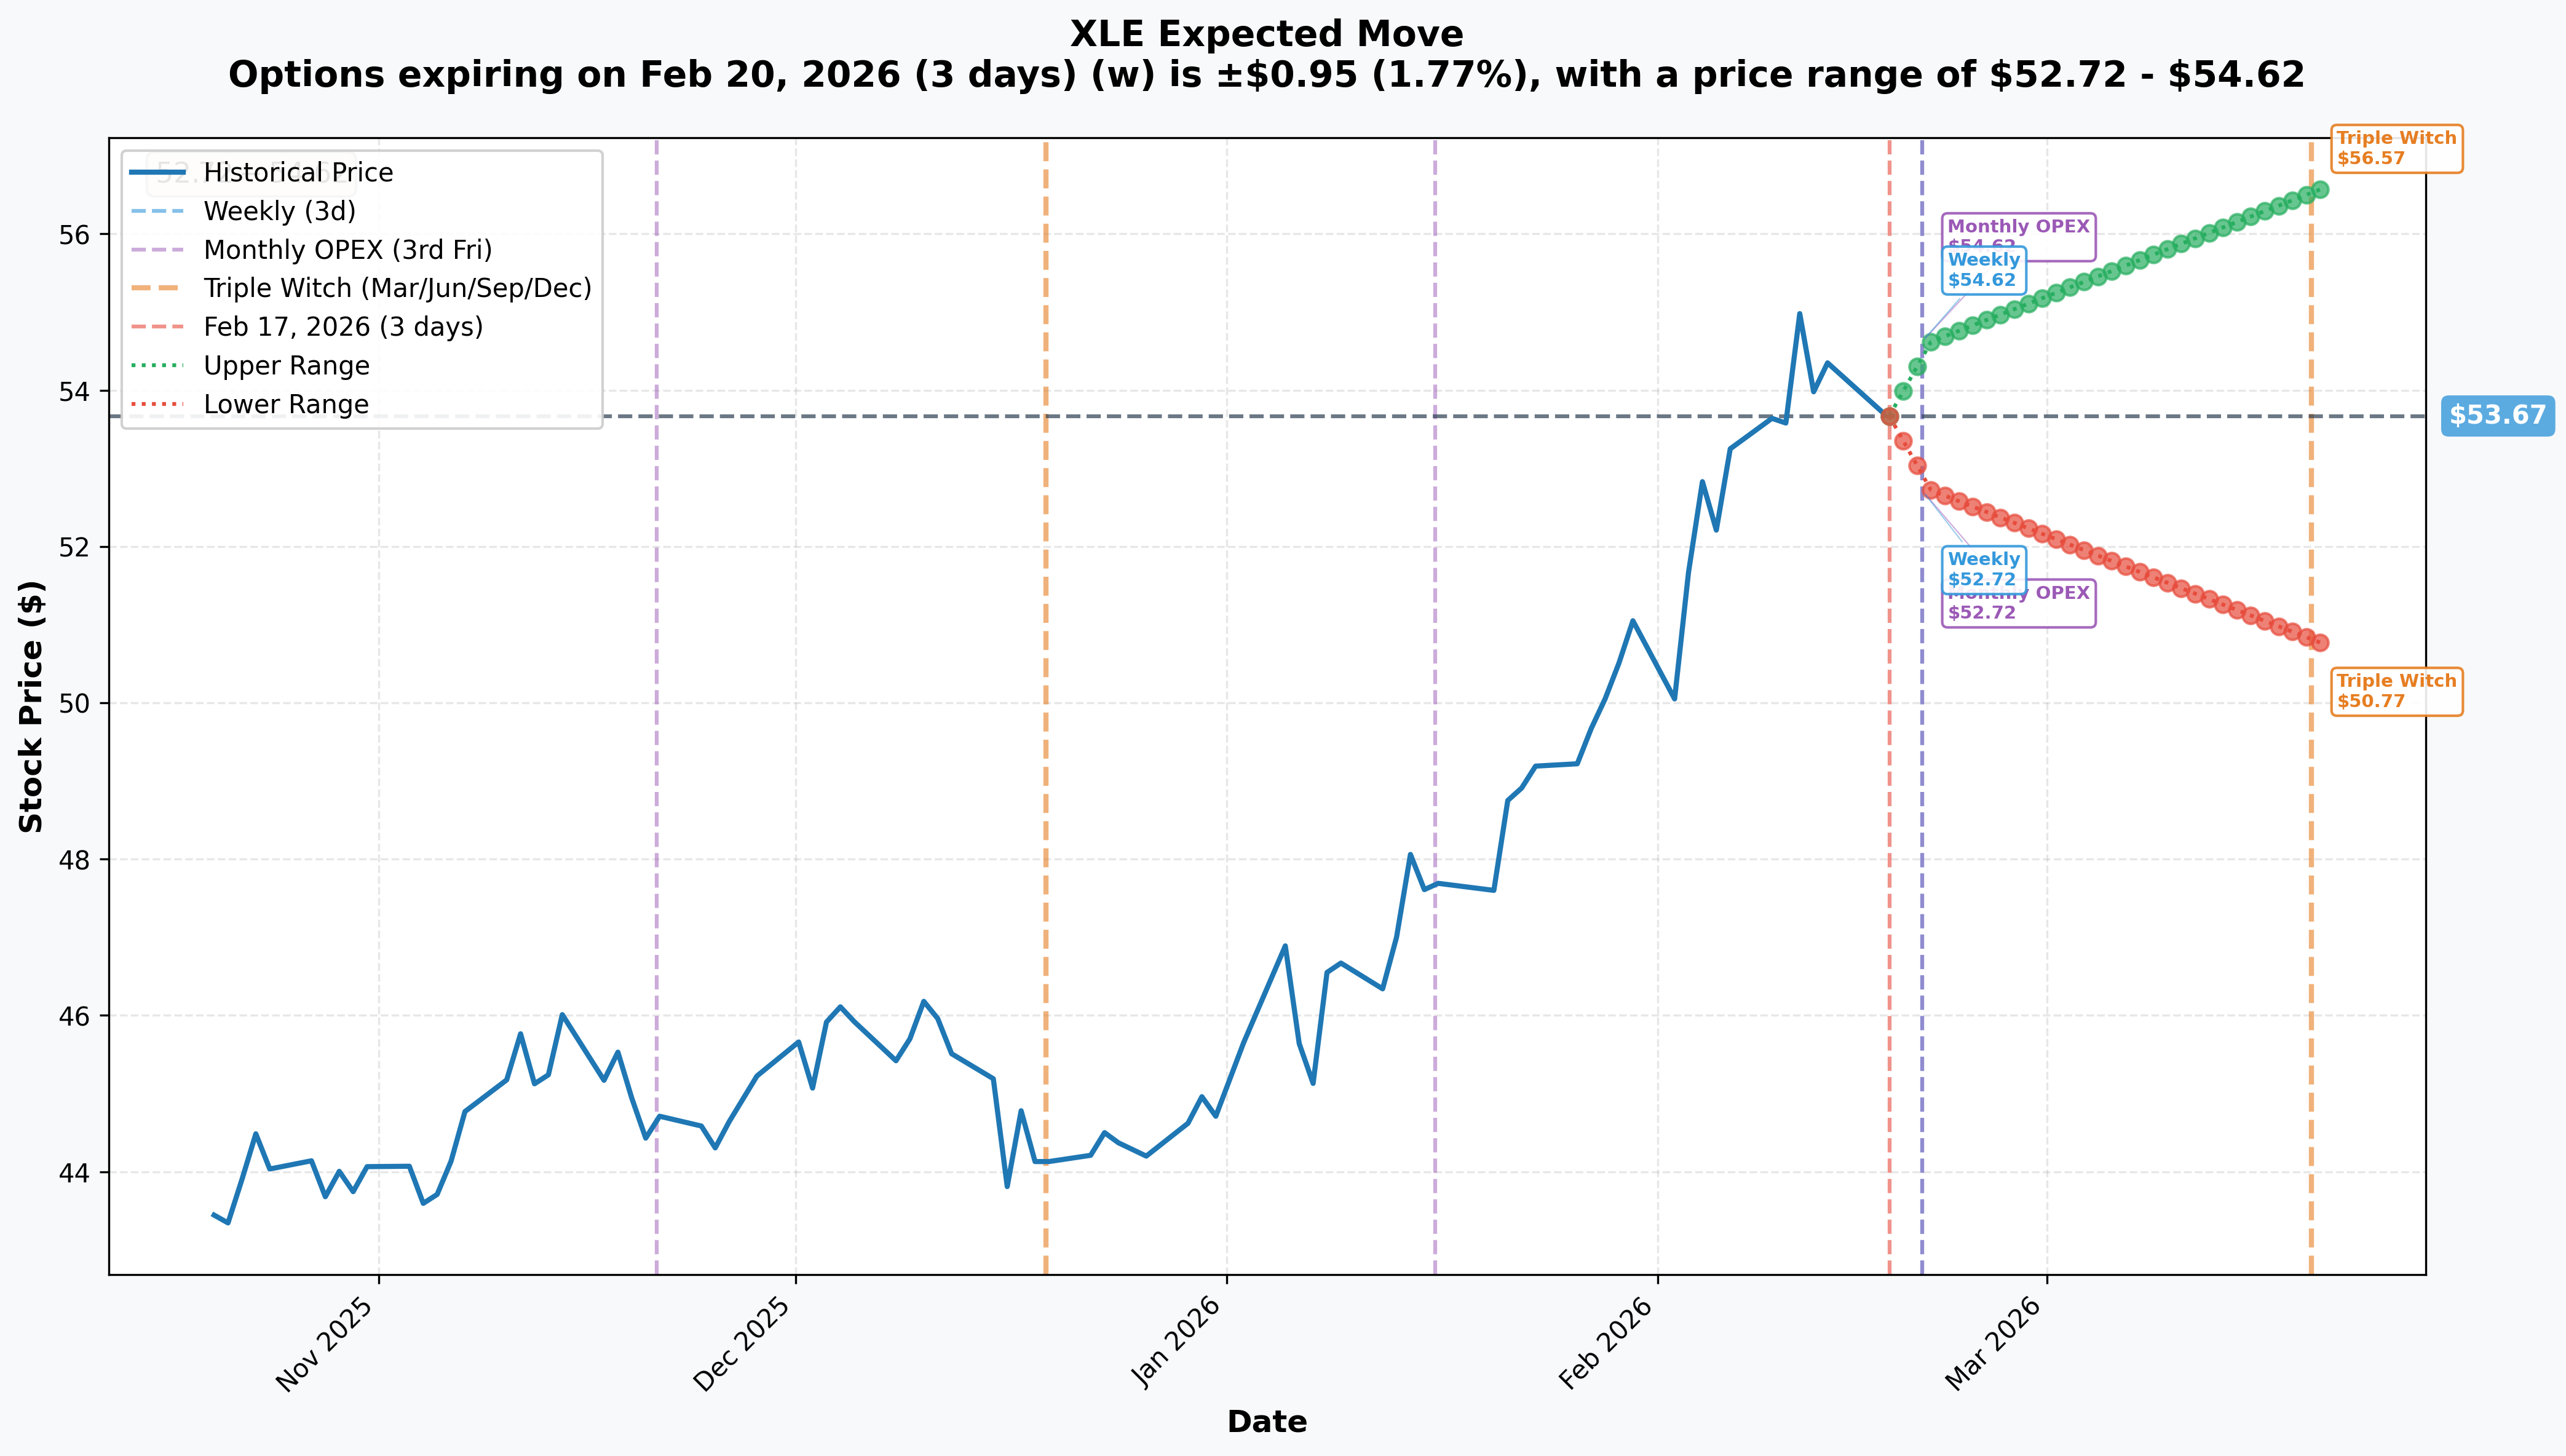
Options market pricing for upcoming expirations:
| Expiration | Days | Implied Move % | Range |
|---|---|---|---|
| Weekly (Feb 20) | 3 days | ±1.77% | $52.72 - $54.62 |
| Monthly OPEX (Feb 20) | 3 days | ±1.77% | $52.72 - $54.62 |
| Triple Witch (Mar 20) | 31 days | ±5.41% | $50.77 - $56.57 |
Translation for regular folks: Options traders expect XLE to stay in a tight $52.72-$54.62 range through this week's expiration. But by March's quarterly expiration, the market prices in a much wider $50.77-$56.57 range (±5.4% move).
The covered call seller's June $42 strike sits FAR below even the bearish implied move scenario - they're giving themselves massive cushion. Even if XLE drops 10%+ to $48, they still profit from the premium collected.
Key insight: The narrow weekly implied move (1.77%) combined with massive gamma at $55 suggests consolidation near current levels - perfect environment for covered call income extraction.
🎪 Catalysts
🔥 Upcoming Catalysts (February - August 2026)
OPEC+ Production Decisions - April 2026 📊
Per Options Trading Report, OPEC+ is reportedly leaning towards resuming output increases from April 2026. This could add supply pressure after Q1's production pause.
- 📅 March 2026: Monthly compliance review
- 📅 April 2026: Potential production increase begins
- 📅 June 7, 2026: 41st OPEC+ Ministerial Meeting - key policy decision
US-Iran Nuclear Negotiations - ONGOING ⚠️
Per Financial Content, second round of indirect talks concluded February 17, 2026 in Geneva. Key implications:
- 🛢️ Bullish scenario (no deal): Geopolitical risk premium ($4-7/bbl) remains, supports oil prices
- 📉 Bearish scenario (deal reached): Premium evaporates, Brent could drop toward $60
- 💸 Refiner upside: Valero, Phillips 66 could see 15-19% earnings growth from lower feedstock costs
Major Holdings Earnings - Late April 2026 💰
| Company | Expected Date | Key Watch Items |
|---|---|---|
| SLB | April 17, 2026 | Middle East recovery, ChampionX synergies |
| ExxonMobil | April 24, 2026 | Permian production (record 1.8M boe/d in Q4), buyback pace |
| Chevron | April 24, 2026 | Venezuela production ramp (50% upside over 18-24 months), $3-4B cost savings target |
Gulf of Mexico Lease Sales - March 2026 🇺🇸
First Gulf of Mexico lease sale under the One Big Beautiful Bill Act (OBBBA) scheduled for March 2026 - 30 auctions planned over 15 years.
✅ Recent Catalysts (Already Happened)
Q4 2025 Earnings - All Major Holdings BEAT 📈
Per Exxon Investor Relations and Chevron Newsroom:
- 🛢️ ExxonMobil (Jan 30): Q4 EPS $1.71 adj vs $1.68 consensus (BEAT), revenue $82.31B (BEAT), 4% dividend increase
- 🛢️ Chevron (Jan 30): Q4 EPS $1.52 adj vs $1.45 consensus (BEAT), record 4.05M bpd production
- 🛢️ ConocoPhillips (Feb 5): $19.9B CFO, $7.3B FCF, Willow project 50% complete
OPEC+ Q1 Production Pause - January 4, 2026 ⛽
Eight OPEC+ members reaffirmed decision to pause planned production increases through Q1 2026, keeping 3.24M bpd of cuts in place.
Trump "Drill Baby Drill" Policy Acceleration 🇺🇸
Per Department of Energy:
- 📈 55% increase in drilling permits on public lands
- 💰 $356.6M in lease sale revenue (more than all 4 Biden years combined)
- 🛢️ US now produces 24.2M bpd oil (more than Saudi Arabia + Russia combined)
🎲 Price Targets & Probabilities
Using gamma levels, implied move data, and catalyst calendar, here are the scenarios through June 18 expiration:
📈 Bull Case (30% probability)
Target: $58-$62
How we get there:
- 🛢️ US-Iran talks collapse completely, Strait of Hormuz tensions escalate → $4-7/bbl risk premium sustained or expanded
- 📈 OPEC+ delays April production increase citing demand concerns
- 💪 Major holdings guide higher at April earnings (production growth, margin expansion)
- 🌊 Breakout above $55 gamma resistance triggers technical chase to $57.50, then $60
- 🇨🇳 China stimulus surprises with oil demand recovery despite EV transition
- 💰 Fund flows continue (+$9.64B last month per ETFdb)
Key metrics needed:
- Brent sustained above $70/bbl
- XOM/CVX production growth continues
- Break above 52-week high ($55.24) on volume
For the covered call seller: In this scenario, their June $42 calls get exercised and they sell at $54 effective ($42 strike + $12 premium). They miss upside above $54 but locked in healthy profit. Classic covered call tradeoff.
🎯 Base Case (45% probability)
Target: $50-$56 range (CONSOLIDATION)
Most likely scenario:
- ⚖️ Oil prices remain range-bound ($63-70 WTI) as geopolitical premium offsets oversupply concerns
- 📊 OPEC+ gradually increases production starting April but manages expectations
- 🤝 US-Iran negotiations drag on without clear resolution
- 🔄 XLE trades between gamma support ($53.50) and resistance ($55.00) for weeks
- 📈 Dividend yield (2.87%) attracts income seekers, puts floor under price
- 💤 Volatility compresses post-earnings season
This is EXACTLY what the covered call seller wants: Stock chops sideways, premium decays, and they either keep shares + premium or get called away at profitable levels. Win-win.
For the covered call seller: Premium collection works perfectly. Stock stays rangebound, they collect $23M from June calls, and either keep shares or sell at $54.
📉 Bear Case (25% probability)
Target: $45-$50
What could go wrong:
- 🤝 US-Iran nuclear deal reached → geopolitical premium evaporates, Brent drops to $60
- 📈 OPEC+ accelerates production increases beyond expectations
- 🇨🇳 China oil demand destruction accelerates - EVs now 50% of new car sales
- 📊 IEA oversupply projection of 3.84M bpd materializes faster than expected
- 💸 Major holdings miss April earnings on margin compression
- 📉 Break below $50 gamma support triggers cascade to $47.50
Critical support levels:
- 🛡️ $53.50: Immediate floor - break here opens door lower
- 🛡️ $50.00: Major gamma support with 84.8B exposure
- 🛡️ $47.50: Extended support - would represent 11%+ drawdown
- 🛡️ $45.00: Disaster floor near 52-week low
For the covered call seller: Even in this scenario, they're protected! The $12 premium on June $42 calls provides cushion down to $41.60 effective cost basis. They'd lose money only if XLE crashes below $42 - a 22% drop from current levels.
💡 Trading Ideas
🛡️ Conservative: Cash-Secured Put Write (The "Copy The Whale" Play)
Play: Sell cash-secured puts at gamma support levels, mimicking institutional income strategy
Structure: Sell XLE March 20 $50 puts for ~$0.80-1.00 premium
Why this works:
- 🎯 $50 strike sits at MAJOR gamma support (84.8B) - dealers will defend this level
- 💰 Collect ~1.5-2% premium in 31 days (18-24% annualized return!)
- 📉 Only assigned if XLE drops 7%+ - would own at $49-49.20 effective cost (near 52-week low)
- 🛡️ ETF structure reduces single-stock blowup risk vs individual oil names
- 📊 2.87% dividend yield means even assignment creates income opportunity
- ⏰ March expiration captures OPEC+ decision timing
Estimated P&L:
- 💰 Max profit: ~$80-100 per contract if XLE stays above $50
- 📈 Breakeven: ~$49.00-49.20
- 📉 Assignment scenario: Own XLE at $49.20, collect 2.87% dividend while waiting for recovery
Position sizing: Only sell what you'd be comfortable owning. 5-10 contracts = $25K-50K capital requirement.
Risk level: Moderate (you could own shares at lower price) | Skill level: Beginner-friendly
⚖️ Balanced: Covered Call on Existing Position (Income Extraction)
Play: If you own XLE shares, sell calls to generate income like the institutional trader
Structure: Sell XLE June 18 $56 calls for ~$1.50-2.00 premium per 100 shares
Why this works:
- 🎯 $56 strike gives 4.5% upside room + premium = 7-8% total return potential
- 💰 Collect 3-4% premium in 4 months on top of 2.87% dividend yield
- 📊 Gamma shows $55 as MAJOR resistance - unlikely to get called away
- 🛡️ Premium cushions any pullback (effective cost basis reduced by $1.50-2.00)
- ⏰ Captures full Q1 catalyst window plus April earnings
Estimated P&L:
- 💰 Stock flat: Keep ~$150-200/contract premium + dividends = 5%+ return in 4 months
- 📈 Stock at $56+: Called away at $57.50-58 effective (premium + strike) = 8% gain + dividends
- 📉 Stock at $50: Lose $360 on shares but keep $150-200 premium = cushioned loss
Why the institutional trader went DEEPER ITM: They're accepting near-certain exercise to LOCK IN profits TODAY. The $42 and $48 strikes guarantee exercise but provide HUGE premium. More conservative retail approach: sell OTM calls for smaller premium but keep upside.
Risk level: Moderate (caps upside, still have downside exposure) | Skill level: Intermediate
🚀 Aggressive: Bull Call Spread on Breakout (ADVANCED ONLY!)
Play: Bet on $55 resistance break with defined risk
Structure: Buy XLE June 18 $55 calls, Sell XLE June 18 $60 calls
Why this could work:
- 🎯 $55 is THE level to watch - 141.9B gamma resistance, 52-week high nearby
- 💥 If XLE breaks $55, chase to $57.50-$60 possible (7-12% move)
- 📊 US-Iran escalation could spike oil prices and energy stocks quickly
- 💰 Defined risk spread costs ~$1.00-1.50 (max loss), potential $5 gain (3-5x return)
- ⏰ 4 months gives time for geopolitical catalyst or OPEC+ surprise
Why this could fail (SERIOUS RISKS):
- ⚠️ Massive gamma resistance at $55 creates selling pressure
- 📉 Iran deal could crash oil prices and XLE 10%+
- 💸 OPEC+ production increase could pressure prices
- 📊 Already up 19% YTD - lots of profit-taking overhead
- 🇨🇳 China demand destruction accelerating (50% EV sales!)
Estimated P&L:
- 💰 Cost: ~$100-150 per spread
- 📈 Max profit: $500 per spread if XLE at $60+ at expiration (233-400% ROI)
- 📉 Max loss: $100-150 (spread cost) if XLE below $55
Entry trigger:
- ⏰ Wait for confirmed break above $55 on volume before entering
- 🎯 Don't chase - better entry on pullback to $54 after initial breakout
Risk level: HIGH (can lose entire premium) | Skill level: Advanced only
⚠️ Risk Factors
Don't get caught by these potential landmines:
-
🛢️ Oil oversupply looming: The IEA projects a massive 3.84M bpd surplus in 2026. That's nearly 4% of global demand sitting in storage. J.P. Morgan and Goldman Sachs both forecast Brent averaging only $56-58/bbl through 2026 - well below current $68-69 levels. If these forecasts prove right, XLE could test $45-48 support.
-
🤝 US-Iran deal risk: Per Financial Content, nuclear negotiations are progressing in Geneva. A successful "freeze-for-freeze" deal could evaporate the $4-7/bbl geopolitical risk premium OVERNIGHT. That's potentially 5-10% downside in crude - and 7-12% downside in XLE - in a single headline.
-
🇨🇳 China demand destruction is REAL: Per IEA analysis, China's transport oil use peaked after 2019 and recorded its FIRST annual decline in 2024. EVs now account for 50% of new car sales in China, displacing over 1M bpd of implied oil demand. This isn't temporary - it's structural decline in the world's largest oil demand growth engine.
-
📈 OPEC+ April production increase: Per Options Trading Report, OPEC+ is leaning towards resuming output increases from April. After months of restraint, adding supply into an already oversupplied market could pressure prices significantly.
-
🏦 Concentration risk: XLE's top 10 holdings represent 76% of assets, with ExxonMobil and Chevron alone at 42.3% combined. This isn't sector diversification - it's a leveraged bet on two companies. If XOM has an operational issue or CVX faces regulatory problems, XLE moves disproportionately.
-
💰 Valuation stretched after rally: Up 19% YTD with P/E at 21.69x after a 10% two-week surge. The easy money has been made. Technical indicators show XLE approaching overbought territory near 52-week highs.
-
🌍 Energy transition headwinds: Per Carbon Credits, EVs are on track to replace 5+ million bpd of oil demand globally by 2030. CATL forecasts 50% of heavy-duty truck sales will be electric by 2028. The long-term demand trajectory is DOWN, even if near-term volatility creates trading opportunities.
-
📉 Gamma ceiling at $55: The 141.9B call gamma at $55 (strongest single level) means market makers will systematically SELL into rallies to hedge. This creates mechanical resistance making breakouts difficult. The institutional trader selling $38M in calls clearly doesn't expect a sustained move above $55.
-
🛢️ US inventory builds: Per Options Trading Report, a sharp 13.4M barrel build in US stockpiles was reported in mid-February - the largest increase since November 2023. Rising inventories = bearish for prices.
🎯 The Bottom Line
Real talk: Someone just collected $38 MILLION in premium by selling deep ITM calls on what appears to be a 1.9 million share XLE position (~$102M notional). This isn't a bearish bet on energy - it's sophisticated profit extraction by institutions who've ridden the 19% YTD rally and are now saying "I'm happy to lock in gains here."
What these trades tell us:
- 🎯 Large institution expects XLE to stay RANGE-BOUND through June (why else sell deep ITM calls?)
- 💰 They're accepting near-certain exercise to monetize gains NOW rather than wait for uncertain upside
- 📊 The $55 gamma wall and bearish macro backdrop (oversupply forecasts) likely influenced timing
- ⚖️ They're NOT calling a crash - just capping participation above $54 effective price
- ⏰ The dual-expiration structure (Feb 12 past + June 18) suggests ongoing position management, not new directional bet
This is textbook covered call strategy at scale: "I've made good money, let me collect more premium while protecting against reversal."
If you own XLE:
- ✅ Consider selling covered calls against your position - you don't need $38M to copy the strategy
- 📊 The $55 resistance level is REAL - selling $56-57 strike calls captures premium with limited exercise risk
- 💰 2.87% dividend yield + 3-4% call premium = potential 6%+ income in 4 months
- 🛡️ If assigned, you lock in gains near highs - that's the GOAL, not a problem
If you're watching from sidelines:
- ⏰ Wait for pullback to $50-52 gamma support before initiating long position
- 📊 Current entry at $53.60 offers limited margin of safety given $55 resistance and macro headwinds
- 🎯 Cash-secured puts at $50 strike let you get paid to wait for better entry
- ⚠️ The 19% YTD rally means lots of profit-taking overhead - don't chase
If you're bearish:
- 📉 $55 gamma resistance and institutional profit-taking suggest limited near-term upside
- 🎯 But $50-53.50 gamma support makes aggressive shorts risky - range trading more likely
- ⏰ Wait for Iran deal headline or OPEC+ production increase announcement for directional catalyst
- 🛡️ Bear put spreads ($52/$48) offer defined-risk way to play downside
Mark your calendar - Key dates:
- 📅 February 20 (Thursday) - Weekly/Monthly OPEX
- 📅 March 2026 - First Gulf of Mexico lease sale under OBBBA
- 📅 March 20 - Triple Witch expiration (±5.41% implied move)
- 📅 April 2026 - Potential OPEC+ production increase begins
- 📅 April 17 - SLB earnings
- 📅 April 24 - ExxonMobil and Chevron earnings
- 📅 June 7 - 41st OPEC+ Ministerial Meeting
- 📅 June 18 - The $42 call trade expires (second leg of institutional position)
Final verdict: XLE's energy rally has been impressive, but the easy gains are behind us. The $38M institutional covered call trade signals smart money is DERISKING at current levels - not because they're bearish on oil, but because risk/reward has shifted after 19% YTD gains with $55 resistance overhead and macro headwinds mounting (oversupply, China demand destruction, potential Iran deal).
Follow the institutional playbook: Collect premium, protect profits, and let someone else chase the top. Energy isn't going away, but the next 10% move from here is a lot less certain than the last 19%. 💪
Disclaimer: Options trading involves substantial risk of loss and is not suitable for all investors. This analysis is for educational purposes only and not financial advice. Past performance doesn't guarantee future results. Deep ITM covered call strategies involve complex tradeoffs between premium income and upside participation. ETFs can lose value even when underlying commodities perform well due to contango and other structural factors. Always do your own research and consider consulting a licensed financial advisor before trading. The institutional trades analyzed here reflect specific portfolio management needs that may not apply to retail traders.
About Energy Select Sector SPDR Fund (XLE): XLE is an exchange-traded fund that tracks the Energy Select Sector Index, providing exposure to S&P 500 energy sector companies including integrated oil & gas giants, exploration & production firms, equipment & services providers, and midstream operators. With $33 billion in net assets and a 0.08% expense ratio, it's the most liquid and widely-traded energy sector ETF available.