🏦 XLF: $11M LEAP Bet on Financial Sector Explosion!
📅 December 9, 2025 | 🔥 Institutional Activity Detected
🎯 The Quick Take
Someone just dropped $11 MILLION on a September 2026 call LEAP for XLF at the $49 strike - that's a 9-month bet that the financial sector crushes it through next year! This massive bullish position comes right as the sector sits near 52-week highs at $53.29, with major bank earnings just weeks away and the Fed set to announce rate cuts on December 10. Translation: Big money is betting financials keep running! 🚀
💼 What is XLF?
Financial Select Sector SPDR Fund (XLF) is the largest financial sector ETF, providing diversified exposure to 79 holdings across the S&P 500 financial sector. Managed by State Street, this powerhouse ETF tracks everything from mega-cap banks to payment processors to insurance giants.
Key Stats:
- Ticker: XLF (NYSE Arca)
- Current Price: $53.29 (as of December 9, 2025)
- 52-Week Range: $42.21 - $54.50
- YTD Performance: +11.7%
- Zacks ETF Rank: 1 (Strong Buy)
Top 5 Holdings:
- 🏢 Berkshire Hathaway (BRK.B): 12.27% - Warren Buffett's insurance and investment powerhouse
- 🏦 JPMorgan Chase (JPM): 11.21% - America's largest bank by assets
- 💳 Visa (V): 7.50% - Global payment processing leader
- 💳 Mastercard (MA): 6.07% - Payment network giant
- 🏦 Bank of America (BAC): 4.79% - Consumer banking leader
The top 10 holdings make up approximately 54.63% of total assets, giving concentrated exposure to the financial sector's biggest players.
💰 The Option Flow Breakdown
📊 What Just Happened
Here's the complete trade breakdown:
| Date | Time | Symbol | Action | Type | Strike | Expiration | Volume | Premium | Strategy | Z-Score |
|---|---|---|---|---|---|---|---|---|---|---|
| 2025-12-09 | 11:04:18 | XLF | BUY | CALL | $49 | 2026-09-18 | 15,000 | $11M | Long Call | 1999.19 |
🤓 What This Actually Means
Real talk: This is EXTREMELY UNUSUAL activity with a Z-Score of 1,999.19 - that's not a typo! Here's what makes this trade special:
🔥 Size Matters: 15,000 contracts = controlling 1.5 million shares worth of exposure 💰 Deep Pockets: $11M premium means this isn't retail - this is institutional money 📅 Long Horizon: September 2026 expiration (282 days out) = LEAP territory 💵 Already Profitable: $49 strike vs. $53.29 current price = already $4.29 in-the-money 🎯 Conviction Play: Buying calls when XLF is near 52-week highs shows serious bullish conviction
Translation for regular folks: Someone with very deep pockets just bet $11 million that the financial sector continues climbing over the next 9 months. They didn't buy short-term lottery tickets - they bought a LEAP that's already profitable, suggesting they expect XLF to keep grinding higher through bank earnings season, Fed rate cuts, and Trump's deregulation agenda.
This trade generates $500 volume-to-OI ratio which signals this is fresh money coming in, not just rolling positions. The institutional player is establishing a brand new bullish stake!
📈 Chart Check-Up
YTD Performance Analysis
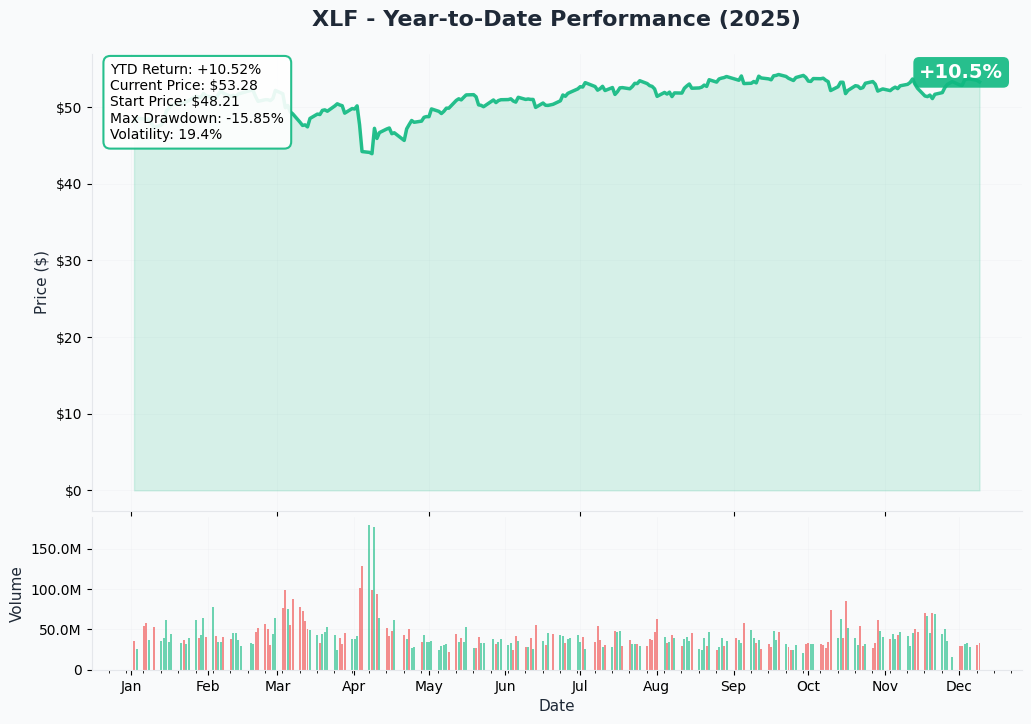
XLF has been on an absolute tear in 2025, up 11.7% year-to-date! The chart shows a beautiful uptrend that accelerated post-election as investors priced in Trump's pro-business, deregulation agenda. The ETF broke out from the $50-51 consolidation zone in November and hasn't looked back, now testing the upper end of its 52-week range at $54.50.
Key technical observations:
- 📈 Strong uptrend since October 2024
- 💪 Higher lows throughout the year showing consistent buying
- 🚀 Post-election surge from ~$48 to $53+ in just 6 weeks
- 👀 Testing resistance near $54.50 all-time highs
🎯 Gamma-Based Support & Resistance Analysis
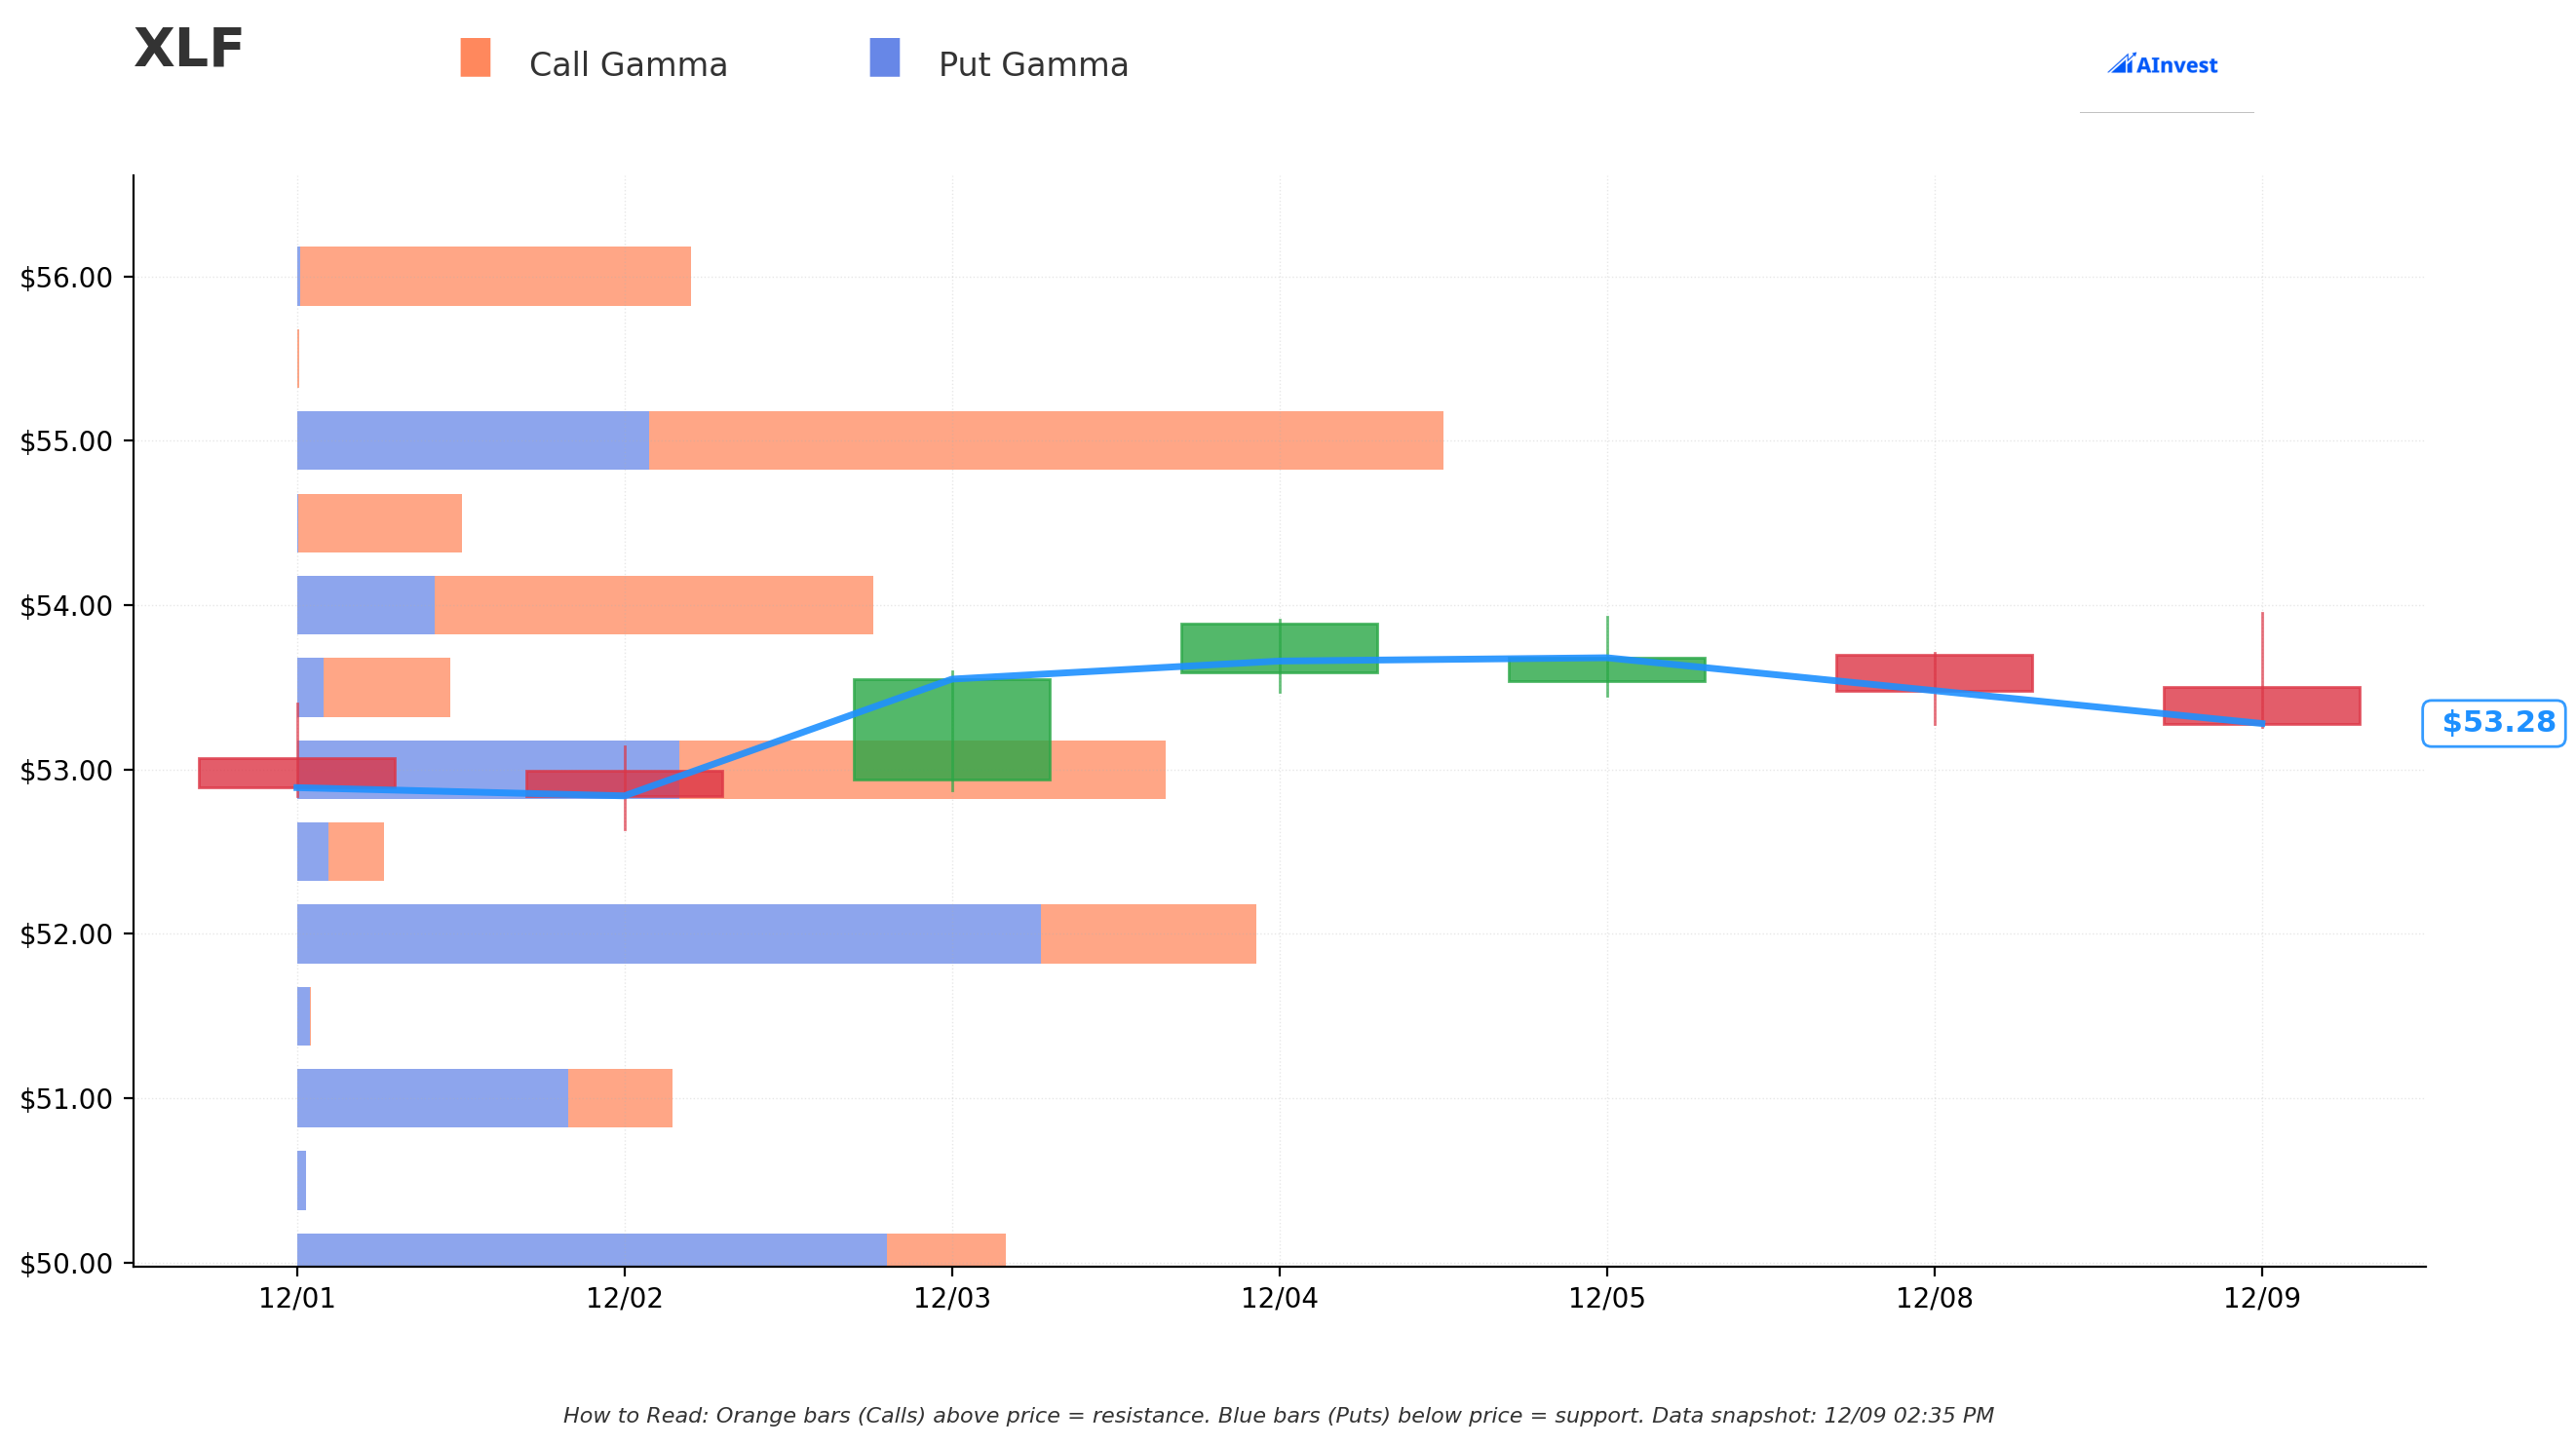
Based on the gamma exposure data, here's where XLF is likely to find support and resistance:
Current Price: $53.29
Immediate Support Levels:
- 🛡️ $53.00 (0.54% below): Strongest nearby support with net gamma of +27.51M and total gamma of 221.41M. This is a major floor where heavy call interest should provide buying support.
- 🛡️ $52.00 (2.42% below): Secondary support with massive put gamma of 188.94M. If XLF dips, expect strong institutional buying here.
- 🛡️ $51.00 (4.30% below): Tertiary support level with put gamma providing a safety net.
Resistance Levels Above:
- 🚧 $53.50 (0.40% above): First resistance with net gamma of +25.42M. Light resistance, should break easily.
- 🚧 $54.00 (1.33% above): Moderate resistance with 112.46M call gamma and 77.59M net gamma. This is where profit-taking might emerge.
- 🚧 $55.00 (3.21% above): Major resistance zone with massive 295.91M total gamma and 203.33M call gamma. Big psychological level.
- 🚧 $56.00 (5.09% above): Strong resistance with 99.48M call gamma acting as a potential ceiling.
Net Gamma Bias: BULLISH ✅
- Total call gamma: 886.18M
- Total put gamma: 788.26M
- Net bias toward calls shows market expects upside continuation
The gamma profile suggests XLF has a natural magnet toward $54-55, with strong support at $53 making pullbacks unlikely. The $11M LEAP buyer knows this floor is solid!
📊 Implied Move Analysis
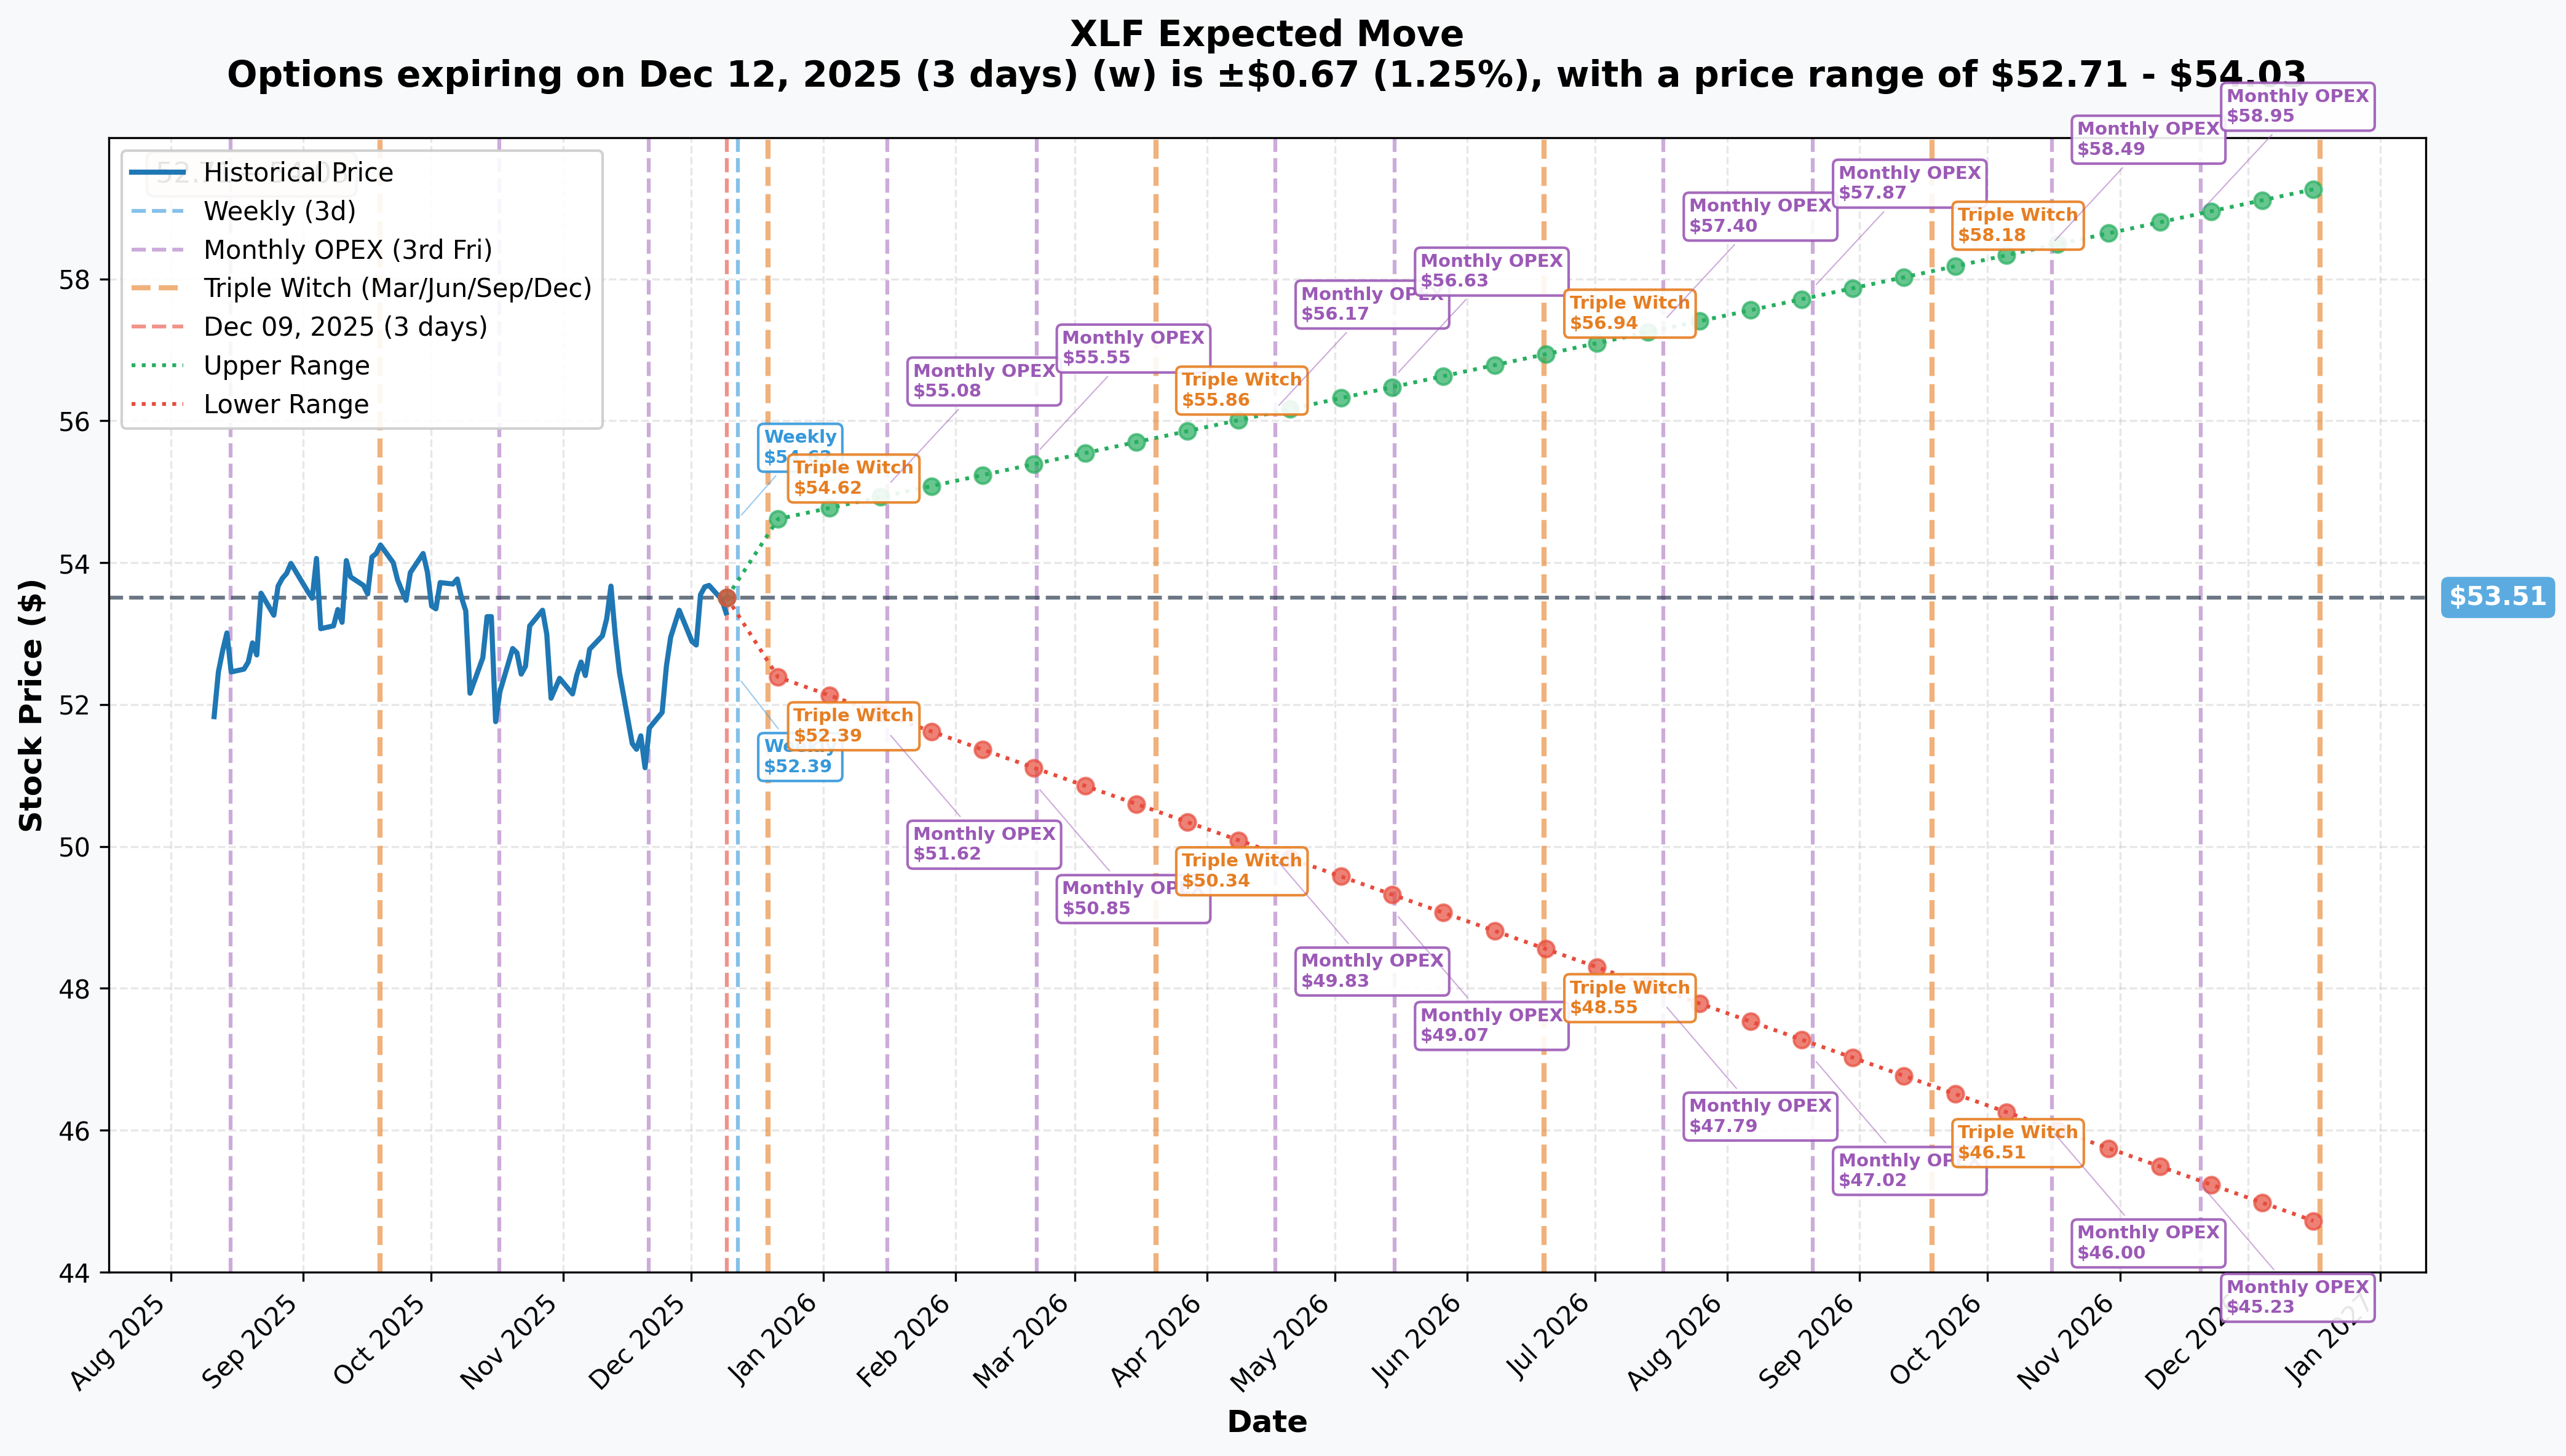
Options markets are pricing in specific movement ranges based on expiration cycles:
Weekly (Dec 12 - 3 days out):
- Implied Move: ±1.25% (±$0.67)
- Range: $52.71 - $54.03
- Translation: Market expects XLF to stay in a tight range through this week's FOMC meeting
Monthly OPEX (Dec 19 - 10 days out):
- Implied Move: ±2.01% (±$1.08)
- Range: $52.43 - $54.59
- Translation: Bit more volatility expected around year-end, but still contained
Yearly LEAP (Dec 2026 - 374 days out):
- Implied Move: ±11.99% (±$6.42)
- Range: $44.68 - $59.29
- Translation: Over the next year, options markets see XLF trading between mid-$40s and nearly $60
Key Insight: The $11M LEAP buyer paid for a $49 strike when the 1-year upper range is $59.29. That's massive upside potential if the bull case plays out! Even the base case of $53-55 makes this trade profitable.
🎪 Catalysts: What's Driving This Trade?
📅 IMMEDIATE: December 10 FOMC Meeting (TOMORROW!)
Meeting Details:
- 📍 When: December 9-10, 2025
- 🕐 Announcement: Wednesday Dec 10 at 2:00 PM ET
- 🎤 Powell Press Conference: 2:30 PM ET
Expected Action:
- ✅ ~90% probability of 25 basis point rate cut according to Mortgage Reports
- 📉 New target: 3.50%-3.75% (from current 3.75%-4.00%)
- 📊 Summary of Economic Projections (SEP): Critical 2026 rate path guidance
- 📈 Dot Plot Update: Will determine bank lending margins for next year
Why It Matters: Rate cuts are BULLISH for banks in the current environment. While lower rates reduce net interest income, the Fed cutting signals economic stability and allows banks to reduce deposit costs faster than loan yields fall. JPMorgan's CEO already noted improving net interest margins in Q4!
🏦 Major Bank Earnings (April 11-15, 2025)
Confirmed Schedule:
Friday, April 11 (Pre-Market):
- 🏦 JPMorgan Chase (JPM) - 11.21% of XLF
- 🏦 Wells Fargo (WFC) - Conference call at 10:00 AM ET
- 💼 Morgan Stanley (MS)
Monday, April 14:
- 💼 Goldman Sachs (GS)
Tuesday, April 15 (Pre-Market):
- 🏦 Bank of America (BAC) - 4.79% of XLF
- 🏦 Citigroup (C)
Recent Performance (Context): Just last month, these same banks crushed Q4 2024 earnings:
- ✅ JPMorgan: Net income surged 50% to $14.0B with EPS of $4.81 (vs. $4.09 expected) per CNBC
- ✅ Bank of America: Beat with $6.7B net income ($0.82 per share vs. $0.77 expected) according to RoboForex
- ✅ Industry Net Interest Margin: Up 5 basis points to 3.28% - highest since pre-pandemic per FDIC
Earnings Expectations for Q1 2025:
- Major Banks industry projected +0.7% earnings growth on +5.3% higher revenues according to Nasdaq
Why The LEAP Makes Sense: The buyer positioned for September 2026, meaning they'll capture TWO full earnings cycles (Q1 and Q2 2025) while holding this position. If banks continue beating, this LEAP gains value!
🏛️ Trump Deregulation Agenda (MASSIVE Catalyst!)
What's Already Happened:
Executive Orders Signed:
- ✅ "Unleashing Prosperity Through Deregulation" (May 9, 2025): Targeted "10-to-1" reduction in regulations per R Street Institute
- ✅ "Guaranteeing Fair Banking for All Americans" (August 7, 2025): Directed agencies to combat "debanking" per Sidley Austin
- ✅ Two-Year Regulatory Relief (July 2025): Relief from "stringent Biden-era regulations" according to Goodwin Law
Regulatory Leadership Changes: Trump replaced heads of SEC, OCC, FDIC, and CFPB with deregulation-focused leaders according to Oliver Wyman
CFPB Gutted:
- 📉 Examination staff reduced from 437 to 50 people
- 📉 Examinations cut by 50%
- 📉 Enforcement actions down 37% in first 6 months of 2025
- 📉 Penalties fell 32% (Source: Goodwin Law)
What's Coming:
Basel III Endgame (Mid-2026):
- 📅 Original Timeline: Phase-in starting July 1, 2025
- 📅 New Timeline: Likely delayed until 2026 with significant revisions
- 💰 Original Impact: 16-25% increase in capital requirements
- 💰 Expected Impact: Only a few percentage points after recalibration (Source: Oliver Wyman)
Translation: Banks were expecting to tie up $100+ billion in extra capital. Now they can use that for buybacks, dividends, and lending instead. HUGE win for bank stocks!
💵 Capital Return Programs
2025 Stress Test Results: Banks passed with flying colors, maintaining average 11.6% common equity Tier 1 capital (vs. 4.5% minimum required) per PYMNTS
Major Dividend Increases Already Announced:
- 💰 Bank of America: Raised dividend 8% to $0.28 per share per FinancialContent
- 💰 Wells Fargo: Increased to $0.45 from $0.40 according to Investing.com
- 💰 Morgan Stanley: Approved new $20B share repurchase program and raised dividend to $1.00 per share per Investing.com
Sector Dividend Yield: Now at 3.2% average, with JPMorgan at 2.8%, Bank of America at 2.5% according to AInvest
Fed averaging of 2024-2025 stress tests could unlock $100 billion in capital over two years for buybacks and dividends per RBC Capital Markets
🤝 M&A Activity Acceleration
The regulatory environment has shifted dramatically in favor of bank mergers:
Major Deals Announced:
- 💼 Fifth Third/Comerica: $10.9B all-stock merger creating 9th-largest U.S. bank per Harvard Corporate Governance Blog
- 💼 Rocket Companies/Mr. Cooper: $9.4B home loan servicer acquisition per PwC
- 💼 Global Payments/Worldpay: $24.3B acquisition drove Q4 deal value up 179.2% quarter-over-quarter according to Cherry Bekaert
Market Activity: Deal value reached $50.1B in late 2024, up 183.3% year-over-year per Cherry Bekaert
Why It Matters: M&A creates value for acquirers through cost synergies and market share gains. More deals = better returns for bank shareholders = higher stock prices = XLF goes up!
💎 Berkshire Hathaway Insurance (12.27% of XLF!)
XLF's largest holding absolutely crushed Q4 2024:
- 🚀 Operating Profit: Up 71% to $14.527B according to Report Linker
- 🚀 Insurance Underwriting: Jumped 302% to $3.409B (vs. $848M in Q4 2023) per Morningstar
- 🚀 GEICO Profit: More than doubled to $7.8B in 2024 per Repairer Driven News
The insurance sector's turnaround directly benefits XLF given Berkshire's massive weight in the fund!
🎲 Price Targets & Probabilities
Based on gamma levels, implied move data, and upcoming catalysts, here are the scenarios:
🚀 Bull Case: $56-58 (Target by Q2 2025)
Probability: 35-40%
Price Target: $56 (5.09% upside from current $53.29)
Path to Get There:
- ✅ Fed cuts 25bps on December 10 (already priced in at ~90% probability)
- ✅ SEP shows friendly 2026 rate path with 2-3 cuts projected
- ✅ Bank earnings in April beat expectations (following Q4's 50% JPM growth)
- ✅ Basel III officially delayed or watered down by mid-2026
- ✅ M&A activity continues with 1-2 more mega-deals announced
Gamma Analysis: $56 strike has massive call gamma (99.48M) but represents a clear breakout level. If XLF clears $55 (the big resistance with 295.91M total gamma), momentum should carry it to $56.
Implied Move Support: The 1-year upper range is $59.29, so $56-58 is well within the expected distribution.
What Makes This Happen:
- Major banks guide Q2 2025 earnings higher
- Net interest margins expand another 10+ basis points
- Trump announces specific deregulation wins (Basel III delay confirmation)
- XLF breaks through $55 resistance on heavy volume
LEAP Value at $56: The $49 strike LEAP would be worth at least $7.00 ($7 intrinsic value), vs. current cost of ~$4.30. That's a 63% return on the $11M position = $6.9M profit!
⚖️ Base Case: $53-55 (Consolidation Through Q1)
Probability: 45-50%
Price Target: $54 (1.33% upside from current $53.29)
Path to Get There:
- ✅ Fed cuts 25bps but signals slower pace for 2026
- 📊 Bank earnings meet (not beat) expectations in April
- 📊 Market digests political uncertainty around Trump policies
- 📊 XLF consolidates gains from the massive post-election rally
Gamma Analysis: $54 is a moderate resistance level with 77.59M net gamma. The current price of $53.29 sits right between the $53 support (27.51M net gamma) and $54 resistance, creating a natural trading range.
Implied Move Support: Monthly OPEX range of $52.43-$54.59 suggests this consolidation is expected by options markets.
What Makes This Happen:
- Status quo continues: steady economy, no major surprises
- Banks deliver solid but unspectacular Q1 results
- Fed takes "wait and see" approach on further cuts
- Investors take profits after the strong 2024/early 2025 run
LEAP Value at $54: The $49 strike would be worth $5.00 intrinsic value, still profitable but modest gains vs. entry cost around $4.30.
😰 Bear Case: $50-52 (Pullback on Macro Concerns)
Probability: 15-20%
Price Target: $52 (2.42% downside from current $53.29)
Path to Get There:
- ❌ Fed holds rates or signals hawkish 2026 pivot
- ❌ Bank earnings disappoint with NIM compression guidance
- ❌ Commercial real estate losses accelerate (office CMBS at record 11.8% delinquency)
- ❌ Recession fears resurface from economic data weakening
Gamma Analysis: $52 has strong put gamma support (188.94M), making it a likely floor. This level should attract institutional buying if XLF dips.
Implied Move Support: Weekly range of $52.71-$54.03 puts $52 at the bottom of near-term expectations.
What Makes This Happen:
- Unexpected hawkish Fed surprise (dot plot shows zero 2026 cuts)
- Major bank guides lower on NIM pressure
- CRE writedowns accelerate at regional banks
- Broader market selloff drags financials down
LEAP Value at $52: The $49 strike would still be worth $3.00 intrinsic value. At current implied vol, the LEAP might trade at $3.50-4.00, close to breakeven or small loss.
Risk Mitigant: The $11M buyer has 9 months for the thesis to play out. A temporary dip to $52 doesn't kill the trade if XLF recovers by summer 2025.
💡 Trading Ideas
🛡️ Conservative: "Ride the Wave with Protection"
Strategy: Buy XLF shares + sell covered calls
Setup:
- Buy 100 shares of XLF at $53.29 = $5,329 capital
- Sell 1x April 2025 $55 covered call = collect ~$0.80-1.00 premium
Why This Works: You're copying the institutional bullish thesis but with downside protection from share ownership. The covered call generates income ($80-100) and caps your upside at $55 (3.2% gain + premium = ~5% total return in 4 months).
Risk/Reward:
- Max Gain: ~$250-270 if XLF hits $55 by April (4.7% return)
- Downside: You own shares, so you lose if XLF drops (but $53 gamma support should hold)
- Probability of Success: 60-65%
Best For: Investors who want financial sector exposure but can't stomach the volatility of straight call options.
⚖️ Balanced: "Follow the Smart Money"
Strategy: Buy a mini-LEAP spread
Setup:
- Buy 1x September 2025 $51 call (6 months out) = ~$3.00-3.50
- Sell 1x September 2025 $56 call = ~$1.50
- Net cost: ~$1.50-2.00 per contract ($150-200 total)
Why This Works: You're mimicking the institutional buyer's September expiration but at a better risk/reward by selling the $56 call to finance most of the cost. Your breakeven is around $52.50-53, and you make $5 max profit ($500) if XLF hits $56.
Risk/Reward:
- Max Gain: $300-350 if XLF hits $56+ (150-175% return)
- Max Loss: $150-200 (your net debit)
- Breakeven: ~$52.50-53.00
- Probability of Profit: 50-55%
Best For: Swing traders who want leveraged upside to the bank earnings catalyst but don't want to risk $11M!
🚀 Aggressive: "YOLO with the Whales"
Strategy: Buy near-term calls for the FOMC meeting pop
Setup:
- Buy 2x December 20 2025 $54 calls = ~$0.60-0.80 each ($120-160 total)
- Hold through December 10 FOMC meeting
Why This Works: You're betting the Fed delivers the expected cut AND the SEP/dot plot is dovish enough to push XLF through $54 resistance immediately. If financials rip on Wednesday afternoon, these could double or triple overnight.
Risk/Reward:
- Max Gain: Unlimited (but realistically 100-200% if XLF pops to $54.50-55)
- Max Loss: $120-160 (entire premium if XLF stays flat or drops)
- Breakeven: ~$54.60-54.80
- Probability of Profit: 35-40%
Best For: YOLO traders who want to make a quick high-risk bet on the FOMC catalyst. Set tight stops or be ready to lose the full premium!
Warning: This is pure gambling on Fed reaction. Only use money you're comfortable losing entirely!
⚠️ Risk Factors: What Could Go Wrong?
🏢 Commercial Real Estate Time Bomb
The Problem:
- Office CMBS delinquency hit record 11.8% in November 2025 - worse than the financial crisis per Wolf Street
- Multifamily CMBS delinquency soared to 7.1% - worst since December 2015
- 31% of all banks (1,374 institutions) are CRE-concentrated according to FDIC Risk Review 2025
Impact on XLF: Regional banks with heavy CRE exposure could face writedowns and earnings misses. While mega-caps like JPM and BAC are well-diversified, any systemic CRE crisis would hurt the entire sector.
Mitigation: XLF's top holdings (Berkshire, JPM, Visa, Mastercard) have minimal CRE exposure. The real risk is concentrated in smaller financial stocks within the fund.
📈 Fed Policy Uncertainty
The Problem: "Unusual public split within the Federal Open Market Committee" with recent dissents per Kiplinger. Wide divergence on 2026 outlook:
- 🔴 Some Fed members see four cuts in 2026
- 🟢 September dot plot median showed only one cut
- 📊 Market currently pricing 2-3 cuts
Impact on XLF: If the Fed surprises hawkish (zero cuts projected for 2026), bank stocks could sell off on fears of NIM compression and reduced loan demand.
Mitigation: Current NIM at 3.28% is already healthy and improving. Even with fewer cuts, banks can still benefit from deposit cost reductions.
💸 Massive Fund Outflows
The Problem: XLF has experienced significant redemptions:
- 5-day net flows: -$709.68M
- 1-month net flows: -$2B
- 3-month net flows: -$2.19B (Source: ETF Database)
Impact: Large outflows can create selling pressure as the fund needs to liquidate holdings to meet redemptions. This technical headwind could cap upside even if fundamentals improve.
Mitigation: Post-election, financial ETFs saw "robust inflows" according to iShares. The recent outflows may be profit-taking after the strong run, not a fundamental shift.
💳 Payment Processing Disruption
The Problem: Stablecoins transferred $27.6 trillion in 2024, surpassing Visa and Mastercard by 2-3x in Q4 alone per CryptoSlate
Impact on XLF: Visa (7.50% of fund) and Mastercard (6.07%) represent nearly 14% of XLF's holdings. If crypto payments go mainstream, traditional payment networks could lose market share and pricing power.
Mitigation: Both Visa and Mastercard are actively investing in blockchain and stablecoin infrastructure. They're positioning as facilitators of crypto transactions, not enemies of them.
⚖️ Basel III Implementation Risk
The Problem: While Trump administration is expected to delay/soften Basel III, any unexpected implementation of the original 16-25% capital increase would be devastating for bank profitability according to EY
Impact on XLF: Banks would need to raise capital, cut dividends, or reduce buybacks - all negative for stock prices.
Mitigation: Political winds strongly favor delay/revision. Fed Chair Powell testified in February 2025 about "rightsizing" regulatory frameworks per Oliver Wyman
🎯 The Bottom Line
Real talk: This $11M LEAP is a high-conviction institutional bet that the financial sector continues its dominant run through 2025 and into 2026. The setup is compelling:
✅ Timing is Perfect: Positioned right before FOMC decision, ahead of bank earnings, and during deregulation tailwinds ✅ Multiple Catalysts: Fed cuts, earnings beats, regulatory relief, capital returns - pick your poison! ✅ Technical Support: Gamma levels show strong $53 floor with limited downside risk ✅ Fundamental Strength: Banks just posted 50%+ earnings growth with expanding NIMs ✅ Political Tailwinds: Trump's deregulation agenda could unlock $100B+ in capital for buybacks
❌ Risks Exist: CRE exposure, fund outflows, Fed uncertainty, and stablecoin disruption are real concerns ❌ Near ATH: XLF at $53.29 is close to 52-week high of $54.50 - limited margin of safety ❌ Crowded Trade: Everyone knows about the Trump deregulation story - may be priced in
📋 Action Plan by Trader Type:
If You Own XLF Shares: ✅ HOLD and consider selling covered calls at $55-56 strikes to generate income while you wait for the next leg up. The $53 gamma support should protect your downside.
If You're Watching from the Sidelines: 👀 WAIT for the December 10 FOMC decision. If XLF dips to $52-52.50 on a hawkish surprise, that's your buy signal for shares or LEAPs. If it rips to $54.50+, wait for consolidation.
If You're Bearish on Financials: 🐻 This is NOT the trade for you. The setup is overwhelmingly bullish with too many tailwinds. If you want to bet against it, wait for a failed breakout above $55 or signs of earnings disappointment in April.
⏰ Mark Your Calendar:
- 📅 December 10, 2:00 PM ET: FOMC rate decision & SEP
- 📅 December 19: Monthly OPEX (implied range $52.43-$54.59)
- 📅 April 11-15, 2025: Major bank earnings bonanza
- 📅 September 18, 2026: LEAP expiration (282 days to play out!)
Final Thought: Someone just put $11 million on the line betting financials crush it for the next 9 months. They're not gambling - they're seeing something in the fundamental setup (improving NIMs, deregulation, capital returns) that justifies this massive bullish position. The question is: do you see it too? 🤔
⚠️ Disclaimer: Options trading involves substantial risk and is not suitable for all investors. This analysis is for educational purposes only and should not be considered investment advice. The $11M trade referenced is institutional activity - retail traders should size positions appropriately for their risk tolerance and account size. Past performance does not guarantee future results. Always do your own research and consider consulting a licensed financial advisor before making investment decisions.
🔗 Useful Links:
📊 Data Sources: All trade data verified from live options flow. Catalyst information compiled from financial news sources cited inline throughout the report. Analysis generated December 9, 2025.