🏦 XLF Massive $17.9M Bear Call Spread - Financials Face Q4 Earnings Gauntlet! 📊
📅 January 5, 2026 | 🔥 Unusual Activity Detected
🎯 The Quick Take
Someone just executed a $17.9M Bear Call Spread on XLF at 12:17:24 this morning, betting that the Financial sector will struggle to break above $58 before March 20th expiration. This sophisticated two-leg strategy sold 70,000 contracts of the $57 calls for $10M while buying 80,000 contracts of the $58 calls for $7.9M, collecting a net credit of $2.1M. With XLF trading at $56.18 after a +2.21% surge on January 5th and sitting at 52-week highs, this trader is betting the rally hits resistance just as major bank earnings begin January 13-15. Translation: Smart money is capping their upside expectations before the Q4 earnings gauntlet!
📊 ETF Overview
Financial Select Sector SPDR Fund (XLF) is the premier ETF for playing the U.S. financial sector:
- Net Assets (AUM): $51.87 billion (one of the largest sector ETFs)
- Market Cap: $54.5 billion
- Expense Ratio: 0.08% (ultra-low cost)
- Total Holdings: 81 financial companies
- Sector Focus: Banks, capital markets, insurance, consumer finance
- Current Price: $56.18 (near 52-week high of $56.21)
- YTD Return (2025): +14.87%
Top 5 Holdings:
- Berkshire Hathaway (BRK-B) - 12.33% (CEO transition to Greg Abel on Jan 1, 2026)
- JPMorgan Chase (JPM) - 11.26% (Q4 earnings Jan 13)
- Visa (V) - 7.43% (digital payments leader)
- Mastercard (MA) - 5.95% (AI Agent Pay partnership)
- Bank of America (BAC) - 4.78% (record NII expected)
💰 The Option Flow Breakdown
The Tape (January 5, 2026 @ 12:17:24):
| Date | Time | Symbol | Buy/Sell | Call/Put | Expiration | Strike | Volume | Premium | Order_Type | Strategy | Confidence | Z_Score | Z_Classification | Vol_OI_Ratio |
|---|---|---|---|---|---|---|---|---|---|---|---|---|---|---|
| 2026-01-05 | 12:17:24 | XLF | SELL | CALL | 2026-03-20 | $57 | 70,000 | $10.0M | STO | Bear Call Spread (Short Leg) | MEDIUM | 14.46 | EXTREMELY_UNUSUAL | 0.875 |
| 2026-01-05 | 12:17:24 | XLF | BUY | CALL | 2026-03-20 | $58 | 80,000 | $7.9M | BTO | Bear Call Spread (Long Leg) | MEDIUM | 72.88 | EXTREMELY_UNUSUAL | 4.444 |
🤓 What This Actually Means
This is a textbook Bear Call Spread - a defined-risk bearish strategy used by institutions to profit from limited upside or consolidation:
How the structure works:
- 📉 Sold 70,000 contracts of March 20 $57 calls for $10M ($1.43 per contract)
- 🛡️ Bought 80,000 contracts of March 20 $58 calls for $7.9M ($0.99 per contract)
- 💰 Net credit collected: $2.1M (this is the max profit)
- 📊 Current XLF price: $56.18 (1.4% below short strike)
- ⏰ Days to expiration: 74 days (expires March 20, 2026)
What's really happening here: This trader believes XLF will NOT rally above $57 (1.4% upside) by March 20th. They're willing to collect $2.1M in premium betting that the financial sector stalls out between now and Q1 earnings season. If XLF closes below $57 on March 20th, they keep the entire $2.1M credit. If XLF explodes above $58, they have capped losses at the $1 spread width.
The psychology: With financials already up 14.87% YTD and trading at 52-week highs just days before Q4 bank earnings (Jan 13-15), this trader sees limited upside. They expect:
- Earnings already priced in at current levels
- Profit-taking after the recent 2.21% surge
- Consolidation between $54-$57 range through March
- Overhead resistance at $57-$58 preventing further rallies
Unusual Score: 🔥 EXTREMELY UNUSUAL for both legs - The short $57 call leg (Z-score 14.46) and long $58 call leg (Z-score 72.88) are both unprecedented activity levels. The $58 calls saw volume 4.4x open interest, signaling fresh positioning rather than existing positions being closed. This happens only a few times per year for XLF.
Bear Call Spread 101 for retail traders:
- Max Profit: $2.1M if XLF stays below $57 at expiration (37% ROI on risk capital)
- Max Loss: ~$5.5M if XLF rallies above $58 (occurs when short calls assigned)
- Breakeven: ~$57.30 (short strike + net credit per spread)
- Probability of success: ~60-65% based on delta and current positioning
- Risk/Reward: Not favorable (risking $5.5M to make $2.1M), but this is likely a hedge or portfolio collar
📈 Technical Setup / Chart Check-Up
YTD Performance Chart
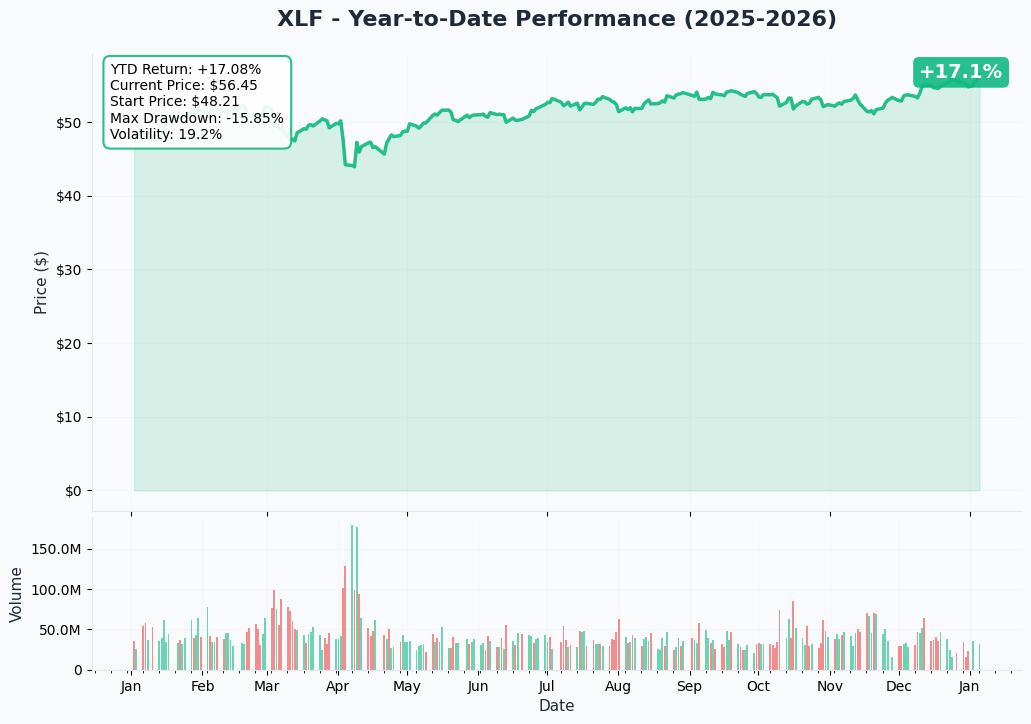
XLF is crushing it - up +14.87% YTD with current price at $56.18 and touching 52-week highs of $56.21 on January 5th. The chart tells a powerful financial sector comeback story:
Key observations:
- 🚀 Strong January start: Up +2.21% (+$1.22) on January 5th alone as Goldman Sachs surged 4.0%, Wells Fargo +2.1%, Bank of America +1.7%
- 📈 2025 performance: Full-year return of +14.87% driven by robust capital markets activity
- 🏆 Multi-year strength: 3-year average return of 20.1%, 5-year average of 19.2%
- 📊 52-week range: $42.21 - $56.21 (currently at upper bound)
- 💪 Momentum intact: Trading above all key moving averages
- ⚠️ Overbought risk: Extended rally leaves limited margin of safety
The surge to all-time highs reflects optimism around Q4 bank earnings (expecting ~40% profit growth YoY), favorable regulatory environment (Basel III Endgame expected to be capital-neutral), and strong M&A/capital markets activity driving investment banking revenues.
Gamma-Based Support & Resistance Analysis
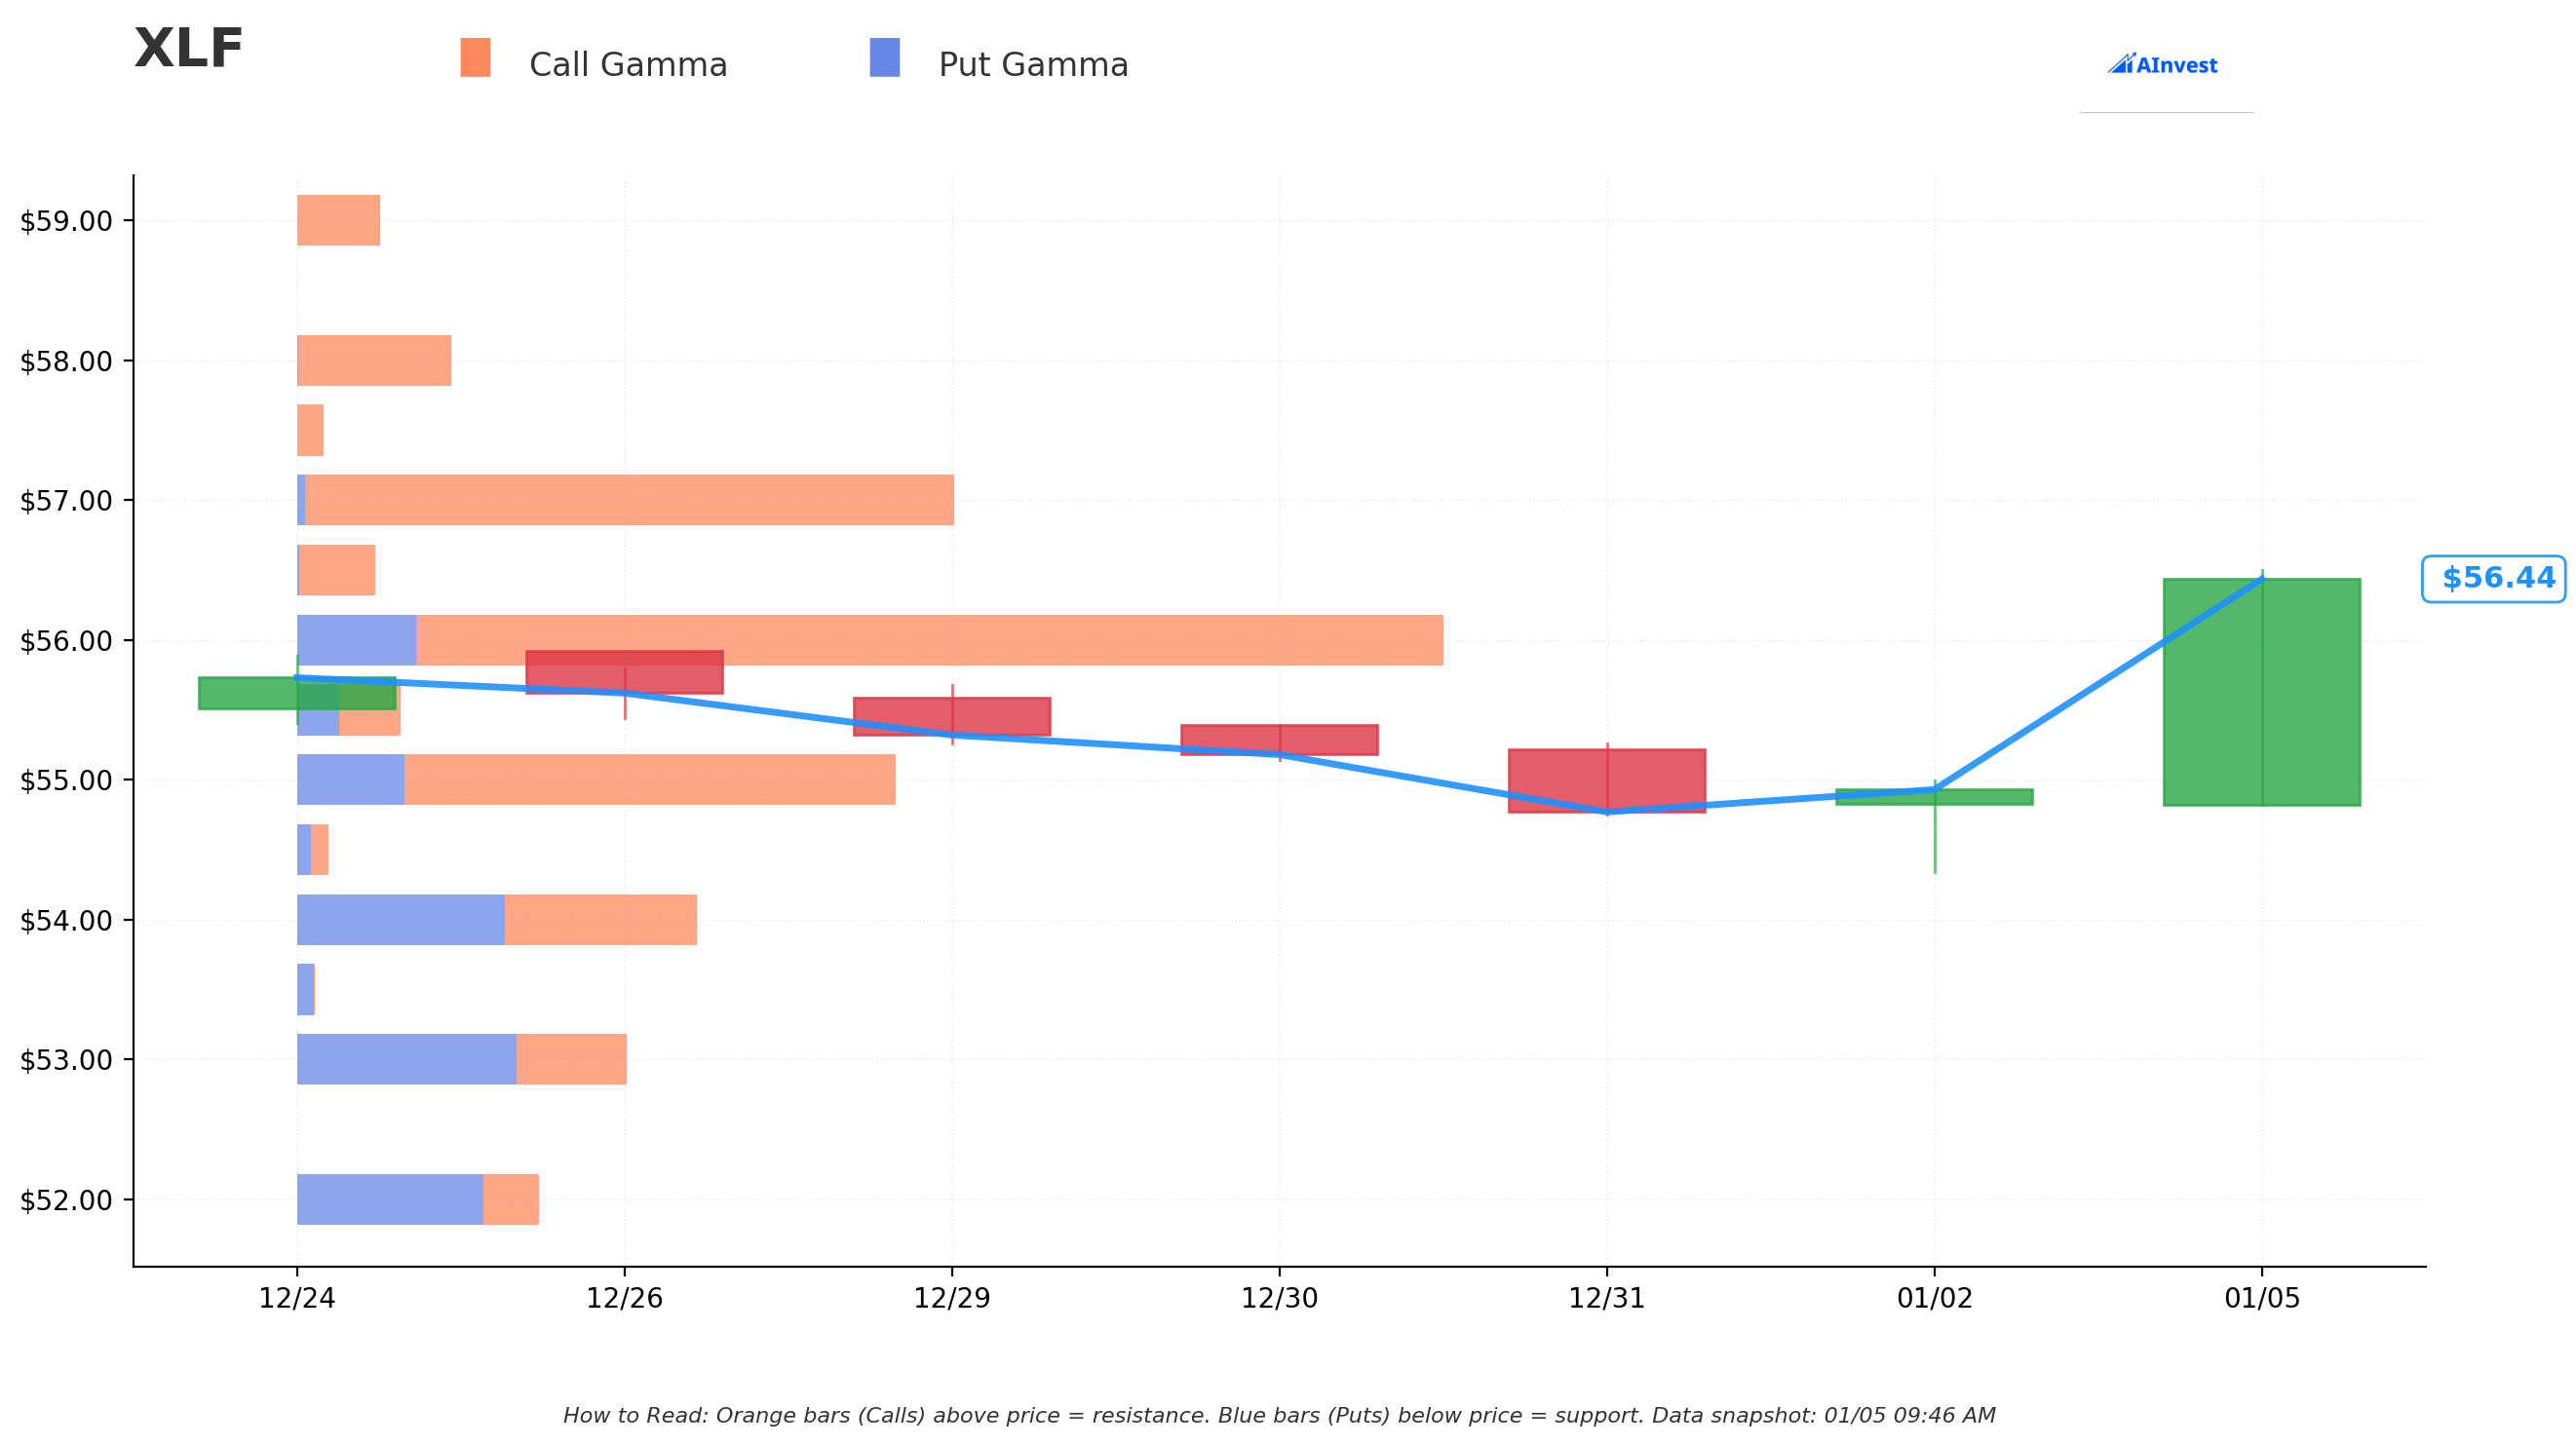
Current Price: $56.44
The gamma exposure map reveals critical price magnets and barriers:
🔵 Support Levels (Put Gamma Below Price):
- $56.00 - Immediate support with 211.5M total gamma (STRONGEST NEARBY FLOOR!)
- Net GEX: +167.7M (bullish bias)
- Distance: 0.78% below current price
- This is THE line in the sand for near-term support
- $55.00 - Secondary support at 110.5M gamma
- Net GEX: +71.0M
- Distance: 2.5% below current
- $54.00 - Deeper support with 72.9M gamma
- Net GEX: -3.4M (slight bearish tilt)
- Distance: 4.3% below current
- $53.00 - Major floor at 60.2M gamma
- Net GEX: -20.8M
- Distance: 6.1% below current
🟠 Resistance Levels (Call Gamma Above Price):
- $57.00 - CRITICAL CEILING with 121.3M gamma (WHERE SHORT CALLS ARE STRUCK!)
- Net GEX: +118.4M (massive call gamma wall)
- Distance: 1.0% above current price
- This is exactly where the Bear Call Spread short leg is positioned - NOT coincidental!
- $58.00 - Extended resistance at 28.4M gamma (LONG CALL PROTECTION LEVEL)
- Net GEX: +28.0M
- Distance: 2.8% above current
- $60.00 - Major ceiling zone with 48.5M gamma
- Net GEX: +48.3M
- Distance: 6.3% above current
What this means for traders:
The gamma data perfectly validates this Bear Call Spread strategy. The $57 strike has 121.3M gamma - the SINGLE LARGEST resistance level on the entire board. This creates natural selling pressure as XLF approaches $57, as market makers need to sell stock to hedge their delta exposure. The trader sold calls RIGHT at this massive gamma wall, expecting it to act as a ceiling.
Above $57, there's relatively light resistance at $58 (only 28.4M gamma) before hitting the next major wall at $60 (48.5M). But the spread buyer isn't worried about a breakout to $58-60 - they capped their risk by buying the $58 calls.
Net GEX Bias: Bullish overall (647.7M call gamma vs 326.3M put gamma) - positioning remains constructive, but the $57 gamma wall creates a near-term speed bump.
Implied Move Analysis
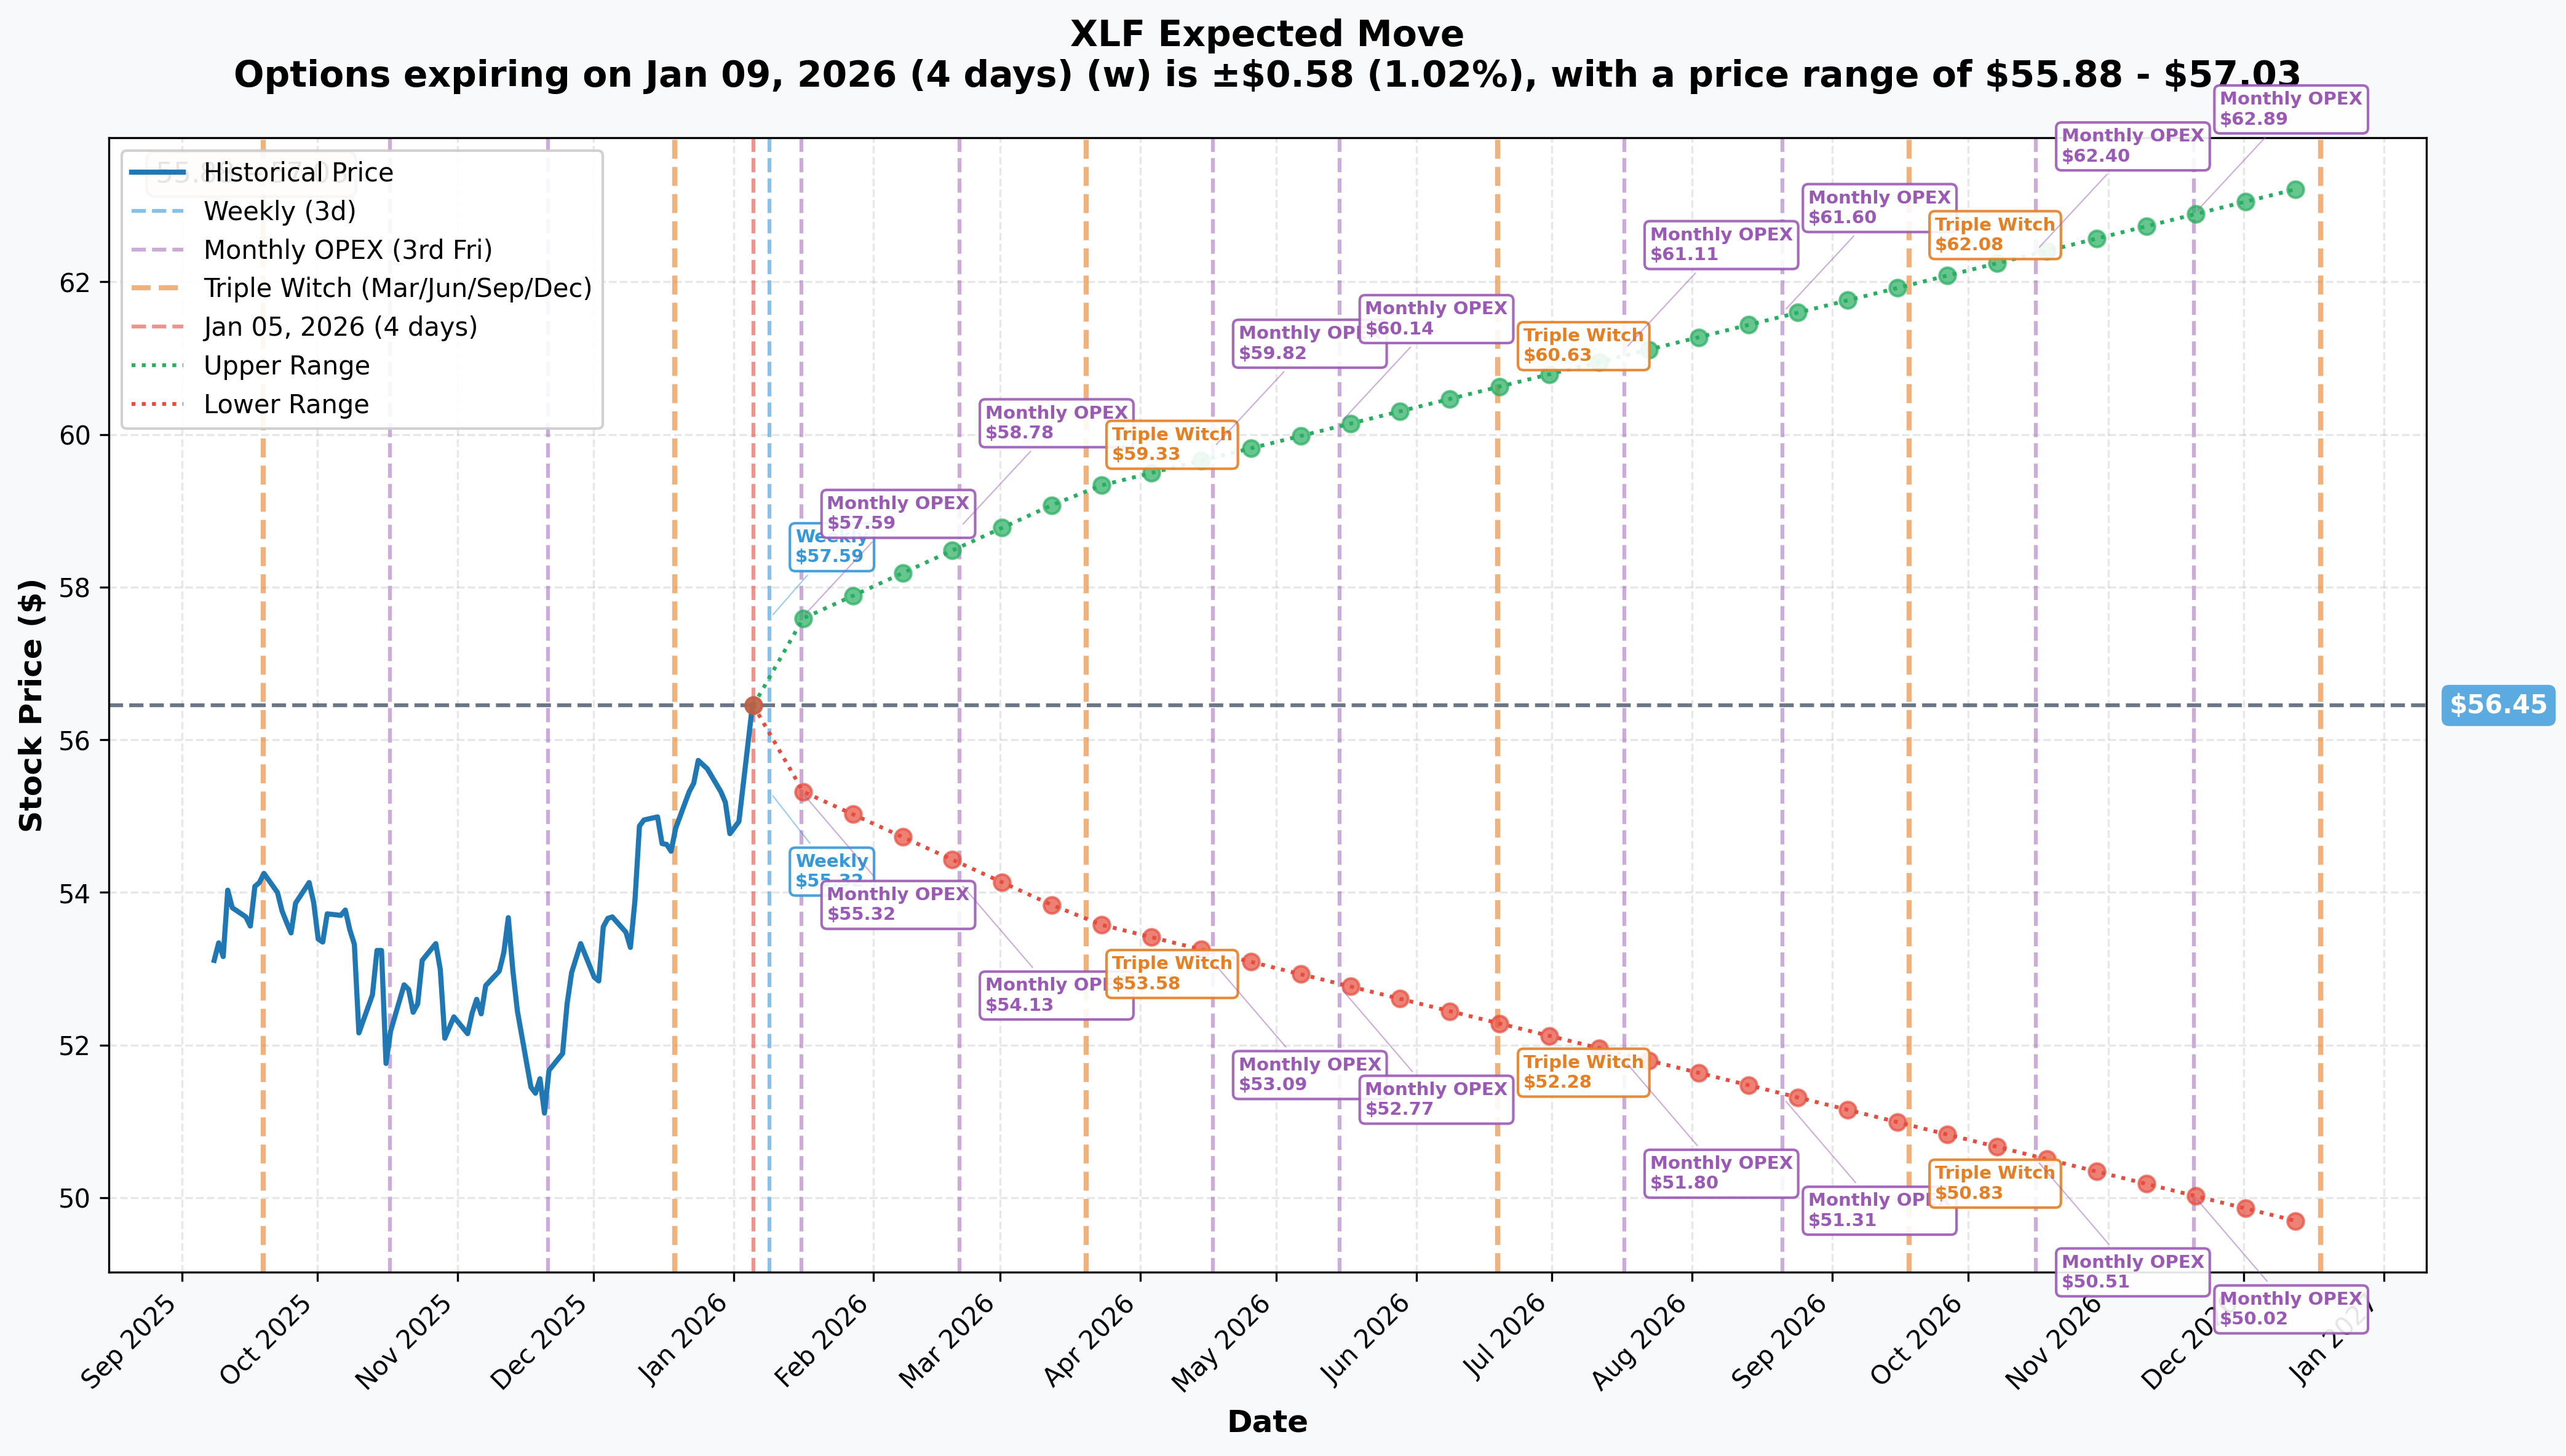
Options market pricing for upcoming expirations:
- 📅 Weekly (Jan 9 - 4 days): ±$0.58 (±1.02%) → Range: $55.88 - $57.03
- 📅 Monthly OPEX (Jan 16 - 11 days): ±$1.14 (±2.02%) → Range: $55.32 - $57.59
- 📅 Quarterly Triple Witch (Mar 20 - 74 days - THIS TRADE!): ±$2.84 (±5.03%) → Range: $53.62 - $59.29
- 📅 Yearly LEAPS (Dec 18 - 347 days): ±$6.84 (±12.12%) → Range: $49.61 - $63.30
Translation for regular folks:
The March 20th expiration (when this Bear Call Spread expires) has an upper range of $59.29 - just $1.29 above the $58 long call protection level. The market is pricing only a 5% move over the next 74 days, suggesting consolidation rather than explosive upside.
Key insight: The $57 short call strike sits comfortably within the implied move range ($53.62 - $59.29), giving the spread a high probability of success. Even at the upper end of the expected range ($59.29), the spread's losses would be capped and manageable.
The weekly implied move of just 1.02% ($0.58) shows the market expects XLF to trade quietly through January 9th - likely consolidating ahead of JPMorgan's earnings on January 13th.
🎪 Catalysts
🔥 Immediate Catalysts (Next 2 Weeks)
Q4 2025 Bank Earnings Season (January 13-15, 2026) 📊
The BIGGEST catalyst for XLF is the start of Q4 bank earnings, which begins in just 8 DAYS. This is make-or-break for the financial sector thesis:
January 13 (Monday) - JPMorgan Chase (JPM - 11.26% of XLF)
- ⏰ Report time: 7:00 AM ET
- 💰 EPS estimate: $4.94
- 🎯 Key metrics: NII guidance Q4 ~$23.5B, investment banking fees up low single digits YoY, markets revenue up low-teens
- 📊 Sets the tone for entire sector as first major bank reporter
January 14 (Tuesday) - The Big Four
- Wells Fargo (WFC - 3.60% of XLF) - 7:00 AM ET
- First full quarter post-asset cap removal
- Watching for balance sheet growth and expanded lending capacity
- Bank of America (BAC - 4.78% of XLF) - Pre-market
- Expecting record NII in 2025, Q4 NII guidance $15.6-$15.7B (up 8% YoY)
- CEO Moynihan bullish on NII trajectory
- Citigroup (C - 2.50% of XLF) - Pre-market
- $1.2B pretax loss from Russia exit (~$0.61/share impact)
- Transaction close expected H1 2026
January 15 (Wednesday) - Goldman Sachs (GS - 3.27% of XLF)
- ⏰ Report time: 7:30 AM ET
- 💰 EPS estimate: $11.52-$11.57, Revenue: $14.42-$14.44B
- 🚀 M&A boom beneficiary - investment banking revenues up 15% YoY through 9M 2025
Consensus expectations: Industry profits projected to climb ~40% in Q4 driven by:
- Strong capital markets activity (M&A volume up 8% YoY, deal value surged 146%)
- Stabilizing credit quality (provisions down 4.1% YoY, net charge-offs down 8.3% YoY)
- Investment banking fee resurgence
- Record NII for some banks (especially BAC)
Why this matters for the Bear Call Spread: If earnings disappoint OR guidance is conservative, XLF could pull back from $56 to $54-55 range, helping the spread profit. Even if earnings beat, the "sell the news" dynamic at 52-week highs could prevent sustained rallies above $57. The trader positioned for exactly this scenario.
🚀 Near-Term Catalysts (Q1 2026)
Federal Reserve Policy (January 27-28 FOMC Meeting) 🏛️
The Fed is expected to hold rates steady at 3.50%-3.75% after cutting 175 basis points since September 2024:
- 📊 December dot plot: Median projection of 1 cut in 2026
- 💰 Market pricing: 2 quarter-point cuts expected in 2026
- 🎯 Goldman Sachs forecast: 2 cuts (March, June) to 3.00-3.25%
- ⚠️ Hawkish risk: New Fed presidents rotating onto FOMC may resist cuts
Impact on financials:
- ✅ Positive: Further rate cuts support NII growth as funding costs decline
- ✅ Positive: Lower rates boost loan demand and economic activity
- ⚠️ Risk: If Fed holds longer than expected, could pressure margins
- 📊 Bank of America projects +5-7% NII growth in 2026 from fixed asset repricing
Basel III Endgame Final Rule (Q1 2026) 📜
Expected "roughly capital neutral" proposal in early 2026:
- 💰 Could free up ~$200B in excess capital for deployment
- 🎯 Favorable to Category I-III banks (JPM, BAC, WFC, C, GS)
- 📈 Potential uses: loan growth, buybacks, dividends, M&A
- 🚀 Eliminates major regulatory overhang that's constrained capital returns
This is a major bullish catalyst - but it's already partially priced in at current levels near $56. The Bear Call Spread assumes this good news won't push XLF materially above $57.
Visa & Mastercard Earnings (~January 29, 2026) 💳
Payment networks (15.38% of XLF combined) report Q1 FY26 results:
- Visa (V - 7.43% weight):
- Current price $346.48, analyst target $398.88
- Key: Digital payment volumes, cross-border trends
- Mastercard (MA - 5.95% weight):
⚠️ Risk Catalysts (Negative)
Berkshire Hathaway Leadership Transition (12.33% of XLF) 🏢
Warren Buffett stepped down as CEO on January 1, 2026; Greg Abel took over:
- 📊 Post-Buffett uncertainty for largest XLF holding
- 💰 Record $381.7B cash position ($305B+ in T-bills) - capital deployment decisions critical
- ⚠️ Analyst consensus rating: Sell (contrarian indicator given Buffett legacy)
- 🎯 2026 price forecast: $525 (H1) to $541 (year-end)
Tariff & Stagflation Concerns 🌍
Tariff-induced inflation materializing with CPI at 2.7% in June 2025 (up from 2.4%):
- ⚠️ Supreme Court hearing arguments challenging Trump's tariff authority
- 📉 High inflation + slowing economy = stagflation risk
- 💔 Lending margins narrow as Fed cuts rates
- 🔻 Loan losses increase if consumers/businesses struggle
- 🌪️ Financials highly cyclical and vulnerable in contractions
Credit Deterioration Risk 💳
While current credit quality is strong, warning signs emerging:
- ⚠️ Consumer confidence weakened throughout 2025
- 📚 Student loan delinquencies may rise
- 📈 90+ day serious delinquencies: slight uptick expected in 2026
- 🏢 Private credit quality likely to deteriorate in 2026, borrowers under covenant relief expanded to 10%
Digital Payment Disruption 💻
European fintechs challenging Visa/Mastercard with instant bank-to-bank payments:
- 🌍 Stablecoin disruption could affect deposit flows
- ⚡ Banks facing potential tighter liquidity from payment stablecoins
- 💸 European critique: "too slow, too expensive, too American"
🎲 Price Targets & Probabilities
Using gamma levels, implied move data, and upcoming catalysts, here are scenarios through March 20th expiration:
📈 Bull Case (30% probability)
Target: $58-$60 (SPREAD LOSES, BUT CAPPED)
How we get there:
- 💪 Bank earnings CRUSH with Q4 profits up 50%+ YoY (above 40% consensus)
- 🚀 JPMorgan, Goldman, Bank of America all beat and raise guidance
- 📜 Basel III Endgame announced as highly favorable (even better than "capital neutral")
- 💰 Major capital return announcements (massive buybacks, special dividends)
- 🏛️ Fed signals 3 cuts in 2026 (more dovish than expected)
- 📊 Credit quality continues to improve (loan loss provisions drop further)
- 🌐 M&A boom accelerates beyond expectations
Key metrics needed:
- JPM NII exceeding $24B (above $23.5B guidance)
- Goldman Sachs investment banking fees up 20%+ YoY
- Wells Fargo showing strong loan growth post-asset cap removal
- No major credit warnings from any large bank
Why spread loses but is protected: If XLF rallies to $58-60, the short $57 calls get assigned but the long $58 calls cap losses. Maximum loss on the spread is the $1 width between strikes ($1 × 10,000 net contracts difference = $10M potential max loss after accounting for $2.1M credit collected). This is why sophisticated traders use defined-risk spreads - they can be WRONG on direction but still survive.
Probability assessment: Only 30% because it requires almost PERFECT earnings season with XLF already at 52-week highs. The massive gamma resistance at $57 (121.3M) creates mechanical headwinds. Even strong earnings may not be enough to sustain breakout above this level.
🎯 Base Case (50% probability)
Target: $54-$57 range (SPREAD PROFITS IN FULL)
Most likely scenario:
- ✅ Solid bank earnings meeting or slightly beating consensus
- 📱 JPMorgan delivers in-line Q4 results, guidance conservative
- ⚖️ Mixed results across banks (some beat, some disappoint)
- 💼 Investment banking revenues strong but already priced in at current levels
- 🎯 Basel III clarity positive but not game-changing
- 🏛️ Fed holds rates in January, signals gradual approach to cuts
- 📊 "Sell the news" dynamics after earnings - profit-taking at highs
- 🔄 XLF consolidates between $54-$57, respecting gamma support/resistance
- 💤 Volatility normalizes post-earnings
This is the spread's IDEAL scenario: XLF trades sideways or drifts slightly lower through March 20th, staying below $57. The $2.1M credit collected becomes pure profit. The trader structured this expecting consolidation after the recent 14.87% YTD rally - not collapse, just limited upside.
Gamma dynamics support this:
- $56 support (211.5M gamma) prevents significant downside
- $57 resistance (121.3M gamma) caps upside rallies
- Trading range: $54-$57 for next 10 weeks
- Implied move upper bound of $59.29 keeps risk manageable
Why 50% probability: XLF at technical inflection point after strong rally. Earnings are a coin flip (beat vs miss), but even beats may not justify further multiple expansion at 19.20x P/E. Most institutions will take profits into strength, creating natural ceiling around $57.
Spread P&L in Base Case:
- XLF stays below $57 through March 20: $2.1M profit (100% return on credit)
- XLF drifts to $54-56: $2.1M profit
- Perfect execution of defined-risk bullish thesis
📉 Bear Case (20% probability)
Target: $50-$54 (SPREAD PROFITS EVEN MORE)
What could go wrong:
- 😰 Bank earnings disappoint - one or more major banks miss estimates
- 🚨 Credit quality warnings emerge (rising delinquencies, higher provisions)
- ⏰ Conservative guidance citing economic uncertainty
- 🇨🇳 Tariff-induced stagflation concerns intensify
- 💸 Fed signals NO cuts in H1 2026 (hawkish hold)
- 📉 Broader market selloff drags financials lower
- 🏢 Berkshire Hathaway struggles with post-Buffett transition
- 🌍 Geopolitical shock (escalation in trade tensions)
- 💔 Break below $56 gamma support triggers cascade to $54, then $52
Critical support levels:
- 🛡️ $56: Immediate floor (211.5M gamma) - break is bearish
- 🛡️ $55: Secondary support (110.5M gamma)
- 🛡️ $54: Major floor (72.9M gamma) - likely holds here
- 🛡️ $53: Extended support (60.2M gamma)
Spread performance in Bear Case: Even BETTER than base case! If XLF drops to $50-54, both the short $57 calls and long $58 calls expire worthless. Spread keeps the entire $2.1M credit with zero risk. This is the beauty of Bear Call Spreads - they profit from downside, sideways, or limited upside movement.
Probability assessment: Only 20% because XLF fundamentals remain solid (strong NII growth, improving credit, M&A tailwinds, regulatory relief). Would require multiple negative catalysts to break support. The strong gamma floor at $56 (211.5M) provides technical backstop.
💡 Trading Ideas
🛡️ Conservative: Follow the Smart Money - Sell OTM Calls
Play: Sell out-of-the-money covered calls or cash-secured puts after earnings volatility settles
Why this works:
- ⏰ January 13-15 earnings create binary event risk - wait for volatility to settle
- 💸 Implied volatility will crush 30-40% post-earnings - sell premium AFTER the crush
- 📊 $57 gamma wall (121.3M) provides natural resistance - selling calls here is statistically favorable
- 🎯 Collect premium betting on consolidation rather than breakout
- 🛡️ If you own XLF shares, covered calls reduce cost basis and limit upside (acceptable trade-off at 52-week highs)
Structure example (adjust after earnings):
- Own 1,000 shares of XLF at $56
- Sell 10 contracts of March 20 $57 calls for ~$1.30-1.50 credit
- Collect $1,300-1,500 in premium
- If XLF stays below $57, keep shares + premium (2.3-2.7% income in 10 weeks)
- If XLF rallies above $57, shares get called away at $57 (still profitable)
Action plan:
- 👀 Wait until January 16-17 (after earnings volatility settles)
- 🎯 Only sell if XLF trading $55-56 range (gives room to work)
- ✅ Strike selection: $57-$58 range (at/above gamma resistance)
- 📊 Monitor: If XLF breaks $57, buy back calls to avoid assignment
Risk level: Low (covered calls on owned shares) | Skill level: Beginner-friendly
Expected outcome: Generate 2-4% quarterly income from premium collection. Worst case: shares called away at profit.
⚖️ Balanced: Post-Earnings Bull Put Spread (Defined Risk)
Play: After earnings, sell bull put spread targeting gamma support
Structure: Sell $55 puts, Buy $54 puts (March 20 expiration)
Why this works:
- 🎢 IV crush after earnings makes put spreads more attractive to sell
- 📊 Defined risk spread ($1 wide = $100 max risk per spread)
- 🎯 Targets strong gamma support at $55 (110.5M) and $54 (72.9M)
- 🤝 Betting WITH the trend (financials in uptrend, just limiting wild rally expectations)
- ⏰ 74 days to expiration gives time thesis to work
- 🛡️ Collecting premium betting XLF stays above $55 (only 2.5% downside cushion needed)
Estimated P&L (adjust after seeing post-earnings IV):
- 💰 Collect ~$0.30-0.40 credit per spread
- 📈 Max profit: $30-40 per spread if XLF above $55 at March expiration
- 📉 Max loss: $60-70 per spread if XLF below $54
- 🎯 Breakeven: ~$54.60-54.70
- 📊 Risk/Reward: ~2:1 (risking $60-70 to make $30-40)
Entry timing:
- ⏰ Wait until January 16-17 (post-earnings IV collapse)
- 🎯 Only enter if XLF trading above $56 (ensures support levels are below)
- ❌ Skip if XLF already below $55 (spread too close to danger zone)
Position sizing:
- Risk only 3-5% of portfolio
- Example: 10 contracts = $600-700 max risk, $300-400 max profit
Risk level: Moderate (defined risk, bullish directional) | Skill level: Intermediate
Expected outcome: Profit from XLF consolidation above $55. If wrong and XLF drops below $54, losses capped and defined.
🚀 Aggressive: Reverse the Bear Call Spread - Go Bull Call Spread (CONTRARIAN)
Play: Fade the institutional trade - buy bull call spread betting on earnings breakout
Structure: Buy $56 calls, Sell $58 calls (March 20 expiration)
Contrarian thesis:
- 💥 Institutions may be WRONG - bank earnings could massively beat
- 🎰 Betting the $57 gamma wall breaks on exceptional earnings and Basel III clarity
- 📊 If JPM, GS, BAC all crush earnings AND raise guidance, $57-60 rally possible
- 🚀 Investment banking profits up 40% in Q4 could drive multiple expansion
- ⚡ Major buyback announcements from capital release could ignite rally
- 📈 $200B excess capital deployment is REAL catalyst if Basel III favorable
Why this could work (SERIOUS RISKS):
- ✅ Defined risk: Only lose debit paid (unlike Bear Call Spread which has limited profit)
- 🎯 Asymmetric reward: $2 wide spread offers 3-5x return if XLF rallies to $58+
- 📊 Catalyst-rich: Multiple shots on goal (earnings, Fed, Basel III)
- 🤔 Contrarian edge: If institutions are wrong, retail fading them profits
Why this could blow up:
- 💸 Fighting $57 gamma wall (121.3M) - massive mechanical resistance
- ⏰ Buying BEFORE earnings exposes to IV crush (even if right on direction)
- 😱 Institutions rarely wrong on structures this large
- 📉 $56 entry means already at-the-money - need immediate movement
- 🎢 Need XLF to rally 3.5% just to reach $58 (upper spread strike)
Estimated P&L:
- 💰 Cost: ~$0.80-1.00 debit per spread (buy AFTER earnings for cheaper entry)
- 📈 Profit scenario: XLF rallies to $58+ by March = $1.00-1.20 gain (100-150% ROI)
- 🚀 Home run: XLF breaks to $60 = $2.00 gain (200% ROI)
- 📉 Loss scenario: XLF stays below $56 = lose entire $0.80-1.00 debit (100% loss)
Breakeven: ~$56.80-57.00 (need 1.5% rally)
CRITICAL WARNING - DO NOT attempt unless you:
- ✅ Believe bank earnings will SIGNIFICANTLY beat consensus
- ✅ Can afford to lose ENTIRE debit (real possibility if wrong)
- ✅ Understand you're betting AGAINST sophisticated institutional positioning
- ✅ Have conviction on Basel III being MORE favorable than expected
- ⏰ Plan to close position early if XLF stalls at $57 (don't wait for expiration)
Entry timing:
- ⏰ WAIT until after January 13-15 earnings (don't buy into IV)
- 🎯 Only enter if earnings beat AND XLF holds $56+ (confirm thesis)
- ❌ If earnings disappoint, skip this trade entirely
Position sizing:
- Risk only 2-3% of portfolio (this is pure speculation)
- Example: 5 contracts = $400-500 max risk
Risk level: EXTREME (fighting institutional positioning and gamma resistance) | Skill level: Advanced only
Probability of profit: ~35-40% (lower than 50% due to gamma headwinds and institutional positioning against you)
⚠️ Risk Factors
Don't get caught by these potential landmines:
-
⏰ Bank earnings in 8 days (Jan 13-15): Binary events that could gap XLF 3-5% either direction. JPMorgan sets tone Jan 13, followed by Wells Fargo, Bank of America, Citigroup Jan 14, and Goldman Sachs Jan 15. Consensus expects ~40% Q4 profit growth - bar is HIGH. Any disappointment in NII guidance, credit quality, or M&A commentary could trigger selloff from 52-week highs.
-
💸 XLF at 52-week highs with limited margin of safety: Trading at $56.18 vs 52-week high of $56.21 (99.95% of range). Already up 14.87% YTD after strong 2025 (+14.87%). Valuation at 19.20x P/E is reasonable but not cheap. Zero cushion for errors - any negative surprise magnified. Overbought technically with RSI likely elevated.
-
🏢 Berkshire Hathaway leadership transition (12.33% of XLF): Warren Buffett stepped down Jan 1, Greg Abel took over. Largest XLF holding facing post-Buffett uncertainty. $381.7B cash position ($305B in T-bills) creates capital deployment questions. Any stumbles or major portfolio shifts could weigh on XLF. Analyst consensus: Sell (ominous).
-
🌍 Tariff-induced stagflation scenario: Inflation at 2.7% (up from 2.4%), Supreme Court hearing Trump tariff authority challenge. High inflation + slowing economy = lending margin compression + rising loan losses. Financials highly cyclical - vulnerable if economy contracts. Consumer confidence weakened in 2025.
-
🏛️ Fed policy uncertainty: Powell's final meetings before May 2026 term expiration. New Fed chair nomination expected early January. Hawkish FOMC rotation (Cleveland Fed's Hammack opposes cuts). If Fed holds rates longer than expected or new chair is hawkish, could pressure NII growth assumptions and financials.
-
💳 Credit deterioration warning signs: While current metrics strong (provisions -4.1% YoY, NCOs -8.3% YoY), leading indicators show risk: consumer confidence weak, private credit quality deteriorating, 10% of borrowers under covenant relief, student loan delinquencies may rise. 2026 could see uptick in 90+ day delinquencies.
-
📜 Basel III Endgame uncertainty: While expected to be "roughly capital neutral" in Q1 2026, final rule timing and content not confirmed. Political/regulatory shifts could affect implementation. Any disappointment vs "capital neutral" expectation would hit stocks hard. International regulatory fragmentation concerns.
-
🇨🇳 Citigroup Russia exit loss (2.50% of XLF): $1.2B pretax loss in Q4 2025 (~$0.61/share impact) from exiting Russian operations. Transaction close expected H1 2026. Overhang on Citi weighs on XLF.
-
💻 Payment network disruption risk (15.38% of XLF): European fintechs challenging Visa/Mastercard with instant bank-to-bank payments. Stablecoin adoption could affect deposit flows and payment economics. Visa/Mastercard criticized as "too slow, too expensive, too American" - structural threat to payment duopoly.
-
📊 $57 gamma resistance wall (121.3M): Massive call gamma at exactly where Bear Call Spread short leg positioned. Creates mechanical selling pressure as XLF approaches $57 - market makers hedge by selling stock. This technical ceiling difficult to break without sustained buying. Institutions clearly positioned AGAINST breakout above $57.
-
🎰 Massive institutional bet signals caution: $17.9M Bear Call Spread with Z-scores of 14.46 (short leg) and 72.88 (long leg) = EXTREMELY UNUSUAL activity. When sophisticated players structure defined-risk bearish positions at 52-week highs just before earnings, it's a major warning flag. They see asymmetric risk to downside despite bullish narrative.
-
🌪️ Macro recession risk: If economy weakens in 2026, even strong bank fundamentals won't save stocks. Financial sector beta of 0.98 means moves with market. Commercial real estate exposure, consumer credit stress, small business lending vulnerabilities all create tail risks.
🎯 The Bottom Line
Real talk: Someone just structured a $17.9M Bear Call Spread betting XLF won't break above $57 through March 20th - even with Q4 bank earnings, Basel III clarity, and Fed rate cuts on deck. This isn't a bearish crash bet; it's a sophisticated bet on CONSOLIDATION at 52-week highs after a strong 14.87% YTD rally.
What this trade tells us:
- 🎯 Upside skepticism: The $57 short call strike sits RIGHT at the massive 121.3M gamma resistance wall - trader expects this ceiling to hold
- 💰 Risk-defined intelligence: By buying the $58 calls for protection, they're not predicting disaster - just limiting wild rally potential
- ⚖️ Timing precision: Structured 8 days before JPMorgan earnings (Jan 13) shows they expect "sell the news" dynamics even if results are good
- 📊 Consolidation thesis: Betting on $54-$57 trading range for next 74 days - sideways to slightly down, not crash
- ⏰ Catalyst awareness: March 20 expiration captures earnings, Fed meeting (Jan 27-28), Basel III announcement, and Visa/Mastercard results
This is NOT a "sell all financials" signal - it's a "the easy money has been made, don't chase here" signal.
If you own XLF or financial stocks:
- ✅ Consider trimming 20-30% at $56+ levels to lock in YTD gains and reduce risk into earnings
- 📊 If holding through earnings, set mental stop at $55 (gamma support) to protect remaining position
- ⏰ Don't get greedy - up 14.87% YTD is excellent. Protecting profits is smart.
- 🎯 If bank earnings massively beat AND XLF breaks $58, could re-add at higher levels with confirmation
- 🛡️ Consider selling covered calls at $57-$58 strikes to collect premium (copy this trade's short leg on smaller scale)
If you're watching from sidelines:
- ⏰ January 13-15 bank earnings are the moment of truth - DO NOT enter before these binary events
- 🎯 Post-earnings pullback to $53-$55 would be excellent entry (gamma support zone with 5-10% margin of safety)
- 📈 Looking for confirmation of: Strong NII growth, credit quality holding firm, investment banking fees surging, capital return plans
- 🚀 Longer-term (6-12 months), $200B excess capital deployment from Basel III is legitimate catalyst for sustained rally
- ⚠️ Current valuation (19.20x P/E) at 52-week highs leaves zero margin for error - wait for better entry
If you're bullish and want to fade this trade:
- 🎯 Wait until after earnings to assess if banks truly delivered 40% Q4 profit growth
- 📊 Need confirmation: JPM NII exceeding guidance, Goldman M&A fees up 20%+, Wells Fargo loan growth post-cap removal
- ⚠️ Fighting $57 gamma wall (121.3M) AND institutional positioning is difficult - need strong catalyst to overcome
- 📈 Bull call spreads ($56/$58) offer defined-risk way to bet on breakout, but ONLY after earnings clear
- ⏰ Timing critical: Enter too early and IV crush kills you even if direction right
Mark your calendar - Key dates:
- 📅 January 9 (Thu) - U.S. Jobs Report (consumer spending indicator)
- 📅 January 13 (Mon) - JPMorgan Q4 earnings, sets sector tone
- 📅 January 14 (Tue) - Wells Fargo, Bank of America, Citigroup Q4 earnings
- 📅 January 15 (Wed) - Goldman Sachs Q4 earnings (investment banking bellwether)
- 📅 January 27-28 - FOMC Meeting (rate decision, Powell final meetings before May exit)
- 📅 ~January 29 - Visa, Mastercard Q1 FY26 earnings (payment volume trends)
- 📅 Q1 2026 - Basel III Endgame final rule expected
- 📅 March 20 (Fri) - Quarterly OPEX, Bear Call Spread expiration
- 📅 May 2026 - Jerome Powell Fed chair term expires, Trump nominee takes over
- 📅 H1 2026 - Citigroup Russia exit closes
Final verdict:
XLF's financial sector fundamentals remain solid - strong NII growth trajectories, robust M&A/capital markets activity, improving credit quality, and favorable regulatory environment create multi-quarter tailwinds.
BUT, at $56.18 (52-week highs) after +14.87% YTD with 19.20x P/E, the risk/reward is NO LONGER favorable for aggressive new positioning just 8 days before critical earnings. The $17.9M Bear Call Spread with Z-scores of 14.46 and 72.88 (EXTREMELY UNUSUAL) is a CLEAR signal: smart money is capping upside expectations and derisking at the peak.
The $57 gamma wall (121.3M) provides technical resistance that aligns with institutional skepticism. Even strong earnings may not sustain breakout above this level given profit-taking dynamics.
Be patient. Let earnings clear (Jan 13-15). Look for pullbacks to $53-$55 gamma support zone for better entries. The financial sector bull market will still be here in 2-3 weeks, and you'll sleep better paying $54 instead of $56.
The Bear Call Spread structure teaches us wisdom: define your risks, cap your expectations at extended levels, and profit from consolidation rather than chasing parabolic moves. That's how institutions protect capital.
This is a marathon, not a sprint. Manage risk intelligently. 💪
Disclaimer: Options trading involves substantial risk of loss and is not suitable for all investors. This analysis is for educational purposes only and not financial advice. Past performance doesn't guarantee future results. Bear Call Spreads are advanced strategies with limited profit potential and significant risk if the underlying rallies above the short strike. The EXTREMELY UNUSUAL Z-scores (14.46 and 72.88) reflect this trade's size relative to recent XLF history - they do not imply the trade will be profitable or that you should replicate it. Bank earnings create binary event risk with potential for 3-5% gaps either direction. Always do your own research and consider consulting a licensed financial advisor before trading.
About Financial Select Sector SPDR Fund: The Financial Select Sector SPDR Fund (XLF) tracks the Financial Select Sector Index, providing exposure to companies in the Financials sector including banks, capital markets firms, insurance companies, and consumer finance, with $51.87 billion in assets under management and an ultra-low 0.08% expense ratio.