🏭 XLI Industrial Sector ETF - $5M Put Closing Signals Bullish Positioning! 🚀
📅 December 2, 2025 | 🔥 Unusual Activity Detected
🎯 The Quick Take
Smart money just closed out a $5 MILLION bearish put position on the Industrial Select Sector SPDR Fund (XLI) with a March 2026 expiration! This massive 40,000-contract buy-to-close at the $135 strike represents a sophisticated trader EXITING downside protection, signaling confidence in the ongoing sector rotation from tech to industrials. With XLI up +17.7% YTD at $152.29 and riding strong earnings momentum from top holdings like GE Aerospace (+44% EPS growth) and aerospace/defense tailwinds, this unusual trade suggests institutions are getting more bullish on industrials through Q1 2026.
📊 ETF Overview
Industrial Select Sector SPDR Fund (XLI) provides targeted exposure to the industrial sector of the S&P 500:
- Assets Under Management: $23.86 Billion
- Exchange: NYSE Arca
- Current Price: $152.29 (near 52-week high of $156.99)
- Expense Ratio: 0.08% (lowest fee quintile per Morningstar)
- Sector Composition: 90.83% Industrials, 8.78% Technology, 0.39% Consumer Cyclical
- Top 3 Holdings: GE Aerospace (6.81%), Caterpillar (5.66%), RTX Corporation (5.11%) - representing 17.5% of fund
- Yield: 1.38%
- Valuation: P/E Ratio (TTM) 26.69
XLI tracks 15 industrial sub-sectors including aerospace, defense, machinery, transportation, construction, and engineering - essentially providing diversified exposure to the backbone of the American economy.
💰 The Option Flow Breakdown
The Tape (December 2, 2025 @ 10:31:24):
| Time | Symbol | Buy/Sell | Call/Put | Expiration | Premium | Strike | Volume | OI | Size | Spot | Option Price | Option Symbol |
|---|---|---|---|---|---|---|---|---|---|---|---|---|
| 10:31:24 | XLI | BUY | PUT | 2026-03-20 | $5M | $135 | 40K | 35K | 36,000 | $151.90 | $1.39 | XLI 135P 03/20 |
🤓 What This Actually Means
This is a buy-to-close transaction on a previously established short put position - NOT a new bearish bet! Here's what went down:
- 💸 Closing premium paid: $5M ($1.39 per contract × 40,000 contracts × 100 shares)
- 🛡️ Strike closed: $135 put (11.1% below current price of $152)
- ⏰ Time to expiration: 108 days (March 20, 2026 quarterly expiration)
- 📊 Massive size: 40,000 contracts represents 4 million shares worth ~$608M notional exposure
- 🔄 Volume vs OI: 40K volume against 35K open interest = major position unwinding
- 📈 Bullish implication: Trader EXITING downside protection = increasing confidence in upside
What's really happening here:
This trader likely sold these $135 puts weeks or months ago, collecting premium while expressing a view that XLI would stay above $135. Now with XLI at $152 (17 points above the strike), they're buying back the puts for just $1.39 each to lock in profits and remove the obligation.
Think of it like this: They originally collected maybe $3-5 per put when XLI was lower, and now they're closing for $1.39 - pocketing the difference. More importantly, they're removing downside protection, signaling they don't think XLI will crash below $135 before March even with potential volatility from earnings season, Fed decisions, and manufacturing data.
Unusual Score: 🔥 EXTREMELY UNUSUAL (Z-Score: 4.61) - This happens only a few times per year for XLI! The classification system flagged this as "EXTREMELY_UNUSUAL" with only 1 similar trade in recent history. Volume of 40,000 contracts is roughly 1.14x the entire open interest at this strike - this is a MAJOR position close.
Strategy Classification: "Close Short Put" - Confirmed bullish signal as trader exits bearish protection.
📈 Technical Setup / Chart Check-Up
YTD Performance Chart
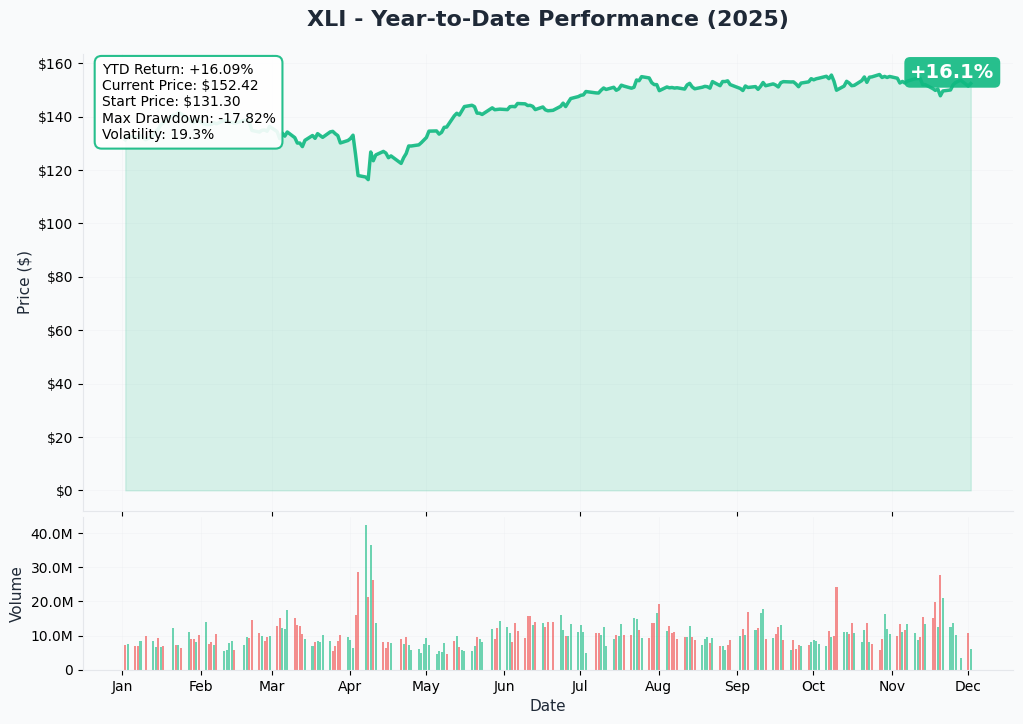
XLI is having an exceptional year - up +17.7% YTD with current price of $152.29 (started 2025 at $129.25). The chart tells a compelling sector rotation story - after consolidating in a tight $130-140 range through mid-year, XLI exploded higher in October-November on the "Great Rotation" trade out of overvalued tech into fundamentally sound industrials.
Key observations:
- 🚀 Breakout confirmed: Smashed through $140 resistance in October, rallying 9.1% in a single month
- 📈 Institutional accumulation: Strong inflows of $692.55M (3-month) and $1.62B (6-month) validating momentum
- 💪 Near all-time highs: Trading at $152.29 vs 52-week high of $156.99 (only 3% away)
- 🎯 Technical breakout structure: Clean base building followed by explosive rally - textbook accumulation pattern
- 📊 Dow strength correlation: Rally coincided with Dow crossing 48,000 for first time as industrials led
- ⚠️ Approaching resistance: $155-157 zone represents prior highs - potential consolidation zone
The put close at $135 makes perfect sense: With XLI 17 points higher and firmly above the breakout level, the original short put seller is taking risk off the table and banking profits.
Gamma-Based Support & Resistance Analysis
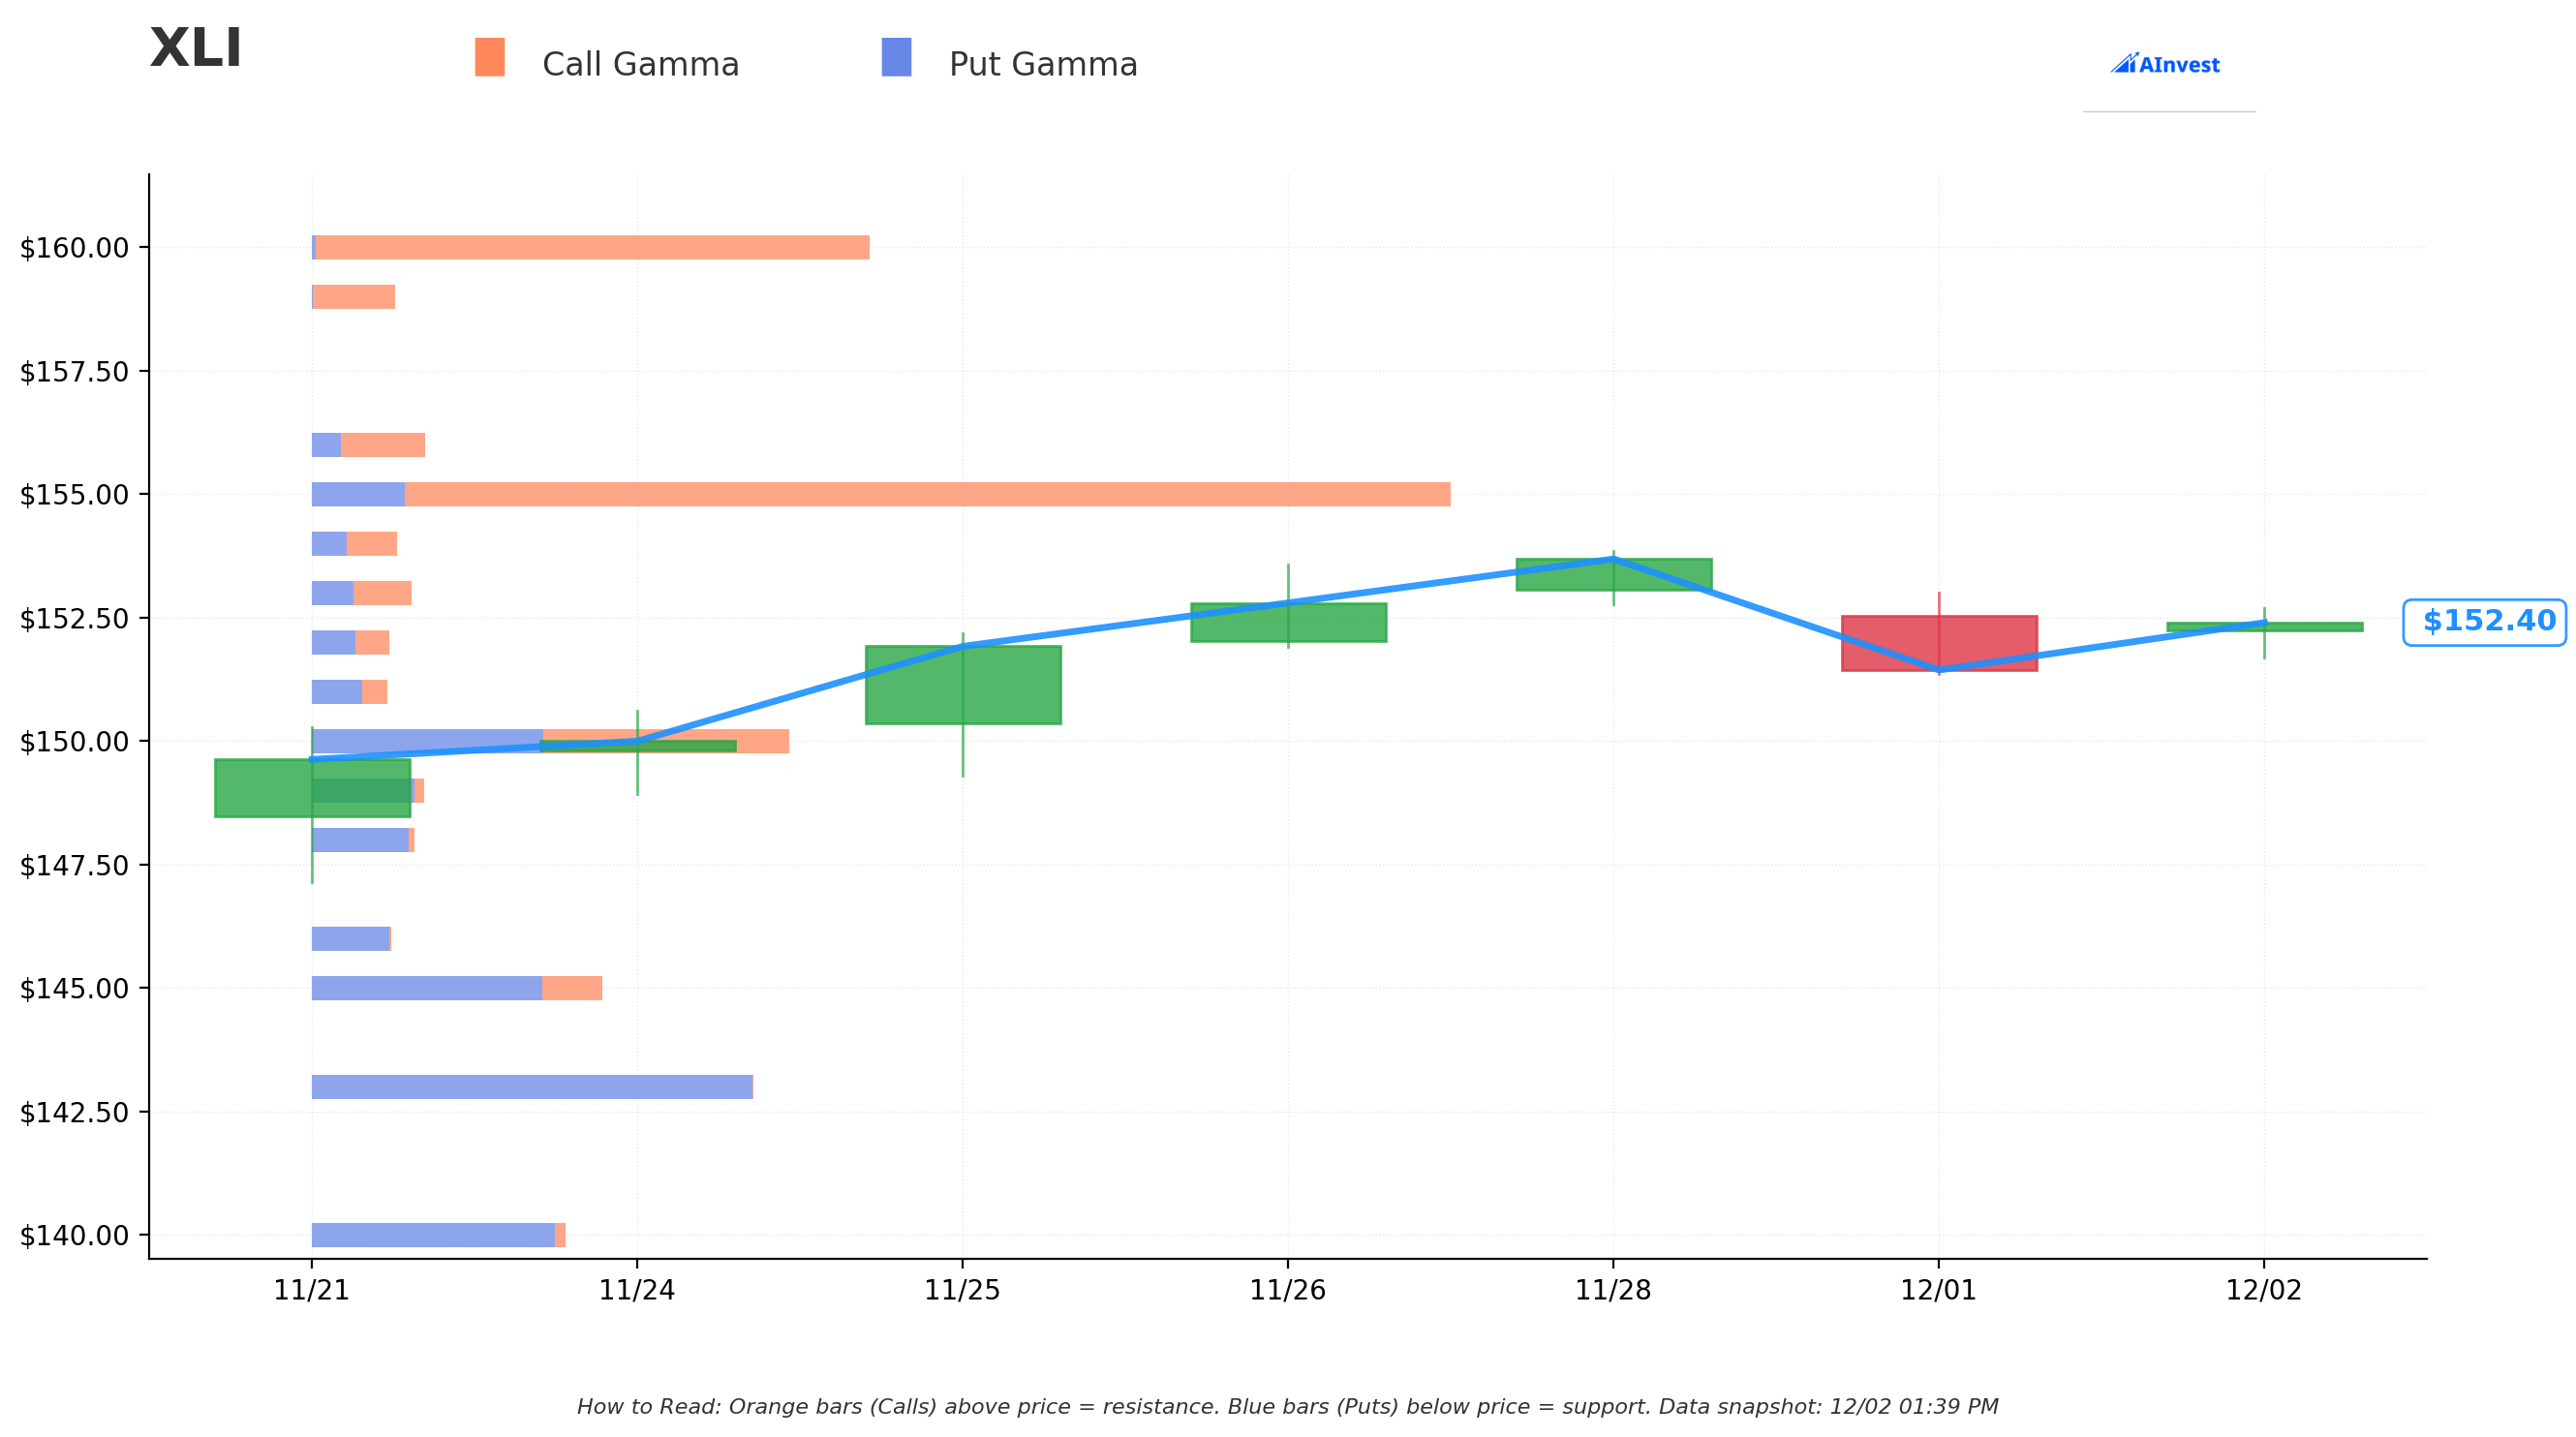
Current Price: $152.42
The gamma exposure map reveals where market makers and options traders are positioning for upcoming price action:
🔵 Support Levels (Put Gamma Below Price):
- $150 - STRONGEST support with 23.5B total gamma (0.7B net call gamma) - MAJOR FLOOR!
- $149 - Secondary support at 5.5B gamma (4.6B net put gamma)
- $145 - Intermediate floor at 14.3B gamma (8.4B net put gamma)
- $143 - Structural support at 21.8B gamma (21.7B net put gamma)
- $140 - Deep support zone at 12.5B gamma (11.5B net put gamma)
- $135 - Extended floor at 8.0B gamma (7.9B net put gamma) - EXACTLY WHERE THIS PUT WAS STRUCK!
- $130 - Disaster floor at 6.5B gamma
🟠 Resistance Levels (Call Gamma Above Price):
- $155 - IMMEDIATE ceiling with 56.2B total gamma (47.0B net call gamma) - STRONGEST RESISTANCE LEVEL!
- $156 - Secondary resistance at 5.6B gamma (2.7B net call gamma)
- $160 - Extended ceiling at 27.5B gamma (27.2B net call gamma)
What this means for traders:
XLI has rock-solid support at $150 (23.5B gamma - the largest concentration nearby) just 1.6% below current price. This creates a natural buying zone where dealers will support the price through hedging activity. Above, the $155 level represents MASSIVE resistance with 56.2B gamma and huge net call positioning - market makers will sell into rallies approaching this level.
Notice the $135 put strike? It sits at a gamma support level with 8.0B exposure. When the original short put seller established this position, they were comfortable with XLI's floor being around $135. Now with price 17 points higher and stronger support levels established at $150 and $145, that downside protection is unnecessary - hence closing the position.
Net GEX Bias: Bullish (122.7B call gamma vs 107.0B put gamma) - Overall positioning tilts bullish, with the market expecting XLI to maintain support and potentially push toward $155-160 resistance.
Implied Move Analysis
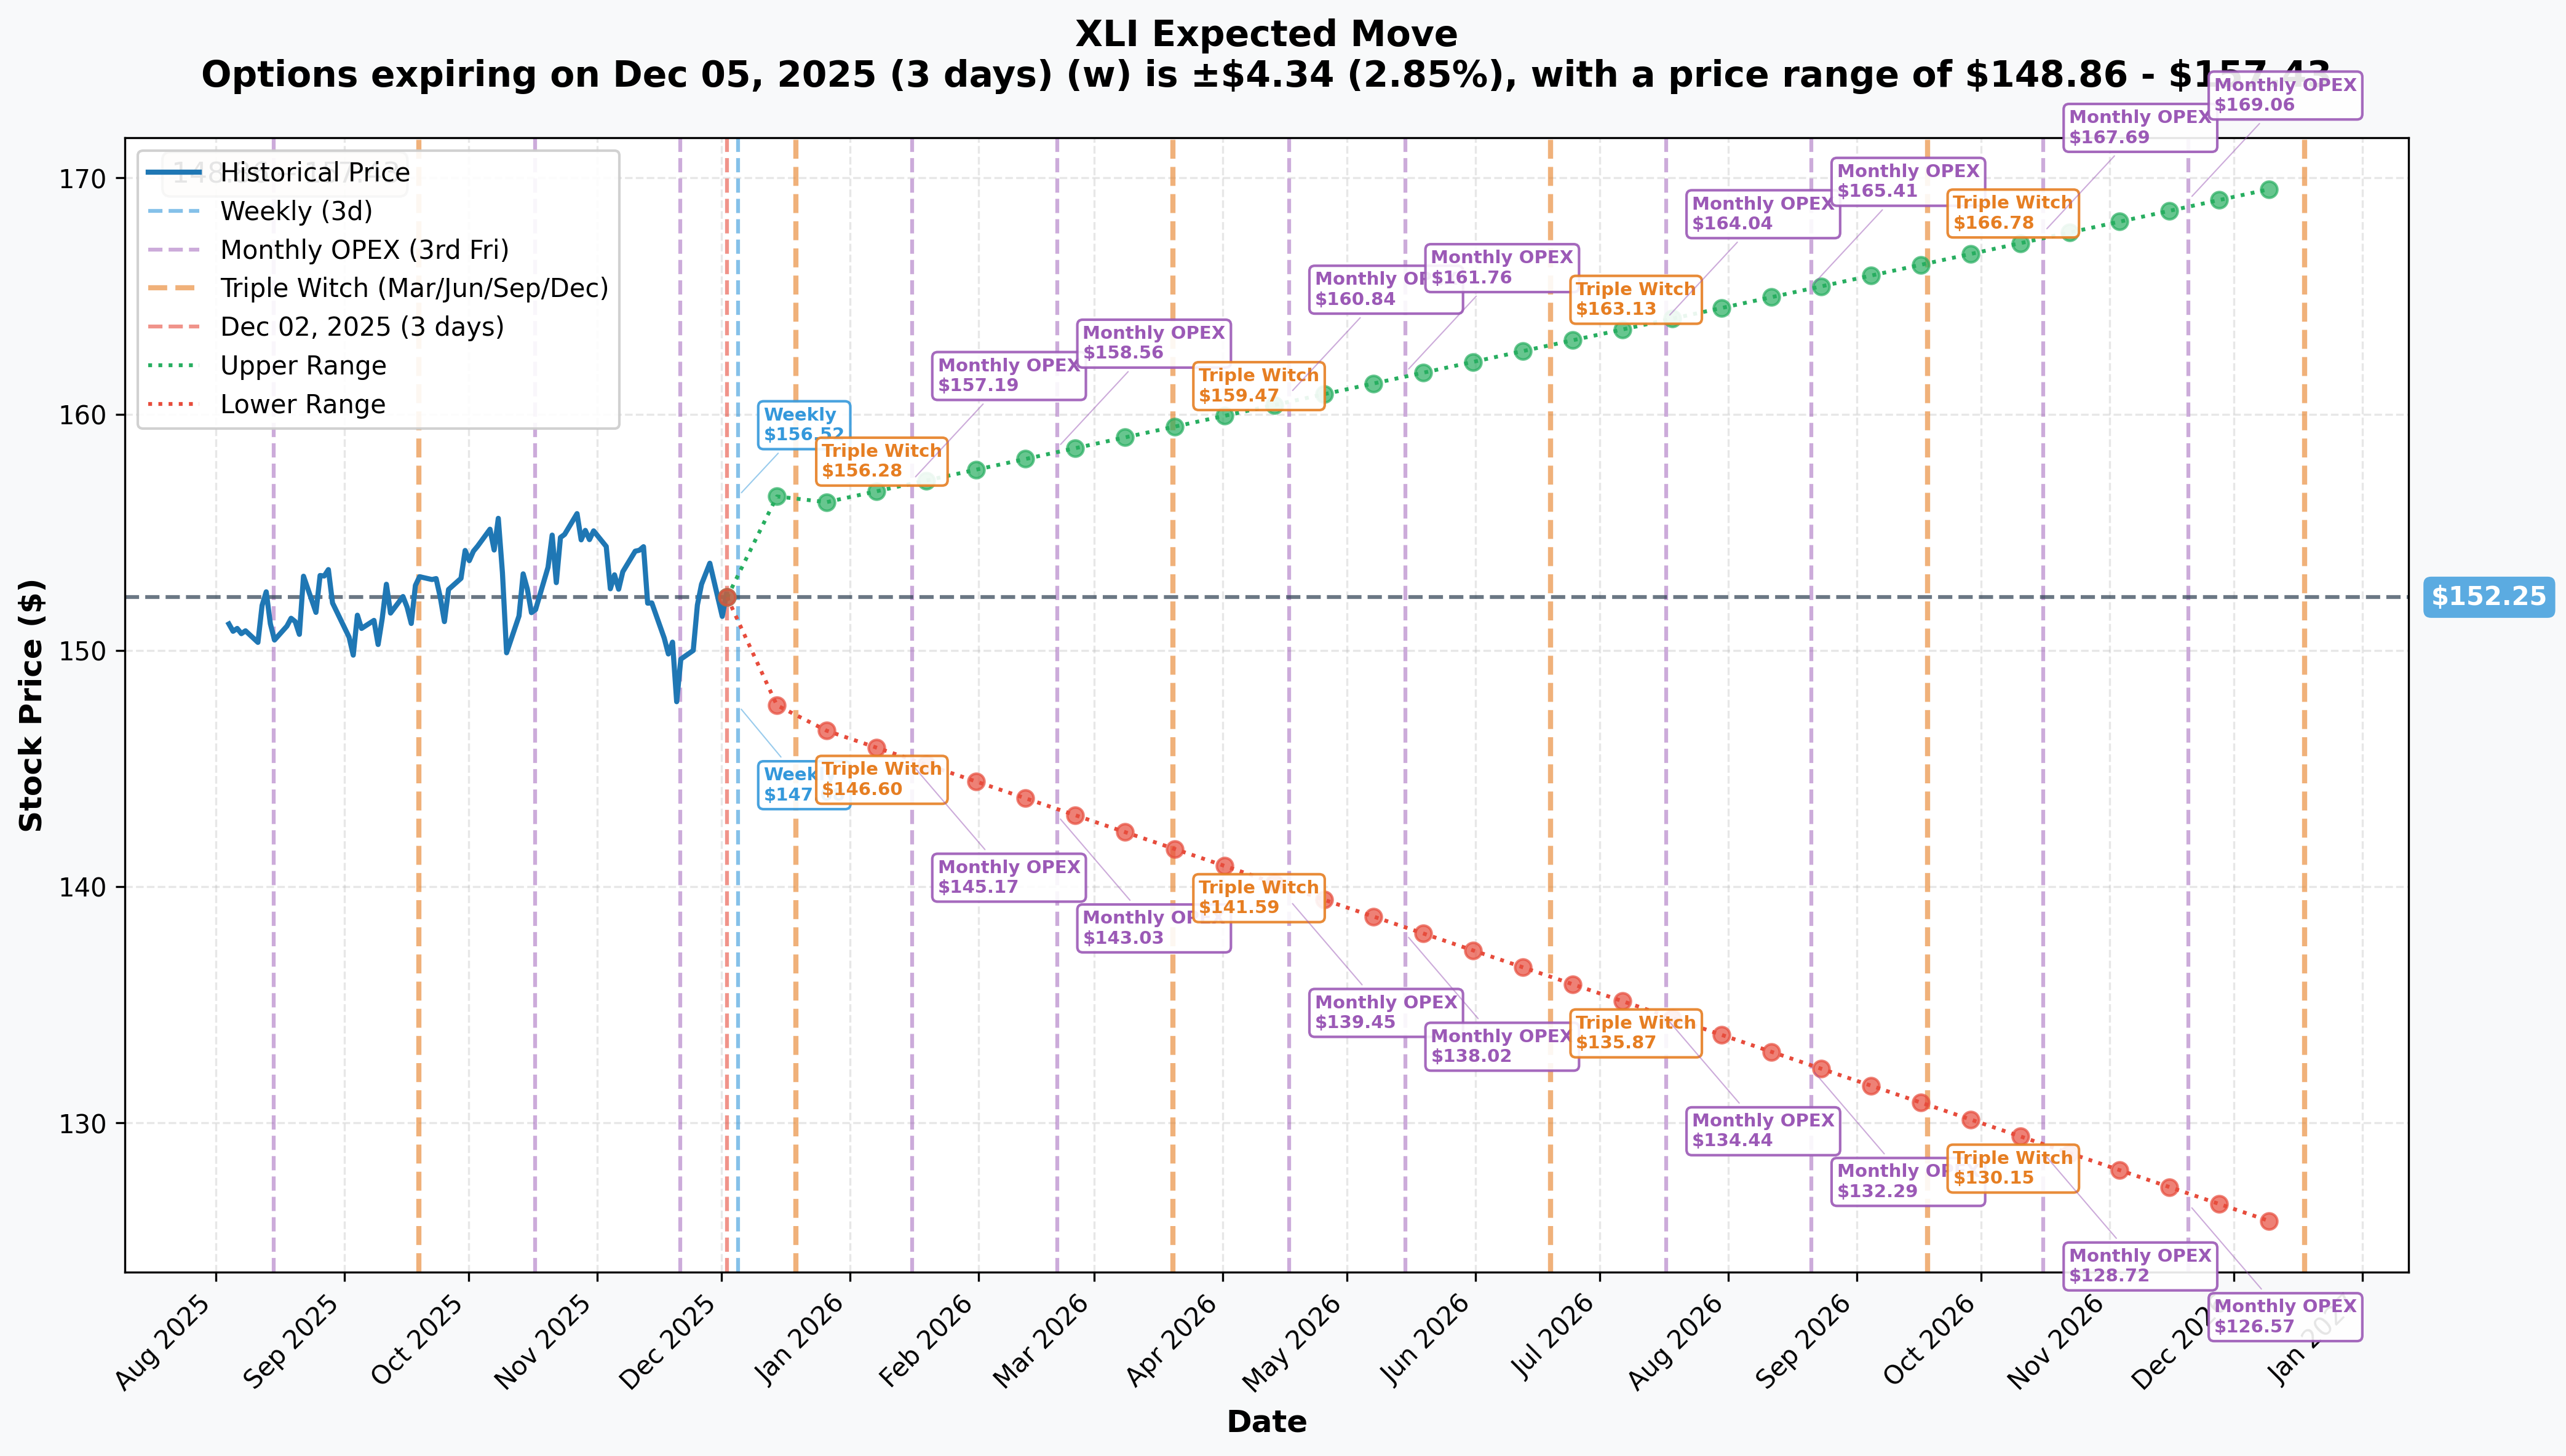
Options market pricing for upcoming expirations:
- 📅 Weekly (Dec 5 - 3 days): ±$4.34 (±2.85%) → Range: $148.86 - $157.43
- 📅 Monthly OPEX (Dec 19 - 17 days): ±$4.25 (±2.79%) → Range: $147.02 - $156.01
- 📅 Quarterly Triple Witch (Dec 19 - 17 days): ±$4.25 (±2.79%) → Range: $147.02 - $156.01
- 📅 January OPEX (Jan 16 - 45 days): ±$7.79 (±5.12%) → Range: $144.17 - $157.19
- 📅 March OPEX (Mar 20 - 108 days - THIS TRADE!): ±$11.32 (±7.44%) → Range: $141.60 - $159.47
Translation for regular folks:
Options traders expect XLI to remain relatively calm near-term, with only 2.8-2.9% moves through December OPEX. However, implied volatility increases significantly for January (+5.1%) and March (+7.4%) expirations, reflecting uncertainty around:
- Q4 2025 earnings season (January-February)
- GE Aerospace earnings January 27
- ISM Manufacturing PMI data (monthly releases)
- Federal Reserve policy evolution
- Boeing production milestones
The March 20th expiration (when this $5M put trade expires) shows a lower range of $141.60 - still well above the $135 put strike. This validates the put seller's decision to close: even with maximum volatility priced in, the market doesn't expect XLI to trade anywhere near $135.
Key insight: The relatively modest implied moves (compared to individual stocks) reflect XLI's diversified nature as a sector ETF with 66 holdings. It's inherently less volatile than single-name exposure, making it attractive for institutional positioning.
🎪 Catalysts
🔥 Already Happened (Strong Foundation)
Q3 2025 Earnings Season - CRUSHED IT! 📊
XLI's top holdings delivered exceptional Q3 results that drove the recent rally:
GE Aerospace (6.81% of XLI) - October 21, 2025:
- 💰 Revenue: $12.2B (+24% YoY), Operating margin: 20.3%
- 🚀 Adjusted EPS: $1.66 (+44% YoY) - MASSIVE BEAT!
- ✈️ LEAP engine deliveries +40%, total engines +41%
- 📈 RAISED GUIDANCE: Adjusted EPS to $6.00-$6.20, FCF to $7.1-$7.3B
Caterpillar (5.66% of XLI) - October 29, 2025:
- 💰 Revenue: $17.64B (+10% YoY) beating estimates
- 🎯 Adjusted EPS: $4.95 vs $4.52 consensus
- 🏗️ Construction Industries +7%, Energy & Transportation +17%
- 📊 Trough positioning: Machinery markets at trough levels, supporting recovery multiple
RTX Corporation (5.11% of XLI) - October 21, 2025:
- 💰 Sales: $22.5B (+13% organic), Adjusted EPS: $1.70 (+17% YoY)
- 📋 Backlog: $251B ($148B commercial, $103B defense) - multi-year revenue visibility!
- 📈 RAISED GUIDANCE: Adjusted sales to $86.5-$87B, EPS to $6.10-$6.20
Sector Rotation Confirmed - November 2025:
- 📊 Major rotation from tech to industrials as tech pulled back while industrials +8% YTD
- 💻 Microsoft hit 8-day losing streak (longest in decade) as AI capex concerns mounted
- 📈 Dow crossed 48,000 for first time on industrial strength
- 💰 XLI institutional inflows: $692.55M (3-month), $1.62B (6-month)
🚀 Upcoming Catalysts (Next 3 Months)
Q4 2025 Earnings Season - January-February 2026 📊
XLI's major holdings report Q4 results during this critical window:
GE Aerospace - January 27, 2026 (Before Open):
- 🎯 Consensus EPS: $1.44
- 📊 FY 2025 guidance: Adjusted EPS $6.00-$6.20, revenue growth high teens
- ✈️ Key metrics: LEAP deliveries continuing +40% growth, commercial aftermarket strength, FCF conversion
- 💡 Importance: GE is largest holding at 6.81% - strong results validate aerospace recovery thesis
Major Industrial Earnings Windows:
- 📅 Wells Fargo kicks off banking Jan 10, JPMorgan Jan 15
- ⚠️ Q4 estimates have been cut for Aerospace, Industrial Products, Energy sectors - creates potential for positive surprises if beaten
- 🎯 Analysts expect Q4 aerospace earnings +8.6% on +6.8% sales growth
ISM Manufacturing PMI - Monthly Releases
December data releases January 5, 2026 - critical economic indicator:
- 📉 November reading: 48.2 (9th consecutive month of contraction)
- ⚠️ 58% of manufacturing GDP contracted in November
- 🎯 Key components: New orders (47.4), employment (44), production (51.4)
- 📈 Inflection watch: Any move above 50 would signal expansion resuming - major bullish catalyst
- 📊 Conversely, continued contraction validates defensive positioning
Federal Reserve Policy Evolution
- 💰 Current fed funds rate: 3.75%-4.00%
- 🎯 Markets pricing target rate ~2.9% by end-2026
- ⚖️ Chair Powell: December cut "not a foregone conclusion"
- 📊 "Higher for longer" rate environment favors value/cyclicals over growth - tailwind for XLI
Boeing Production Milestones - Q4 2025 & Q1 2026
Boeing (3.00% of XLI) targeting critical production ramps:
- ✈️ FAA approved production increase from 38 to 42 737 MAX per month
- 🎯 Current production: ~31/month, targeting 47/month by year-end 2025
- 💰 Each incremental 737 MAX ~$50-60M revenue, 787 ~$150M
- ⚠️ Risk: MAX 7/10 certification pushed to 2026 due to engine issues
- 📈 787 target: 7/month by end-2025, 10/month by 2026
Aerospace Supply Chain Recovery Timeline
Industry-wide inflection expected in 2026:
- 📋 Industry backlog at historic 17,000 aircraft vs 13,000 pre-pandemic
- 💸 Supply chain delays cost airlines $11B+ in 2025
- 📈 70% of aerospace companies now report ramp-up readiness vs 35% in 2024
- ⏰ Meaningful stability not expected until 2026
- ✈️ Airbus opened second A320 line targeting 75/month by 2027
Defense Spending & NDAA Authorization
Government spending provides stable base:
- 💰 FY 2026 NDAA authorizes $924.7B defense spending
- 📈 Latest continuing resolution added $9B for DoD modernization
- 🎯 Multi-year defense contracts provide revenue visibility through 2027+
- 💪 Northrop Grumman defense systems +14% YoY in Q3
📊 Medium-Term Catalysts (Q2-Q4 2026)
Infrastructure Spending Acceleration
Multiple tailwinds supporting industrial demand:
- 🌍 Global infrastructure market: $3.82T in 2025
- 🚄 Transportation infrastructure: $36T investment through 2040
- 💻 Digital infrastructure driving data center/AI facility construction
- 📈 U.S. construction +1.9% AAGR 2026-2029 driven by AI infrastructure
- ⚠️ Near-term headwind: 2025 construction down -2.7% due to Trump tariff impacts
Trade Policy Evolution
Tariffs create both headwinds and opportunities:
- 🚨 Trump reciprocal tariffs: 34% China, 25% Canada/Mexico, 10% universal baseline
- ⚖️ Weighted average tariff rate: 15.8% (highest since 1943)
- 💰 Costs: RTX cited $500M annual tariff impact from steel/aluminum
- 📈 Opportunities: $2.2T manufacturing reshoring investment surge
- 🤝 U.S.-China trade arrangement finalized November 2025 aims to reduce deficit
XLI Forward Stock Split - December 5, 2025
- 📊 XLI forward stock split effective December 5
- 🔄 Increases shares outstanding while proportionally reducing share price
- 💡 Impact: Improved accessibility for retail investors, potential liquidity increase
🎲 Price Targets & Probabilities
Using gamma levels, implied move data, analyst targets, and catalysts through March 20th expiration:
📈 Bull Case (40% probability)
Target: $160-$165
How we get there:
- 💪 Q4 earnings season delivers beats across major holdings (GE, CAT, RTX, Boeing)
- 📊 GE Aerospace crushes $1.44 EPS estimate on January 27, raises FY guidance further
- ✈️ Boeing production ramp accelerates - hitting 47 MAX/month validates recovery timeline
- 📈 ISM Manufacturing PMI inflects above 50 (expansion) after 9 months of contraction
- 🏭 Aerospace supply chain improvements materialize faster than expected in Q1 2026
- 🚀 Infrastructure spending picks up as AI data center construction accelerates
- 💰 Sector rotation continues - more institutional capital flows from tech to industrials
- 🎯 Breakout above $155 gamma resistance triggers technical rally to $160-165
Supporting data:
- 📊 Average analyst price target: $171.07 (+12% upside)
- ✅ Consensus rating: Moderate Buy (66 buy, 13 hold, 2 sell)
- 💹 Implied move upper range for March: $159.47 (within striking distance)
- 🌍 Analysts view XLI as currently undervalued
Why 40% probability: Requires solid execution but not perfection. Aerospace recovery on track, earnings comps favorable, valuation reasonable at 26.7x P/E. Main risk is manufacturing recession continuing, but defense/aerospace provide offset.
🎯 Base Case (45% probability)
Target: $148-$156 range (CONSOLIDATION)
Most likely scenario:
- ✅ Mixed earnings season - some beats, some misses, overall in-line with expectations
- 📊 GE delivers solid results but guidance cautious due to supply chain uncertainty
- ⚖️ Manufacturing PMI remains below 50 but shows signs of bottoming (48-49 range)
- 💰 Gradual sector rotation continues but at slower pace - tech stabilizes
- ✈️ Boeing production ramp progresses but encounters typical delays/hiccups
- 🇨🇳 Tariff uncertainty persists - no major positive or negative developments
- 📈 Trading within gamma support ($150) and resistance ($155-156) bands
- 💤 Market digests 17.7% YTD gains, waits for clearer 2026 visibility
- 🎯 Volatility moderate - occasional dips to $148-149 bought, rallies to $155-156 sold
Why 45% probability: Most realistic given macro uncertainty. XLI has proven support at $150, resistance at $155. Fundamentals solid but not explosive. Industrials face headwinds (manufacturing recession, tariffs) and tailwinds (defense spending, aerospace recovery) that roughly offset.
Put expiration outcome: March $135 puts expire worthless with XLI trading well above strike. Original short put seller profits from decay, closing position was prudent risk management.
📉 Bear Case (15% probability)
Target: $140-$145
What could go wrong:
- 😰 Q4 earnings disappoint - particularly GE Aerospace misses or guides down
- 🚨 Boeing production delays worsen - FAA safety issues resurface
- 📉 Manufacturing recession deepens - ISM PMI drops to 45 or below
- 🇨🇳 New tariff escalations announced - steel/aluminum doubled to 50% hits margins harder
- 💸 Broader market correction drags industrials lower (tech crash contagion)
- ⚠️ Federal Reserve holds rates higher for longer - pressures cyclical sectors
- 🌍 Global recession fears intensify - industrial demand crater
- 📊 Sector rotation reverses - money flows back to tech on AI optimism
- 🔨 Break below $150 gamma support triggers cascade to $145, then $140
Critical support levels:
- 🛡️ $150: Major gamma floor (23.5B) - MUST HOLD or momentum shifts bearish
- 🛡️ $145: Intermediate support (14.3B gamma) - major battleground
- 🛡️ $140: Deep support (12.5B gamma) - represents full retracement of Q4 rally
Why only 15% probability:
- Strong fundamental support from $251B RTX backlog, $924.7B defense spending
- Diversified 66-holding ETF structure provides stability
- Institutional inflows of $1.62B over 6 months show conviction
- Manufacturing at trough (can't get much worse)
- Put close at $135 signals smart money NOT worried about collapse
Even in bear case, $135 put strike remains far out of the money - validating the original short put seller's bullish thesis and decision to close.
💡 Trading Ideas
🛡️ Conservative: Buy Shares on Dips to $150 Support
Play: Accumulate XLI shares on any pullbacks to $150-151 gamma support zone
Why this works:
- 📊 Massive 23.5B gamma support at $150 creates natural floor just 1.6% below current price
- 💰 ETF structure provides diversification across 66 industrial companies
- 📈 Strong institutional inflows ($1.62B over 6 months) validate momentum
- 🎯 Analyst upside target of $171 (+12%) provides margin of safety
- 💵 1.38% dividend yield provides income while waiting
- 📉 0.08% expense ratio (cheapest quintile) minimizes drag
- ✅ Buying at support limits downside to $148-149 worst case (-2% risk for +12% target = 6:1 reward/risk)
Entry strategy:
- 🎯 Set limit orders at $150.50-$151.00 (gamma support zone)
- 📊 Scale in: 50% at $151, 25% at $150, 25% at $149 if dips further
- ⏰ Time horizon: 3-6 months to capture aerospace recovery and earnings season
- 🛡️ Stop loss: Hard stop at $147.50 (break of support structure) = -2.5% max risk
Position sizing:
- Core holding: 5-10% of portfolio
- Safe for retirement accounts, IRAs, conservative investors
- Can pair with covered calls at $155 strike for income enhancement
Expected outcome:
- Base case: $152-156 range = flat to +3% plus dividends
- Bull case: $160-165 = +8-11% total return
- Bear case: Stop at $147.50 = -2.5% contained loss
Risk level: Low (diversified ETF, clear support) | Skill level: Beginner-friendly
⚖️ Balanced: Sell Cash-Secured Puts at $150 Strike (Copy the Pros!)
Play: Sell March 2026 $150 puts, collecting premium while getting paid to wait for entry
Structure: Sell XLI March 20, 2026 $150 puts (SAME expiration as the unusual trade!)
Why this works:
- 💰 Collect premium NOW for agreeing to buy XLI at $150 (exactly where gamma support sits!)
- 🎯 $150 is 1.6% below current price - you're getting paid to buy at a discount
- 📊 Essentially mirroring the institutional positioning - they closed $135 puts (too far OTM), you sell $150 puts (closer to current price for better premium)
- ⏰ 108 days to expiration = nice theta decay through earnings season and catalyst events
- 🛡️ Worst case: Assigned at $150, you own XLI at support with $148-171 upside range
- 💵 Best case: XLI stays above $150, you keep entire premium, repeat in March
Estimated P&L (adjust based on current IV):
- 💰 Collect ~$2.50-3.50 per share premium ($250-350 per contract)
- 📈 Return on capital: ~1.7-2.3% for 108 days (5.7-7.6% annualized!)
- 📊 Effective buy price if assigned: $147-$147.50 (strike minus premium)
- 🎯 Breakeven: $147-$147.50 (still above $145 intermediate support)
Scenarios:
- ✅ XLI stays $150+: Keep $250-350 premium, capital unlocked March 20
- 📈 XLI rallies to $160: Keep premium, miss upside (but that's okay - you got paid!)
- 📉 XLI drops to $150: Assigned, own at support with premium buffer
- 😰 XLI crashes to $145: Assigned at $150, unrealized -$2-3 loss (minus premium = flat to -$0.50)
Entry requirements:
- 💵 Cash-secured: Need $15,000 per contract in account
- 📊 Comfortable owning XLI long-term at $150 (you MUST be willing to be assigned!)
- ⏰ 108-day commitment (can close early but best to let theta decay work)
Position sizing:
- Risk 3-5% of portfolio (1-2 contracts for $50K account)
- Can stack with other put sales at different strikes ($148, $145) for layered entry
Risk level: Moderate (obligation to buy, but at good price) | Skill level: Intermediate
Advanced variation: Use the premium collected ($250-350) to buy $160 calls (calendar spread strategy) - but only for experienced options traders!
🚀 Aggressive: Bull Call Spread Targeting $160 (Defined Risk Bet)
Play: Buy bull call spread betting on breakout above resistance through March
Structure:
Why this could work:
- 🚀 Analyst targets averaging $171 (+12%) suggest $160 achievable
- 📈 Strong earnings catalysts: GE Jan 27, CAT, RTX, Boeing all reporting Q4 in window
- ✈️ Aerospace recovery accelerating - 70% companies ready to ramp
- 💰 Sector rotation momentum could continue - tech struggles favor industrials
- 🎯 Targeting resistance at $155-160 (where gamma shows call concentration)
- 📊 Spread structure: Limited risk, defined max profit, better than buying calls outright
Estimated P&L (adjust based on current IV):
- 💰 Cost: ~$2.50-3.00 net debit per spread ($250-300 per contract)
- 📈 Max profit: $2.00-2.50 if XLI above $160 at expiration ($200-250 per contract)
- 📉 Max loss: $2.50-3.00 if XLI below $155 at expiration (100% of premium)
- 🎯 Breakeven: ~$157.50-158.00 (entry cost + strike)
- 💹 Risk/Reward: ~1:1 (risking $250-300 to make $200-250)
Profit zones:
- 🚀 XLI > $160: Full profit ($200-250 per spread) = 70-80% ROI
- 📈 XLI $157-160: Partial profit based on intrinsic value
- ⚖️ XLI $155-157: Breakeven to small loss
- 📉 XLI < $155: Full loss of premium ($250-300)
Why this could fail:
- ⚠️ Manufacturing recession worsens - ISM stays below 45
- 😰 Earnings disappoint - GE/CAT/RTX miss estimates
- 📉 Market correction drags all sectors lower
- 🎯 XLI consolidates in $150-155 range (doesn't break out)
- ⏰ Time decay works against you if move doesn't happen quickly
- 💸 Tariff escalation compresses margins
Entry timing:
- ✅ Enter NOW if you believe in immediate breakout
- ⏰ OR wait for pullback to $150-151 for better entry (cheaper premiums)
- 🎯 DON'T chase if XLI already above $155 - spread becomes too expensive
Position sizing:
- Risk 2-3% of portfolio MAX (directional speculation)
- 3-5 spreads for $50K account ($750-1,500 total risk)
- This is a DEFINED RISK trade but still speculative
Management:
- 📊 Take profits at 50-70% of max gain (don't be greedy!)
- 🛡️ Set alert at $155 breakout to add more spreads
- ⏰ Plan to close 2-4 weeks before expiration to avoid pin risk
- ❌ Cut losses at 50% if thesis breaks (XLI drops below $150)
Risk level: Moderate-High (directional bet, time decay risk) | Skill level: Intermediate-Advanced
CRITICAL WARNING:
- ✅ Only attempt if you understand spread mechanics
- ✅ Must accept losing 100% of premium if wrong
- ✅ Better risk/reward than naked calls but still speculative
- ✅ Don't confuse defined risk with "safe" - you can still lose everything
⚠️ Risk Factors
Don't get caught by these potential landmines:
-
📉 Manufacturing recession persists: 9th consecutive month of PMI contraction at 48.2, with 58% of manufacturing GDP contracting. New orders (47.4) and employment (44) in deep contraction. If manufacturing doesn't inflect positive in Q1 2026, industrial demand could weaken further despite aerospace/defense strength.
-
💰 Tariff margin compression: Trump's reciprocal tariffs create 15.8% weighted average rate (highest since 1943), representing $1,200 average burden per household. RTX already citing $500M annual impact from steel/aluminum tariffs. If tariffs expand or steel prices spike, margins compress across industrial manufacturers.
-
✈️ Boeing execution risk: MAX 7/10 certification delayed to 2026, production capped at 42/month despite 47/month target. Boeing represents 3% of XLI but has outsized narrative impact on aerospace recovery thesis. Any safety incidents, FAA restrictions, or production failures would crater sentiment.
-
🛫 Aerospace supply chain delays: Despite improving readiness, meaningful stability not expected until 2026 and delays cost airlines $11B+ in 2025. Engine shortages, labor constraints, and tier-2/3 supplier bottlenecks could derail production ramps at GE, RTX, Boeing.
-
📊 Concentrated top-heavy exposure: Top 3 holdings (GE, CAT, RTX) = 17.5% of fund. Single-stock risk amplified - if GE disappoints earnings Jan 27, XLI could drop 2-3% same day. Lack of diversification at top magnifies individual company execution risk.
-
🏗️ Infrastructure spending delays: While long-term $36T opportunity exists, 2025 construction down -2.7% due to tariff impacts. If builders remain uncertain about input costs and policy, infrastructure acceleration could push to 2027+ (beyond our March timeframe).
-
🇨🇳 China geopolitical wildcard: U.S.-China trade arrangement finalized November 2025 but tensions remain. Any escalation (Taiwan, export controls, retaliatory tariffs) hits industrials with China exposure. CAT particularly vulnerable with equipment sales.
-
💸 Valuation stretched after big run: Up 17.7% YTD with P/E at 26.69x (above historical 20-22x average for industrials). Multiple expansion already captured - further gains require earnings growth delivery. If 2026 earnings disappoint, multiple could compress back to 22-24x = -10-15% downside even with flat earnings.
-
📉 Sector rotation reversal risk: Current trade predicated on money flowing OUT of tech INTO industrials. If AI narrative re-accelerates (new breakthrough, earnings beats from Nvidia/Microsoft), capital could rotate BACK to tech. Microsoft's 8-day losing streak could reverse quickly on positive catalysts.
-
⚖️ Federal Reserve policy error: While "higher for longer" rates favor value/cyclicals, if Fed HOLDS rates too high too long, cyclical sectors get crushed first. Industrial capital expenditure highly rate-sensitive. Any hawkish surprise would pressure XLI.
-
🎢 ETF structure creates index-tracking risk: XLI mechanically tracks S&P Industrial Sector Index. Can't be nimble - must hold weak stocks alongside strong ones. Active managers could outperform by avoiding Boeing/defense issues while overweighting aerospace winners.
-
📊 Gamma resistance at $155-160 is REAL: Massive 56.2B call gamma at $155 means market makers SELL into rallies to hedge. Retail FOMO buying into $155-157 faces mechanical headwinds. Breakout requires sustained institutional buying to overcome - not guaranteed.
🎯 The Bottom Line
Real talk: Someone just closed a $5 MILLION short put position on XLI, effectively removing downside protection and signaling increased confidence in the industrial sector through March 2026. This isn't a dramatic "all-in" bullish bet - it's sophisticated risk management by an institution that originally sold puts at $135 and is now closing them with XLI 17 points higher at $152.
What this trade tells us:
- 🎯 Original thesis validated: Seller established short puts expecting XLI to stay above $135 - with price at $152, they were RIGHT. Closing now locks in profits.
- 💰 Removing unnecessary hedges: With strong gamma support at $150 and $145, plus improving fundamentals, the $135 floor is too conservative. Smart money adjusting risk as environment improves.
- ⏰ Timing before catalysts: Closing before Q4 earnings season (Jan-Feb) suggests confidence that reports won't crater XLI. If worried about GE/CAT earnings, they'd keep protection.
- 📊 Bullish sector rotation confirmed: The trade aligns with broader trend - $1.62B institutional inflows over 6 months, Dow crossing 48,000, tech weakness favoring industrials.
- 🛡️ Not worried about manufacturing recession: Despite 9 months of PMI contraction, aerospace/defense tailwinds provide offset. If truly bearish, would KEEP puts, not close them.
This is NOT a "sell everything in tech and buy industrials" signal - it's a "industrials are fundamentally sound, downside protection at $135 is overkill" signal.
If you own XLI:
- ✅ Stay long! The technical setup ($150 support, improving fundamentals, analyst upside to $171) remains intact
- 📊 Set mental support at $150 (major gamma floor) - if broken, reassess
- 💵 Can enhance returns selling covered calls at $155-156 strikes (resistance zone)
- ⏰ Hold through Q4 earnings season - GE Jan 27 is key catalyst
- 🎯 Profit target $160-165 by March aligns with analyst consensus $171
If you're looking to enter:
- ⏰ Best entry: $150-151 on dips (gamma support zone, 1-2% pullback from current)
- 📊 Current price $152 is acceptable with stop at $148 (defined -2.5% risk)
- 🚫 DON'T chase above $155 - that's resistance, not entry point
- ✅ Alternative: Sell cash-secured puts at $150 strike, get paid to wait for entry
- 🎯 Target: $160-165 (5-8% upside) by March 2026
If you're bearish:
- ⚠️ Be careful fighting this trade! Institutional put close suggests smart money NOT worried about crash
- 📊 First short entry only below $150 (gamma support break)
- 🎯 Targets: $145 then $140 if manufacturing data worsens dramatically
- ⏰ Better to wait for failed breakout at $155-157 (short resistance rejection)
- 📉 Alternative: Buy protective puts at $150 if you must hedge, but expensive after this unusual flow
Mark your calendar - Key dates:
- 📅 December 5, 2025 - XLI forward stock split effective
- 📅 January 5, 2026 - ISM Manufacturing PMI (December data) - inflection watch
- 📅 January 10, 2026 - Earnings season begins (Wells Fargo)
- 📅 January 27, 2026 - GE Aerospace Q4 earnings (CRITICAL - largest holding!)
- 📅 February 2026 - CAT, RTX, Boeing Q4 earnings window
- 📅 March 20, 2026 - Quarterly OPEX, this $5M put trade expires
Final verdict:
XLI's industrial sector story remains fundamentally strong despite manufacturing headwinds:
- ✅ Aerospace recovery accelerating: GE +44% EPS, RTX $251B backlog, Boeing ramping production
- ✅ Defense spending stable: $924.7B NDAA authorization provides multi-year visibility
- ✅ Sector rotation tailwind: Tech struggles + industrial strength favors XLI through 2026
- ✅ Valuation reasonable: 26.7x P/E with 12% analyst upside to $171
- ⚠️ Headwinds manageable: Manufacturing recession, tariffs, supply chains all challenges but NOT dealbreakers
The $5M put close confirms smart money is REDUCING bearish hedges, not adding them. That's your signal.
Conservative play: Buy shares at $150-151 support, target $160-165, stop at $148. Aggressive play: Bull call spread $155/$160 for defined-risk breakout bet. Income play: Sell cash-secured puts at $150, collect premium while waiting for entry.
The industrial sector rotation is real. The catalysts are coming. The technicals are clean. Don't overthink it. 💪
Disclaimer: Options trading involves substantial risk of loss and is not suitable for all investors. This analysis is for educational purposes only and not financial advice. Past performance doesn't guarantee future results. The "extremely unusual" classification reflects statistical sizing relative to recent XLI option flow - it does not imply the trade will be profitable or that you should follow it. The trade analyzed represents a sophisticated institutional position close that may involve complex portfolio hedging needs not applicable to retail traders. ETF investments carry market risk and can lose value. Always do your own research and consider consulting a licensed financial advisor before trading.
About Industrial Select Sector SPDR Fund (XLI): XLI seeks to provide investment results that correspond to the price and yield performance of the Industrial Select Sector Index, offering exposure to companies in industries including aerospace, defense, machinery, transportation, construction, and engineering services, with $23.86 billion in assets under management.