📅 January 14, 2026 | 🔥 Unusual Activity Detected
🎯 The Quick Take
Someone just dropped $1.6 MILLION on XLI puts expiring January 30 - that's 17,000 contracts betting the industrial sector drops below $162. This trade is EXTREMELY UNUSUAL - this level of activity happens maybe a few times per year. With GE Aerospace, Boeing, Union Pacific, RTX, Honeywell, and Caterpillar all reporting earnings between January 22-29, this whale is positioning for potential sector-wide weakness.
💰 The Option Flow Breakdown
📊 What Just Happened
| Time | Symbol | Buy/Sell | Call/Put | Expiration | Premium | Strike | Volume | OI | Size | Spot Price | Option Price | Option Symbol |
|---|---|---|---|---|---|---|---|---|---|---|---|---|
| 12:07:20 | XLI | BUY | PUT | 2026-01-30 | $1.6M | $162 | 17,000 | 25 | 10,430 | $163.42 | $1.57 | XLI20260130P162 |
The Stats:
- 📊 Volume: 17,000 contracts
- 🎯 Strategy: Long Put (Standalone bearish bet)
- 📉 Vol/OI Ratio: 680 (HIGH ACTIVITY signal)
- 🔄 Classification: OPEN position (new money entering)
🤓 What This Actually Means
Translation: A big player just made a $1.6M bet that XLI drops at least 0.7% (to $162 or below) before January 30. They're paying roughly $0.94 per contract, which means they need XLI to fall to about $161 just to break even.
This timing is key - they're positioning right before a massive earnings cluster from XLI's biggest holdings:
- 🔹 GE Aerospace (6.81% weight) - January 22
- 🔹 Caterpillar (5.80% weight) - Late January
- 🔹 RTX (5.07% weight) - January 27
- 🔹 Boeing (3.69% weight) - January 27
- 🔹 Union Pacific (2.72% weight) - January 27
- 🔹 Honeywell (2.64% weight) - January 29
📈 Technical Setup / Chart Check-Up
YTD Performance
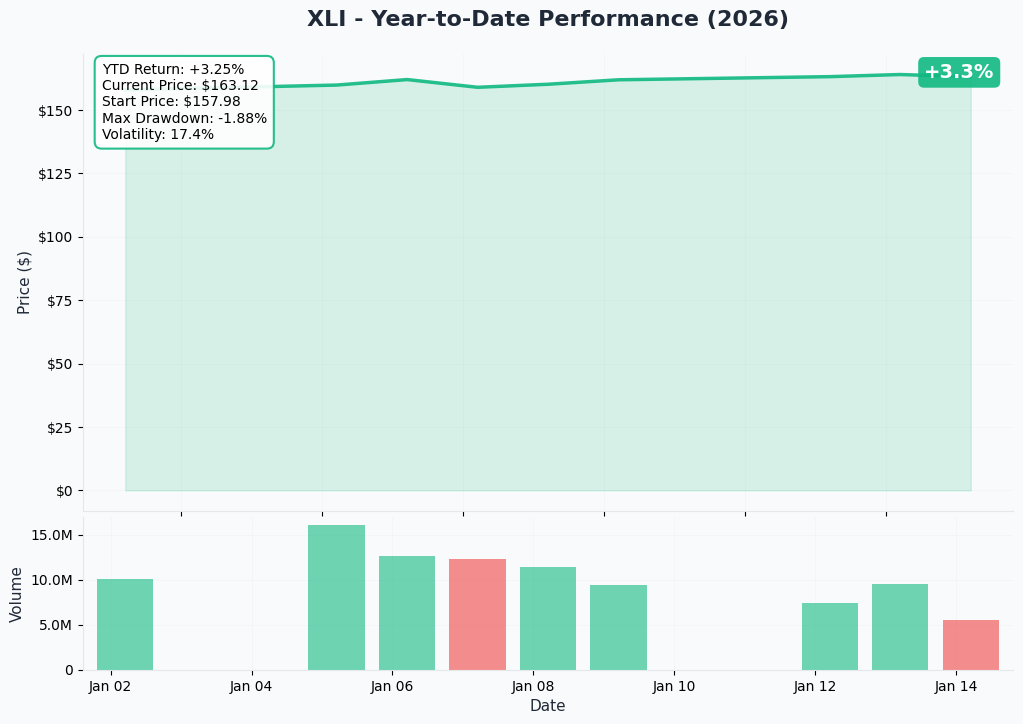
XLI has had a solid run, up +26.64% over the past 52 weeks and +3.05% YTD. The ETF is currently trading around $163.20, just off its 52-week high of $162.60 (note: current price exceeds the old 52-week high, indicating recent breakout). The price-to-earnings ratio sits at 27.81, which is above the S&P average - suggesting some valuation stretch.
🔵🟠 Gamma-Based Support & Resistance Analysis
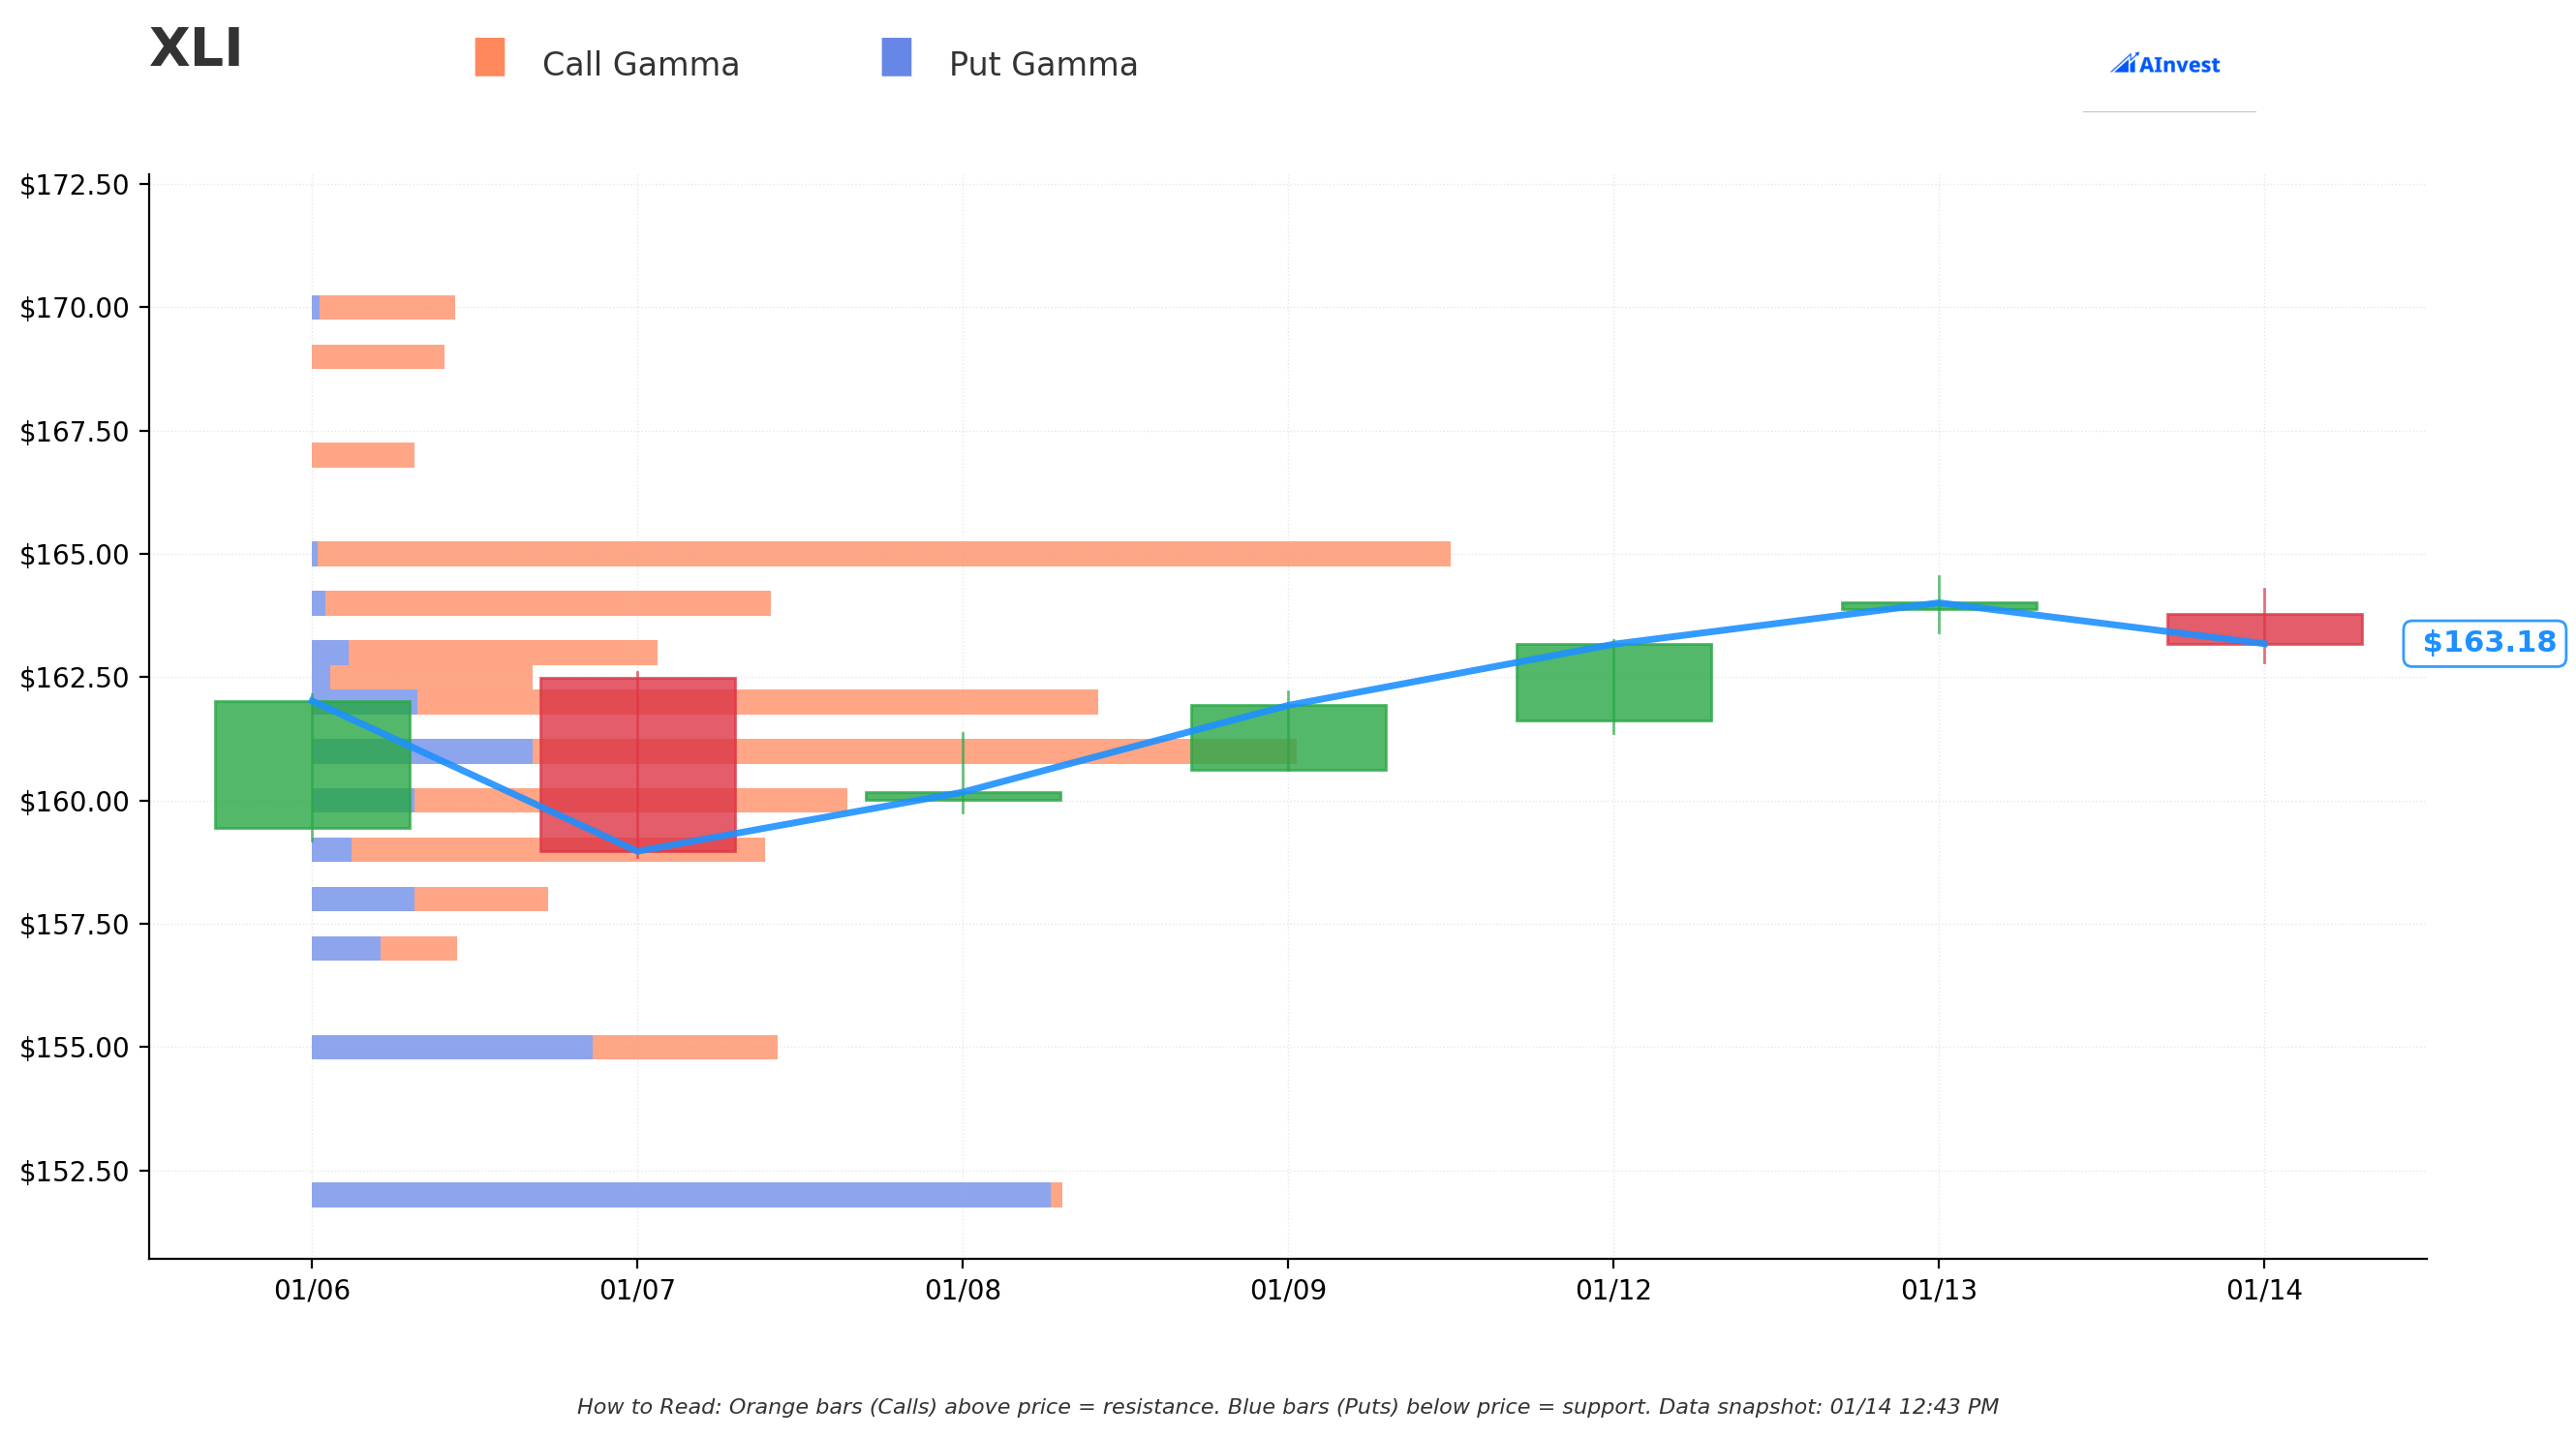
The gamma exposure (GEX) analysis shows a Bullish bias overall, but there are important levels to watch:
Key Resistance Levels (Orange Bars - Call Gamma):
- 🟠 $165 - Strongest resistance with $16.1M call GEX (1.1% above current price)
- 🟠 $164 - Secondary resistance at $6.3M call GEX (0.5% above)
Key Support Levels (Blue Bars - Put Gamma):
- 🔵 $163 - Nearest support at $3.8M net GEX (0.1% below - right at current price)
- 🔵 $162 - Strong support at $8.1M net GEX (0.7% below) - This is where the whale placed their bet!
- 🔵 $152 - Major support at -$10.2M net GEX (6.9% below)
- 🔵 $135 - Deep support at -$9.3M net GEX (17.3% below)
What the Numbers Tell Us:
- Total Call GEX: $82.4M (bullish pressure)
- Total Put GEX: $45.0M (bearish pressure)
- Net Bias: Bullish - but the $162 strike is where the action is
📊 Implied Move Analysis
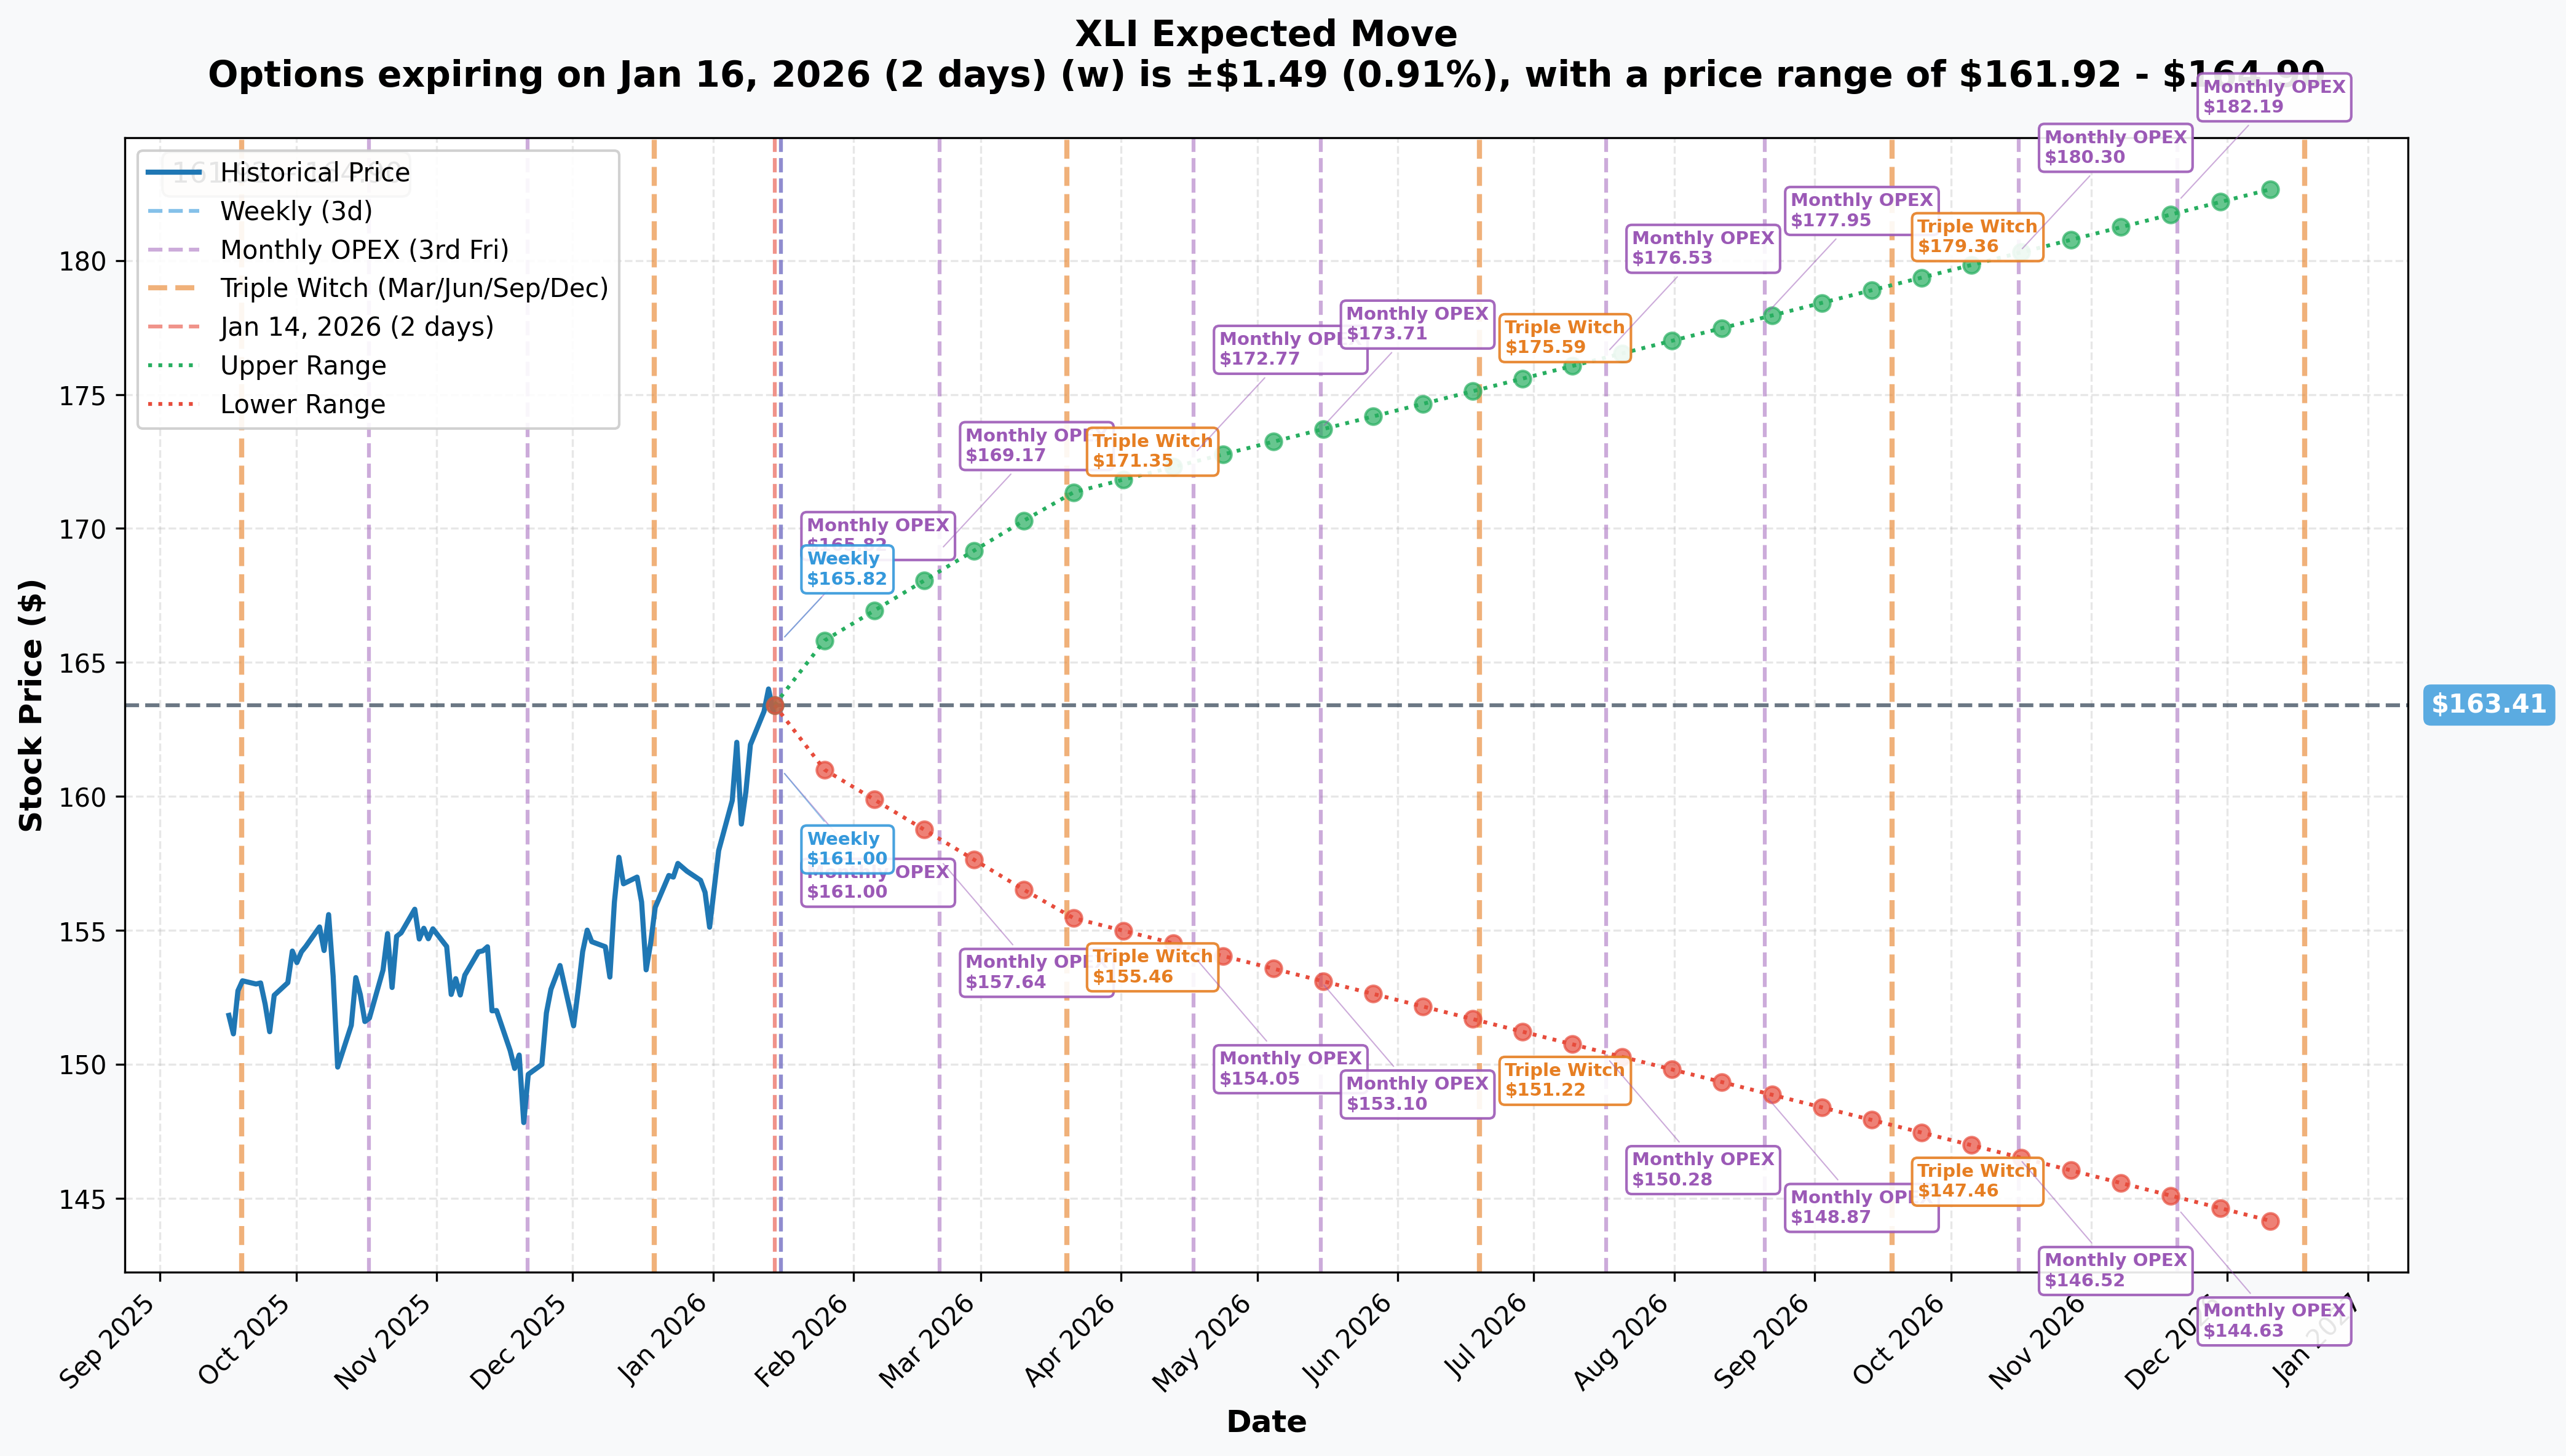
Based on current options pricing, here's what the market expects:
| Timeframe | Days | Implied Move | Range |
|---|---|---|---|
| Weekly (Jan 16) | 2 | ±0.91% | $161.92 - $164.90 |
| Quarterly (Mar 20) | 65 | ±4.84% | $155.50 - $171.31 |
| LEAPS (Dec 18) | 338 | ±11.99% | $143.82 - $183.00 |
Key Observations:
- 📉 Implied Volatility: ~17% (relatively calm for industrials)
- 📊 IV Skew: -1.12 (puts slightly cheaper than calls - unusual given bearish positioning)
- 🎯 The January 30 $162 put strike sits just outside the weekly expected range
🎪 Catalysts
📅 Upcoming Events (Next 2 Weeks - This is Why the Trade Matters!)
| Date | Event | Company/Metric | Weight in XLI |
|---|---|---|---|
| Jan 22 | Q4 Earnings | GE Aerospace | 6.81% |
| Jan 27 | Q4 Earnings | Union Pacific | 2.72% |
| Jan 27 | Q4 Earnings | Boeing | 3.69% |
| Jan 27 | Q4 Earnings | RTX Corp | 5.07% |
| Jan 29 | Q4 Earnings | Honeywell | 2.64% |
| Late Jan | Q4 Earnings | Caterpillar | 5.80% |
Combined, these companies represent 26.73% of XLI. That's over a quarter of the ETF reporting in a 7-day window!
⚠️ Recent Headwinds (Already Happened)
- 📉 ISM Manufacturing PMI: Fell to 47.9 in December 2025 - lowest since October 2024, signaling manufacturing contraction (Trading Economics)
- 📊 Production-Orders Gap: Widest since the 2008 financial crisis per S&P Global
- 💰 Deere Guidance: CEO stated "2026 will mark the bottom of the large ag cycle" with net income guidance of $4.0B-$4.75B vs. $5.2B consensus (Illinois Farm Policy)
- 📋 Executive Order: January 7 order targeting defense contractors who prioritize buybacks over production - potential impact on RTX and Boeing (Seeking Alpha)
✅ Bullish Catalysts Already in Play
- 🛫 GE Aerospace Q3: Revenue up 26% YoY, military engine deliveries surged 83% (Aviation Outlook)
- 🏗️ Caterpillar Q3: Record revenue of $17.6B, all-time high backlog of $39.8B (Yahoo Finance)
- 🛡️ RTX Backlog: $236B (+15% YoY), recent $1.7B Patriot contract with Spain (RTX News)
- ⚡ Eaton Data Centers: Orders up 70%, sales up 40% YoY (Eaton Press Release)
- 🏛️ Defense Budget: DoD FY2026 request of $961.6B (+13.4% YoY) (TD Economics)
🎲 Price Targets & Probabilities
Based on gamma levels, implied moves, and the current catalyst environment:
🐻 Bear Case: $155-$158 (Probability: 20%)
What Gets Us Here:
- Multiple earnings misses from top holdings
- ISM PMI continues declining below 47
- Boeing reports worse-than-expected cash burn
- Tariff uncertainty escalates
The $155 strike shows significant put gamma ($6.5M total GEX), indicating institutional hedging. This represents a ~5% drop from current levels, which aligns with the quarterly implied move floor of $155.50.
⚖️ Base Case: $160-$165 (Probability: 55%)
What Gets Us Here:
- Mixed earnings results (some beats, some misses)
- Market digests the earnings cluster without major surprises
- XLI oscillates between gamma support at $162 and resistance at $165
The $162-$163 range has heavy gamma support, and $165 acts as a ceiling. This is where market makers will likely pin the ETF through OpEx.
🐂 Bull Case: $168-$172 (Probability: 25%)
What Gets Us Here:
- GE Aerospace and RTX beat and raise guidance
- Boeing production ramp progresses smoothly
- Infrastructure spending announcements accelerate
- Manufacturing PMI rebounds above 50
The quarterly implied move upper range is $171.31, which aligns with this target. Analyst consensus target is $179.94 (+11% upside per TipRanks).
💡 Trading Ideas
🛡️ Conservative: "The Hedge and Hold"
Strategy: Buy protective puts while holding XLI shares
The Trade:
- Own 100 shares of XLI @ ~$163
- Buy 1x XLI Jan 30 $160 Put
- Estimated cost: ~$0.50-0.75/contract ($50-75 total)
Why This Works: You're protected if earnings disappoint, but you still participate in upside. The $160 strike is below the gamma support at $162, giving you a safety net through the volatile earnings period.
Max Loss: Limited to premium paid + any drop to $160 Target Exit: After January 29 Honeywell earnings
⚖️ Balanced: "The Earnings Straddle Fade"
Strategy: Sell a strangle after IV expansion
The Trade:
- Wait for Jan 21-22 (before GE reports)
- Sell 1x XLI Feb 21 $158 Put
- Sell 1x XLI Feb 21 $170 Call
- Estimated premium collected: ~$2.50-3.00/contract spread ($250-300 total)
Why This Works: IV typically spikes before major earnings clusters and contracts after. The gamma analysis shows strong support at $155 and resistance at $165, making moves outside $158-$170 unlikely. You profit from elevated premium decay.
Max Profit: Full premium collected if XLI stays between $158-$170 Risk: Unlimited on upside, significant on downside (use stop-loss at 2x premium collected)
🚀 Aggressive: "Follow the Whale"
Strategy: Piggyback on the institutional bearish bet
The Trade:
- Buy 5x XLI Jan 30 $161 Puts
- Estimated cost: ~$0.70-0.90/contract ($350-450 total)
Why This Works: The whale paid $1.6M for $162 puts - they clearly expect weakness. The $161 strike gives you a slightly cheaper entry with similar directional exposure. If any of the major holdings disappoint, XLI could quickly test the $159-$160 support level.
Target: Exit at $1.50/contract (100%+ gain) if XLI drops to $159 Stop-Loss: Exit if XLI breaks above $165 resistance Max Loss: 100% of premium paid ($350-450)
⚠️ Risk Factors
🔴 For Bearish Trades:
- Strong Earnings Surprises: GE and RTX have been crushing it - another beat could squeeze puts
- Defense Spending: $961.6B DoD budget provides tailwinds for 15%+ of the ETF
- Data Center Demand: Eaton's 70% order growth shows structural bullishness in power infrastructure
- Gamma Support: Heavy call gamma at $162-$163 may pin price and limit downside
🔴 For Bullish Trades:
- Manufacturing Contraction: ISM PMI at 47.9 with the production-orders gap at 2008 crisis levels
- Boeing Uncertainty: 777X delayed to 2027, negative cash flow expected through 2025
- Tariff Risk: $1,500/household impact in 2026, Supreme Court ruling pending (Tax Foundation)
- Agricultural Trough: Deere expects large ag equipment demand down 15-20%
- Honeywell Spinoff Risk: Execution risk on aerospace separation in H2 2026
🔴 General Risks:
- Concentrated Earnings Risk: 26.7% of ETF reporting in 7 days - single stocks can drag the whole ETF
- Valuation Concern: P/E of 27.81 is elevated vs. historical averages
- IIJA Uncertainty: Infrastructure law replacement due mid-2026 with potential spending "snapback" (Rock Products)
🎯 The Bottom Line
Real talk: A whale just made a $1.6M bet against the industrial sector right before a wall of earnings. This isn't normal activity - this is a deliberate, sized position from someone with conviction.
Here's the deal:
| If You're... | Action |
|---|---|
| 🐻 Bearish | Follow the whale with Jan 30 puts, but size appropriately (the $162 strike is right at gamma support - they might just be hedging a larger long position) |
| ⚖️ Neutral | Sell premium after IV spikes pre-earnings - the expected move looks contained between $158-$170 |
| 🐂 Bullish | Wait for a dip to $160-$161 to add exposure - strong defense spending and infrastructure tailwinds support the long-term thesis |
Mark Your Calendar:
- 📅 January 22: GE Aerospace kicks off the earnings parade
- 📅 January 27: Triple header - Boeing, Union Pacific, RTX
- 📅 January 29: Honeywell wraps it up
The gamma setup shows $162 as the line in the sand. If XLI breaks below $162 with conviction, the next stop is $155. If it holds and earnings deliver, $165-$168 is in play.
The Lesson: When a whale bets $1.6M on sector-wide weakness right before 26.7% of the ETF reports earnings, you don't ignore it - you figure out how to trade alongside it (or against it) with proper risk management.
📊 Data sourced from ThetaData options flow, GEX analysis, and public financial filings. Options involve risk and are not suitable for all investors. Past unusual activity does not guarantee future price movement. Always do your own research and consider your risk tolerance before trading.