🐻 XLI Bear Put Spread Signals Caution on Industrials!
📅 February 11, 2026 | 🔥 Unusual Activity Detected
🎯 The Quick Take
Someone just structured a $3.7M Bear Put Spread on the Industrial Select Sector SPDR Fund (XLI), betting the sector pulls back before March 20 expiration. With the trade targeting a move down to the $150-$160 zone, this institutional positioning suggests smart money sees turbulence ahead despite record backlogs at industrial heavyweights. Let's break down what they're seeing and how you can position around it.
🏭 ETF Overview
State Street Industrial Select Sector SPDR ETF (XLI) tracks the Industrial Select Sector Index, giving investors exposure to the backbone of the U.S. economy - from aerospace giants to railroads to construction equipment.
| Metric | Value |
|---|---|
| Current Price | $175.07 |
| 52-Week Range | $112.75 - $174.85 |
| AUM | $30.17B |
| Holdings | 82 stocks |
| YTD Return | +6.9% to +12.1% |
| 52-Week Return | +27.24% |
🏗️ Top 10 Holdings (39.48% of fund)
| Rank | Company | Ticker | Weight |
|---|---|---|---|
| 1 | Caterpillar Inc. | CAT | 6.52% |
| 2 | GE Aerospace | GE | 6.27% |
| 3 | RTX Corporation | RTX | 4.94% |
| 4 | GE Vernova | GEV | 4.08% |
| 5 | Boeing Co. | BA | 3.60% |
| 6 | Honeywell International | HON | ~3.5% |
| 7 | Union Pacific | UNP | ~3.3% |
| 8 | Lockheed Martin | LMT | ~3.2% |
| 9 | Deere & Co. | DE | ~3.0% |
| 10 | Uber Technologies | UBER | ~2.9% |
Source: Stock Analysis XLI Holdings
💰 The Option Flow Breakdown
📊 What Just Happened
| Time | Symbol | Buy/Sell | Call/Put | Expiration | Strike | Volume | Size | OI | Spot | Option Price | Premium | Z-Score |
|---|---|---|---|---|---|---|---|---|---|---|---|---|
| 10:02:42 | XLI | 🟢 BUY | PUT | 2026-03-20 | $150 | 38,000 | 38,000 | 1,245 | $175.07 | $0.42 | $1.6M | 26.8 |
| 10:02:42 | XLI | 🔴 SELL | PUT | 2026-03-20 | $160 | 30,000 | 30,000 | 8,520 | $175.07 | $0.70 | $2.1M | 5.75 |
Strategy Classification: Bear Put Spread (buy $150 put, sell $160 put - March expiration)
🤓 What This Actually Means
Translation for us regular folks: This is a defined-risk bearish bet. Here's how it works:
🔴 Bought 38,000 puts at the $150 strike - Paying $1.6M in premium for downside protection 🟢 Sold 30,000 puts at the $160 strike - Collecting $2.1M to offset the cost
Net Credit: ~$500K collected upfront (this is unusual - typically bear put spreads cost money)
The Z-scores here are screaming unusual:
- 26.8x on the $150 puts - This is EXTREMELY unusual activity (happening maybe a few times a year)
- 5.75x on the $160 puts - Still very unusual, well above normal trading
When someone puts on a spread like this at 10:02 AM (right after the open settles), they're positioning for a specific move. The $160 short strike is their max profit zone, while the $150 long strike defines their risk.
What's the bet? They're looking for XLI to drop from current levels (~$175) toward the $160 area by March 20. That's a potential 8.5% decline from here.
📈 Technical Setup / Chart Check-Up
YTD Performance
XLI has been on a tear, up nearly 12% year-to-date and trading near all-time highs at $175.07. The ETF has rallied +27% over the past 52 weeks, benefiting from infrastructure spending and defense sector strength.
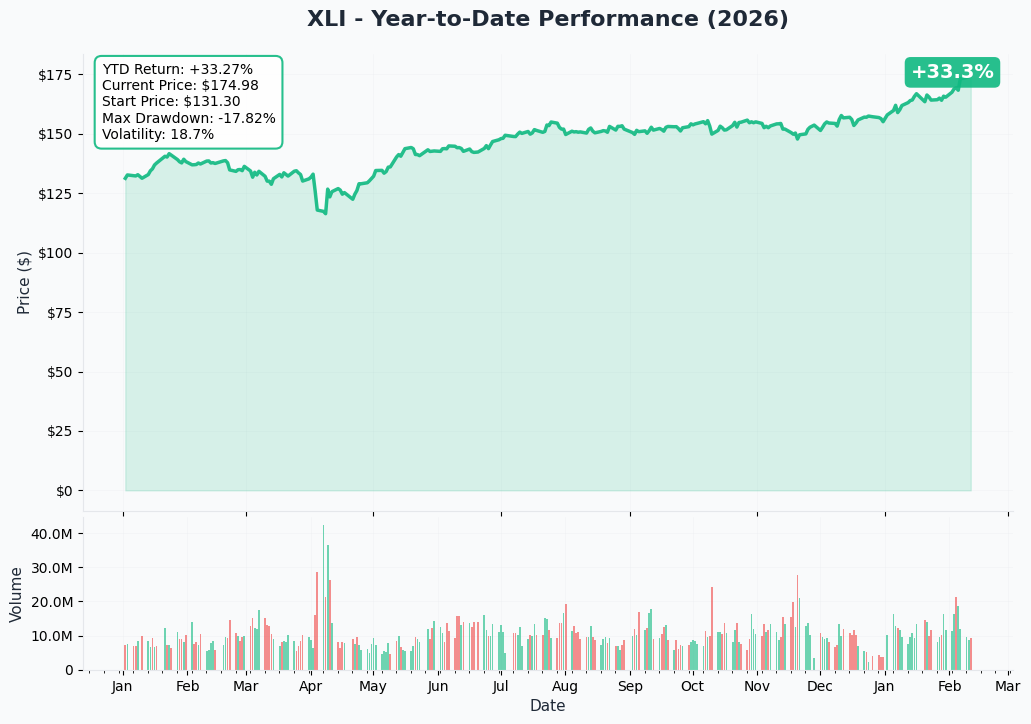
The ETF is extended from its moving averages after this strong run, which could explain why smart money is looking for a pullback opportunity.
🔵🟠 Gamma-Based Support & Resistance Analysis
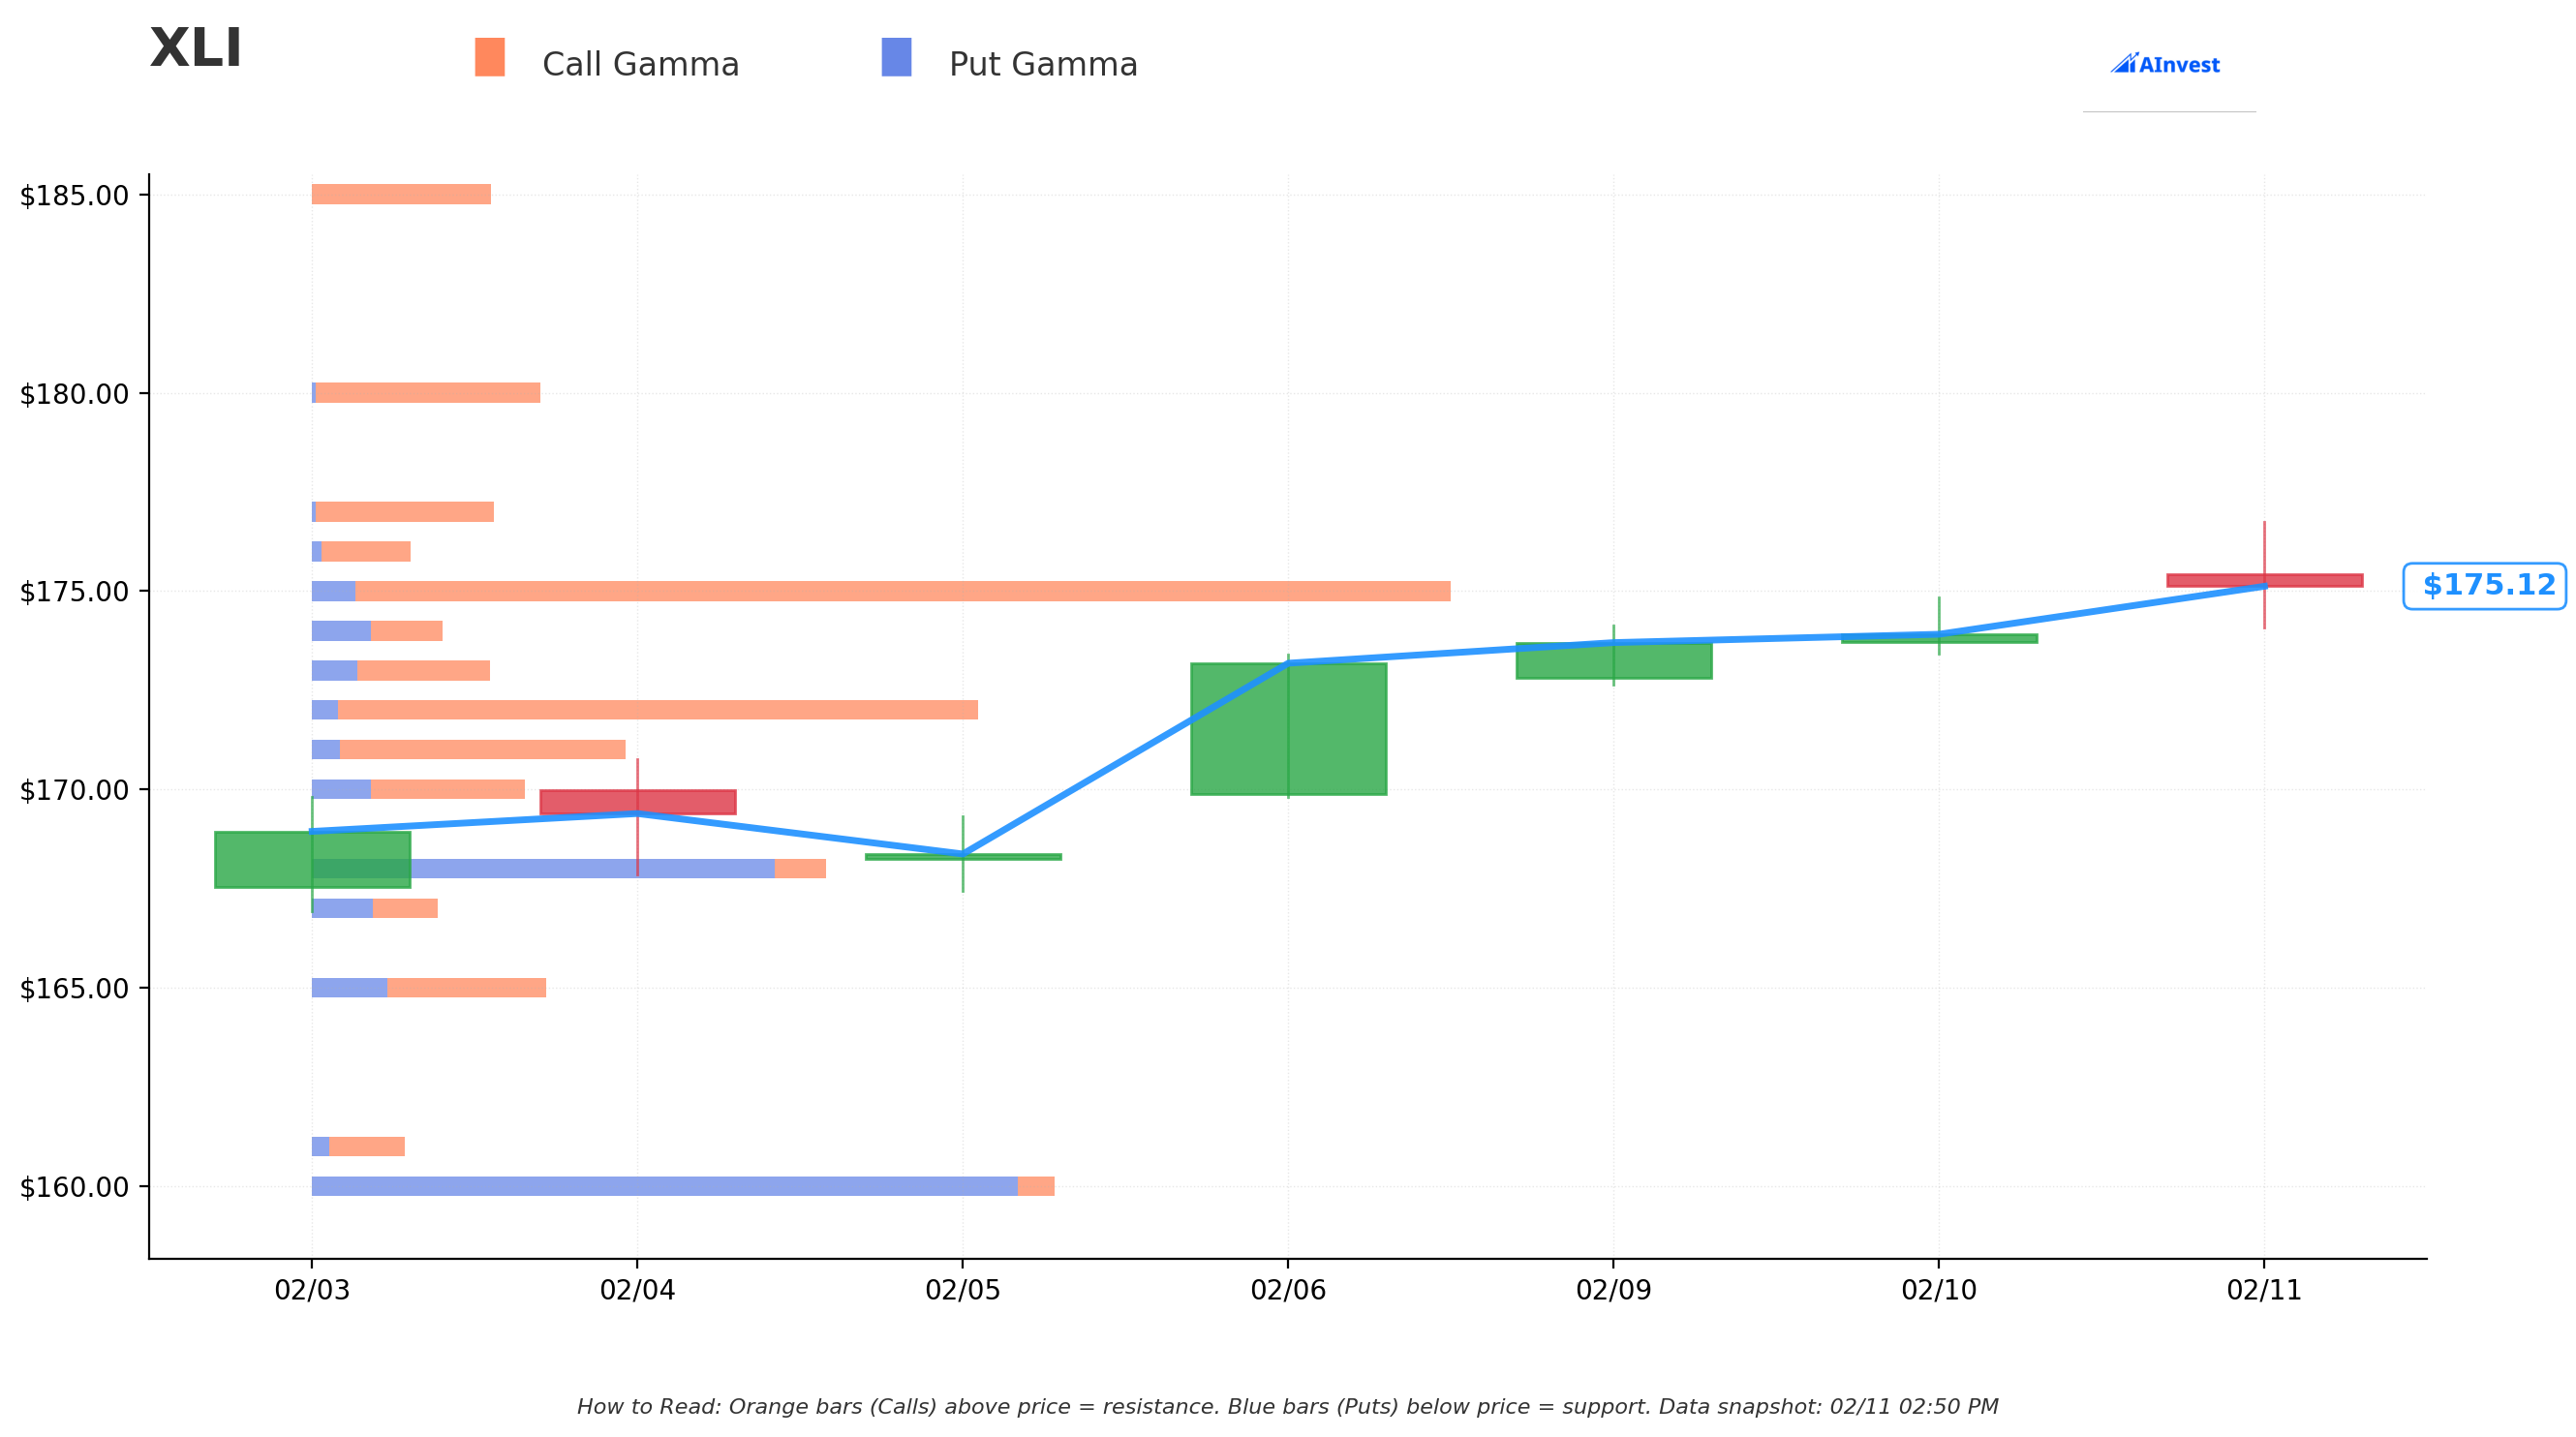
What the Gamma Levels Tell Us:
| Level | Type | Strike | Net GEX | Significance |
|---|---|---|---|---|
| 🟠 Resistance | Call Wall | $180 | +3.61 | Key upside target |
| 🔵 Strong Support | Gamma Wall | $175 | +17.26 | Current floor |
| 🔵 Support | Mixed | $172 | +10.10 | Secondary support |
| 🔵 Support | Mixed | $170 | +1.56 | Minor support |
| 🔴 Put Gamma | Dealer Short | $168 | -6.85 | Potential acceleration zone |
| 🔴 Major Put Wall | Dealer Short | $160 | -11.08 | Heavy put concentration |
| 🔴 Put Gamma | Dealer Short | $145 | -5.87 | Worst-case floor |
Gamma Analysis Summary:
- Total Call GEX: 64.26 (bullish positioning)
- Total Put GEX: 48.14 (bearish positioning)
- Net Bias: Bullish overall, but significant put gamma below
The $175 strike is a MASSIVE gamma wall - that's why the ETF has been pinned here. If price breaks below $172, the negative gamma kicks in at $168 and $160, which could accelerate selling. This aligns perfectly with the bear put spread targeting $160!
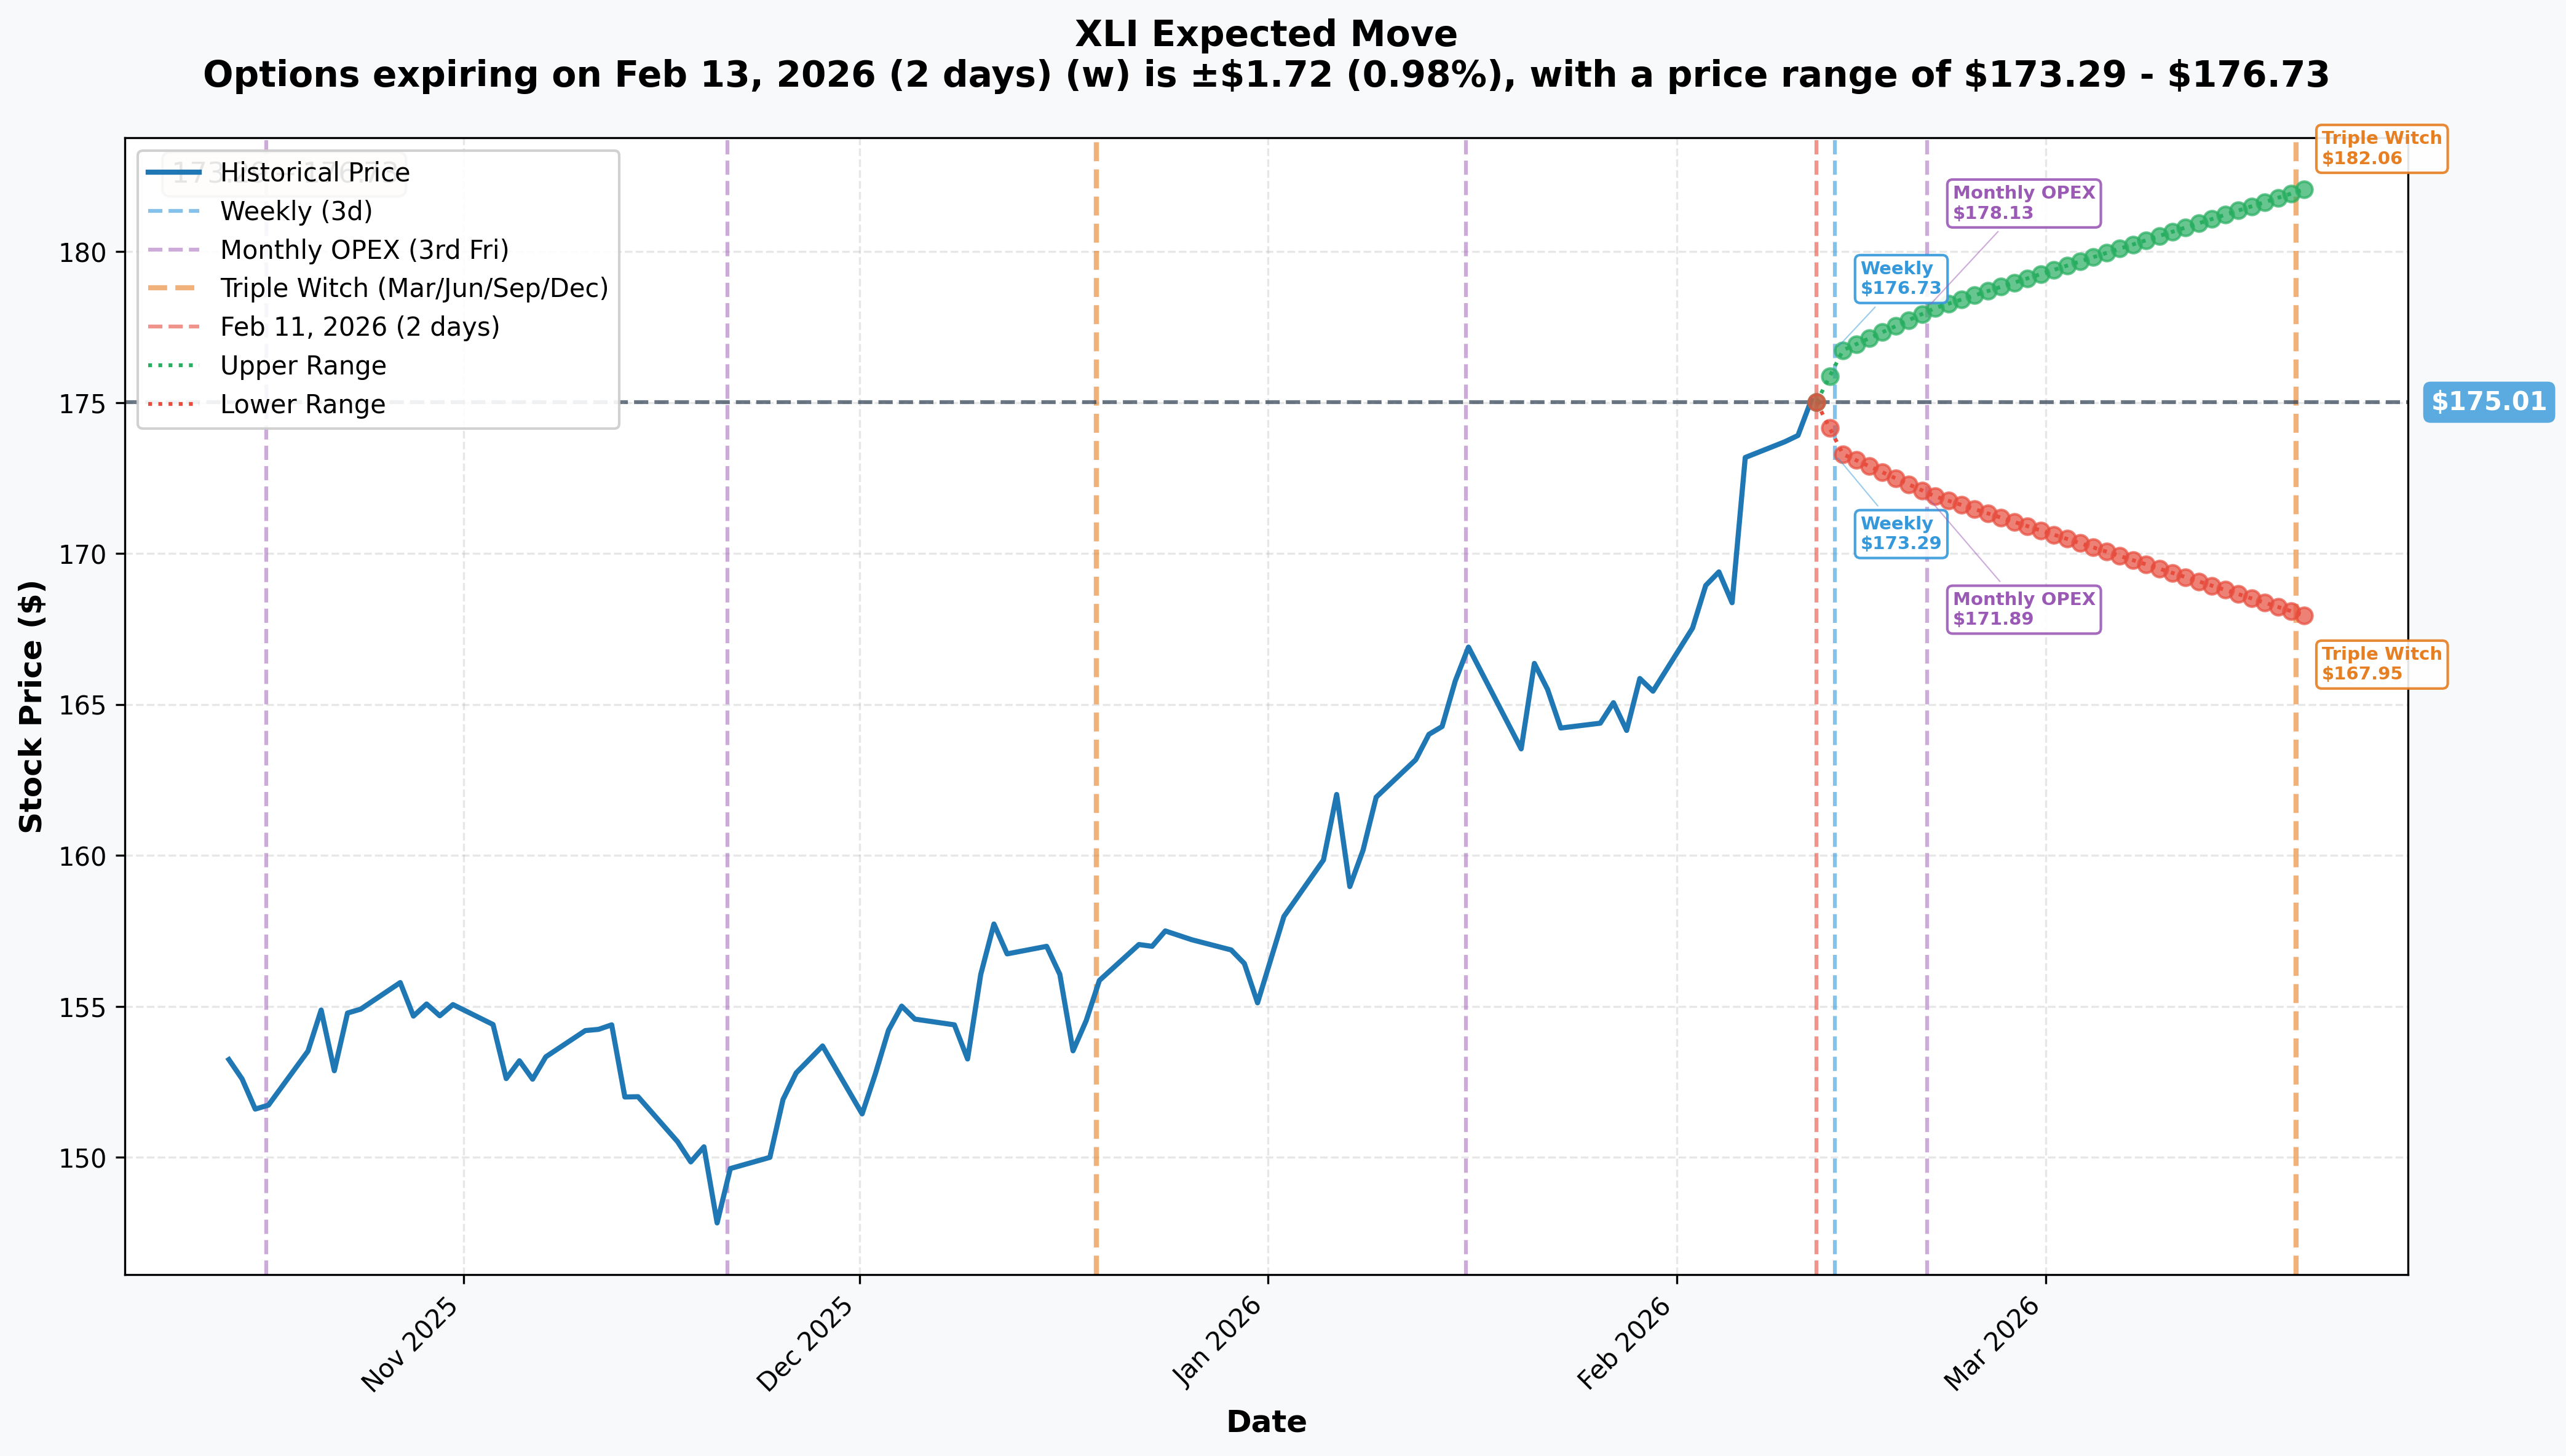
📊 Implied Move Analysis
| Timeframe | Expiry | Days | Implied Move | Range |
|---|---|---|---|---|
| Weekly | 2026-02-13 | 2 | ±0.98% | $173.29 - $176.73 |
| Monthly OPEX | 2026-02-20 | 9 | ±1.78% | $171.89 - $178.13 |
| Triple Witch | 2026-03-20 | 37 | ±4.03% | $167.95 - $182.06 |
Key Insight: The bear put spread's $160 strike sits BELOW the implied move range for March 20 ($167.95 lower bound). This suggests the trader is either:
- Betting on a larger-than-expected move
- Positioned for a tail risk event
- Using the spread as portfolio protection with the collected premium as a sweetener
🎪 Catalysts
📅 Upcoming Events
| Date | Event | Relevance |
|---|---|---|
| Feb 18, 2026 | Fed Industrial Production (Jan) | Sector health indicator |
| Late Feb 2026 | Durable Goods Orders (Jan) | Order book trends |
| Mar 3, 2026 | ISM Manufacturing PMI (Feb) | Expansion confirmation |
| Mar 18-19, 2026 | FOMC Meeting | Rate decision (hold expected) |
| Q1 2026 | Boeing 737 MAX 7/10 FAA Certification | Production milestone |
| Q1 2026 | Tariff Impact Peak | ~$800M hit to CAT in Q1 |
| Q3 2026 | Honeywell Aerospace Spin-off | Major restructuring |
✅ Recent Catalysts (Already Happened)
Bullish Developments:
- 🟢 ISM Manufacturing PMI at 52.6% - First expansion in 12 months, strongest since 2022
- 🟢 Caterpillar Q4 record revenue of $19.1B (+18% YoY), backlog at $51.2B
- 🟢 GE Aerospace orders +74% YoY, backlog ~$190B
- 🟢 RTX record backlog at $268B
- 🟢 Lockheed Martin backlog $194B (+17% YoY)
Bearish Developments:
- 🔴 Tariffs at highest level since 1946 - 10.1% effective rate
- 🔴 Caterpillar facing $2.6B in tariff costs for 2026
- 🔴 72,000 manufacturing jobs lost since April 2025
- 🔴 Deere guiding down - FY2026 income expected at $4.0-$4.75B vs $5.03B in FY2025
- 🔴 Honeywell Industrial Automation weak in Europe/China
🎲 Price Targets & Probabilities
Based on gamma levels and implied move data, here's how we see XLI playing out:
🐻 Bear Case (What the spread trader is betting)
Target: $160-$165 Probability: 15-20% Scenario: Tariff concerns escalate, ISM PMI reverses, or broader market correction drags industrials down. The negative gamma below $168 accelerates selling to the massive put wall at $160.
⚖️ Base Case
Target: $171-$178 Probability: 55-60% Scenario: XLI consolidates around the $175 gamma wall, oscillating within the monthly implied move range. Record backlogs support prices, but tariff headwinds cap upside.
🐂 Bull Case
Target: $180-$185 Probability: 20-25% Scenario: ISM confirms sustained expansion, Boeing certification news, or defense spending boost. Break above $180 resistance opens path to new highs. Analyst consensus target is $179.94.
💡 Trading Ideas
🛡️ Conservative - "The Insurance Policy"
Strategy: Buy XLI shares + protective put spread
If you own XLI and want downside protection without paying full put premium:
- Own: 100 shares of XLI @ $175
- Buy: 1 March 20 $170 Put @ ~$2.00
- Sell: 1 March 20 $165 Put @ ~$1.00
Cost: ~$100 for $500 of protection Breakeven: $176 (slight drag on upside) Max Loss: $600 (if XLI falls to $165) Best For: Long-term holders wanting cheap insurance
⚖️ Balanced - "Follow the Flow"
Strategy: Bear Put Spread (similar to the institutional trade)
- Buy: 1 March 20 $172 Put @ ~$3.50
- Sell: 1 March 20 $165 Put @ ~$1.50
Cost: ~$200 per spread Max Profit: $500 (if XLI at or below $165) Max Loss: $200 (premium paid) Breakeven: $170 Best For: Traders expecting a pullback but wanting defined risk
🚀 Aggressive - "The Contrarian"
Strategy: Sell put spread (bullish bet against the bears)
If you think the bear put spread trader is wrong and XLI holds up:
- Sell: 1 March 20 $165 Put @ ~$1.50
- Buy: 1 March 20 $160 Put @ ~$0.90
Credit: ~$60 per spread Max Profit: $60 (if XLI stays above $165) Max Loss: $440 (if XLI below $160) Breakeven: $164.40 Best For: Bulls who trust the gamma support and record backlogs
⚠️ Risk Factors
For the Bears (and the spread trader):
- 🔴 Record backlogs at major holdings provide multi-year revenue visibility
- 🔴 ISM Manufacturing just returned to expansion - momentum is bullish
- 🔴 Defense spending entering "rearmament super-cycle" with $3.6T projected by 2030
- 🔴 Strong gamma support at $175 and $172 may limit downside
For the Bulls:
- 🔴 Tariffs at 1946 highs creating margin pressure ($2.6B hit to CAT alone)
- 🔴 Manufacturing job losses of 72,000 despite pro-manufacturing policies
- 🔴 Agricultural cycle bottom (Deere weakness) and Honeywell automation struggles
- 🔴 Extended technicals after 27% 52-week rally
- 🔴 Fed only one cut expected in 2026, keeping rates elevated
Macro Risks:
- ⚠️ FOMC rate decision uncertainty (March 18-19)
- ⚠️ China/Europe weakness affecting multinational supply chains
- ⚠️ Ukraine peace talks could reduce European defense urgency
🎯 The Bottom Line
Real talk: A $3.7M bear put spread on XLI with Z-scores of 26.8x and 5.75x is absolutely worth paying attention to. This is sophisticated institutional positioning, not retail noise.
Here's the deal:
📈 If you're bullish on industrials: The record backlogs (CAT: $51.2B, GE: $190B, RTX: $268B, LMT: $194B) and ISM expansion to 52.6% support the fundamental case. Use pullbacks to the $172-$175 gamma support zone to add exposure. Consider selling put spreads to collect premium if you're willing to own at lower prices.
🤔 If you're watching from the sidelines: Wait for a test of the $172 support level before making a move. The March Triple Witch (March 20) is the key date - that's when this spread expires and we'll see who was right.
🐻 If you're bearish or hedging: The institutional trader's playbook is laid out for you. A bear put spread targeting $160-$165 gives you defined risk exposure to the downside. Mark your calendar for February 18 (Industrial Production data) and March 3 (ISM PMI) - these could be the catalysts that move the needle.
The smart money's message: Even with record fundamentals, the sector is vulnerable to tariff headwinds and extended technicals. Protect your gains or position for a pullback - just do it with defined risk.
Disclaimer: Options involve significant risk and are not suitable for all investors. The information provided is for educational purposes only and should not be considered investment advice. Always do your own research and consider your risk tolerance before trading options. Past performance does not guarantee future results.