🐻 XLI 5-Leg Put Complex — $38.4M Bet That Industrials Need a Parachute Near All-Time High
📅 March 13, 2026 | 🔥 Unusual Activity Detected
🎯 The Quick Take
Someone just deployed $38.4 MILLION in a coordinated 5-leg put structure on XLI this morning — and all five legs hit the tape at the exact same timestamp (10:34:46). That kind of simultaneous multi-leg execution does not happen by accident. This is a sophisticated institution restructuring their entire put book on U.S. industrials, right as the sector sits 7.4% off its all-time high.
This is NOT a simple bearish bet. It is a put diagonal/ratio complex — buying downside protection with longer-dated Apr 24 expiry, closing out existing short puts at $166 and $150 (removing the short caps), and simultaneously opening a fresh short put floor at $145 (collecting income). Net effect: more downside protection than before, while collecting premium. Someone with a massive industrials long position is upgrading their hedge — and they are doing it with surgical precision.
The three most important numbers in this trade: $166 (strongest GEX resistance, 0.54% away — they just CLOSED their short puts here, a secondary bullish signal), $160 (GEX key support at 3.1% away AND the implied move lower bound at $160.49 — they bought 40,000 puts here), and $145 (deep GEX support at 12.2% away — they opened a new short put here). These strikes did not come from a random options screener. This institution knows the GEX map cold.
For the full trade breakdown and analysis, see the complete article on ainvest.
📊 ETF Overview
XLI — Industrial Select Sector SPDR ETF is the benchmark ETF for the industrial sector of the S&P 500, tracking 82 companies across aerospace & defense, machinery, construction equipment, electrical equipment, and transportation. With approximately $25B in AUM and an expense ratio of 0.09%, it is the primary institutional vehicle for sector-level industrial exposure.
- 💰 AUM: ~$25 Billion
- 🏢 Holdings: 82 S&P 500 industrial companies
- 📈 Current Price: $165.105
- 📊 Expense Ratio: 0.09% | P/E: ~22x
- 🎯 52-Week Range: $112.75 – $179.31
- 🏆 Recent ATH: $179.31 (hit in early March 2026)
Top Holdings (March 2026):
| Holding | Weight | Why It Matters |
|---|---|---|
| GE Aerospace | 6.64% | Aviation recovery + defense engine orders |
| Caterpillar | 6.35% | IIJA construction + mining equipment |
| RTX Corporation | 5.19% | Patriot missiles, Pratt & Whitney engines |
| GE Vernova | 4.23% | Data center power grid buildout |
| Boeing | 3.30% | 737 MAX production ramp |
GE Aerospace, Caterpillar, and RTX alone represent roughly 18% of the fund. Nearly 20% of XLI is tied to aerospace and defense — meaning the fund is highly sensitive to government defense spending, aviation trends, and the AI-driven power infrastructure boom. When these names deliver, XLI outperforms. When they disappoint together, the whole ETF feels it.
💰 The Option Flow Breakdown
The Tape (March 13, 2026 @ 10:34:46) — All 5 Legs Fire Simultaneously:
| Time | Symbol | Side | Buy/Sell | Type | Expiration | Premium | Strike | Volume | OI Before | Spot |
|---|---|---|---|---|---|---|---|---|---|---|
| 10:34:46 | XLI | ASK | BUY | PUT $160 | 2026-04-24 | $14.0M | $160 | 40,000 | 0 (new) | $165.105 |
| 10:34:46 | XLI | BID | SELL | PUT $166 | 2026-04-17 | $10.0M | $166 | 27,000 | high (Z=2.94) | $165.105 |
| 10:34:46 | XLI | BID | SELL | PUT $145 | 2026-04-24 | $6.1M | $145 | 48,000 | 0 (new) | $165.105 |
| 10:34:46 | XLI | BID | SELL | PUT $150 | 2026-04-17 | $4.5M | $150 | 34,000 | high (Z=2.95) | $165.105 |
| 10:34:46 | XLI | BID | SELL | PUT $166 | 2026-04-17 | $3.8M | $166 | 7,300 | moderate | $165.105 |
Total: ~$38.4M across all legs | All 5 executed at identical timestamp — confirmed single coordinated institutional trade.
🤓 What This Actually Means (Plain English)
This is one of the more architecturally interesting structures you will see on a sector ETF. Let's decode it leg by leg:
🛡️ Leg 1 — BUY $160 Put Apr 24 ($14M) — The Protection Floor: This is the anchor. 40,000 contracts at the $160 strike with zero prior open interest — a completely fresh opening position. This is the institution's insurance policy. If XLI drops below $160 by April 24, this put pays out dollar for dollar on notional exposure of $640M (40,000 contracts × 100 shares × $160). The Apr 24 expiry is deliberate — it extends two full weeks beyond the Apr 17 legs, bridging the entire Q1 earnings season. The $160 strike is not random: it aligns with GEX key support at 3.1% below spot AND is essentially the implied move lower bound (options pricing ±2.79%, lower range = $160.49).
💸 Legs 2 & 5 — SELL $166 Put Apr 17 ($10M + $3.8M = $13.8M combined) — Closing Existing Short Puts (STC): Both of these are sell-to-close transactions. High Z-scores (Z=2.94 on the large fill) and "high OI before" confirm these are existing short put positions being bought back and closed. The $166 strike is the single strongest GEX resistance level on the board (net GEX -18.39, 19.5 total GEX, 0.54% above current price). By closing these short $166 puts, the institution removes its own short position right at resistance. This is the most underappreciated signal in the trade: they do NOT want to be short the $166 strike as XLI pushes against that gamma wall. Closing here is mildly bullish — it removes a ceiling on their upside participation if XLI recovers.
🎯 Leg 4 — SELL $150 Put Apr 17 ($4.5M) — Closing Another Short Put (STC): Also a sell-to-close (Z=2.95, high OI before). The institution had existing short $150 puts expiring Apr 17 and is cleaning those up as well. Two legs of short put cleanup on the Apr 17 expiry — they are exiting legacy positions ahead of earnings season.
📉 Leg 3 — SELL $145 Put Apr 24 ($6.1M) — Opening New Short Put Floor (STO): This is the only new opening position on the sell side. 48,000 contracts at $145 — fresh open interest, same Apr 24 date as the long $160 put. The institution is collecting $6.1M in income by accepting assignment risk below $145. That strike sits exactly at the $145 GEX deep support level (12.2% below spot). They are effectively saying: "XLI is not going below $145, and we'll take that risk for income."
Net Structure — What The Institution Built:
After all five legs, the position is:
- ✅ Long $160 put (Apr 24) — full protection if XLI breaks down below $160
- ✅ Short $145 put (Apr 24) — accepts assignment risk below $145, collects income
- ✅ Closed out short $166 puts (Apr 17) — removed upside cap at strongest resistance
- ✅ Closed out short $150 puts (Apr 17) — cleaned near-term put book
The bottom line: This institution is LONG XLI and just upgraded the quality of their hedge. They replaced shorter-dated short puts (Apr 17 at $150 and $166) with a better-structured package — longer-dated protection at $160 financed by deep short puts at $145. They also removed the constraint that had them short at the exact resistance level. This is a sophisticated portfolio manager doing pre-earnings risk management, not a trader betting on a crash.
📈 Technical Setup / Chart Check-Up
YTD Performance Chart
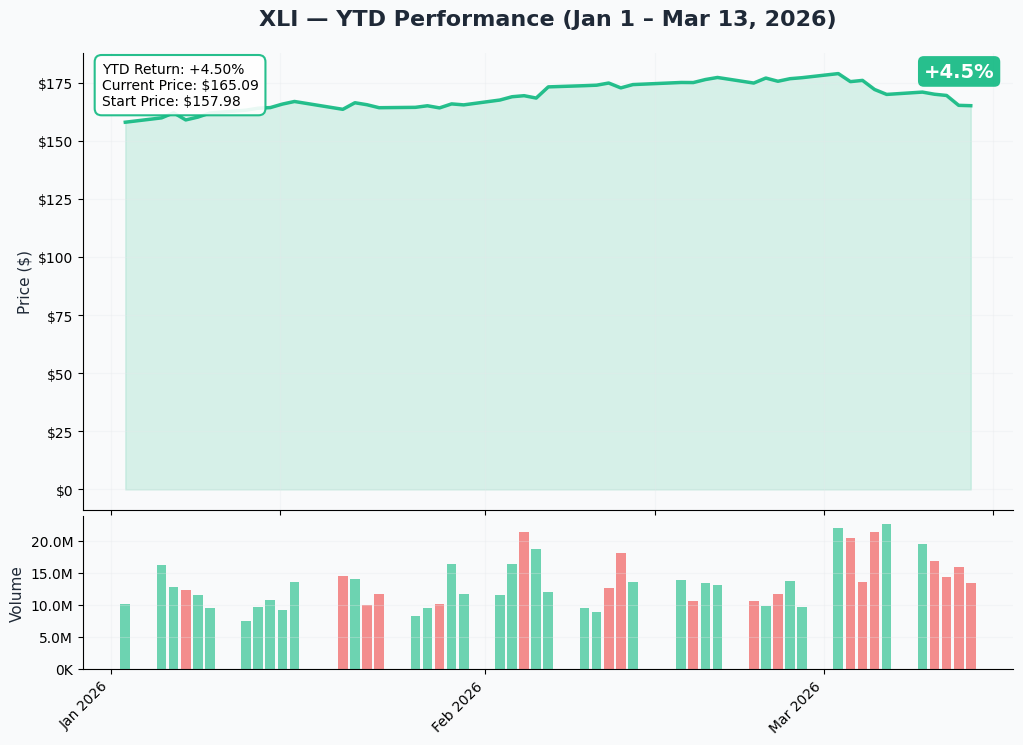
XLI currently trades at $165.105, retreating roughly 7.4% from its all-time high of $179.31 set in early March 2026. The ETF had a remarkable 21% gain in the prior quarter, driven by AI data center infrastructure demand (power transformers, switchgear, HVAC), elevated defense budgets, and accelerating IIJA disbursements. The pullback from $179 to $165 in a matter of weeks is sharp but orderly — classic "buy the news, sell the reality" behavior after a monster run where the sector got well ahead of near-term fundamentals.
Key observations:
- 📉 7.4% off ATH in weeks: The retreat from $179.31 is sharp enough to put the $160-$164 prior breakout zone directly in scope — this is the last major consolidation base before the ATH push
- 🔄 Earnings season risk window: The April expirations on today's structure are not accidental — Q1 earnings for GE Aerospace, Caterpillar, RTX, and Boeing all fall in that window
- 💰 22x P/E near ATH: Not cheap for an industrial ETF. Fair value for the sector historically sits closer to 18-19x, suggesting some premium baked in for AI/defense tailwinds that needs to be validated by April earnings
- 📊 Smart money moving: A $38.4M coordinated put structure is the clearest signal that institutional players are locking in hedges after that 21% quarterly surge
Gamma-Based Support & Resistance Analysis
Current Price: $165.105
The GEX map tells a clear story: XLI is pinned in a narrow band between the heaviest nearby support ($165.00, just 0.06% below) and the heaviest nearby resistance ($166.00, just 0.54% above). The overall net GEX bias is decisively bearish — put GEX crushes call GEX by nearly 3:1.
🔵 Support Levels (Below Price):
| Strike | Total GEX | Net GEX | Distance | Notes |
|---|---|---|---|---|
| $165 | 15.1 | -4.15 | 0.06% | Immediate floor — price resting here |
| $164 | 10.7 | -9.18 | 0.67% | Secondary support if $165 breaks |
| $160 | 9.2 | -6.86 | 3.1% | KEY SUPPORT — long put strike + implied move floor |
| $150 | 12.3 | -11.46 | 9.1% | Deep put wall, near prior structure |
| $145 | 13.4 | -13.21 | 12.2% | Outer boundary — new short put strike |
🟠 Resistance Levels (Above Price):
| Strike | Total GEX | Net GEX | Distance | Notes |
|---|---|---|---|---|
| $166 | 19.5 | -18.39 | 0.54% | STRONGEST RESISTANCE — where institution closed short puts |
| $169 | 5.6 | +3.35 | 2.4% | First call-dominant level above the wall |
| $170 | 10.1 | -6.70 | 3.0% | Mixed, still put-heavy |
| $171 | 10.7 | -3.44 | 3.6% | Cluster resistance $170-$171 |
| $175 | 7.0 | +2.23 | 6.0% | Call-dominant — first real rally target zone |
What this means for traders: The $166 strike is a genuine ceiling. With 19.5 total GEX and net GEX of -18.39 (almost entirely put-driven), market makers are heavily hedged there and must sell XLI as price approaches $166 — creating mechanical resistance. This is exactly why the institution closed their short $166 puts: they do not want to be competing against that resistance on the sell side. A break above $166 would require overwhelming buying pressure to push through dealer hedging flows. If it breaks, the next meaningful resistance is not until $169-$170.
On the downside, the $160 level deserves special attention: it is a GEX key support (9.2 total GEX), the strike where the institution just bought 40,000 puts, AND the implied move lower bound ($160.49). Three independent signal sources converging at the same strike. That is the gamma battlefield for the next six weeks.
Net GEX Bias: 🐻 Bearish (put GEX 120.4 vs call GEX 43.9) — market makers are net short gamma overall. In a declining market, this structure amplifies moves lower as dealers must sell more to hedge. The GEX structure is not a friend to XLI bulls right now.
Implied Move Analysis
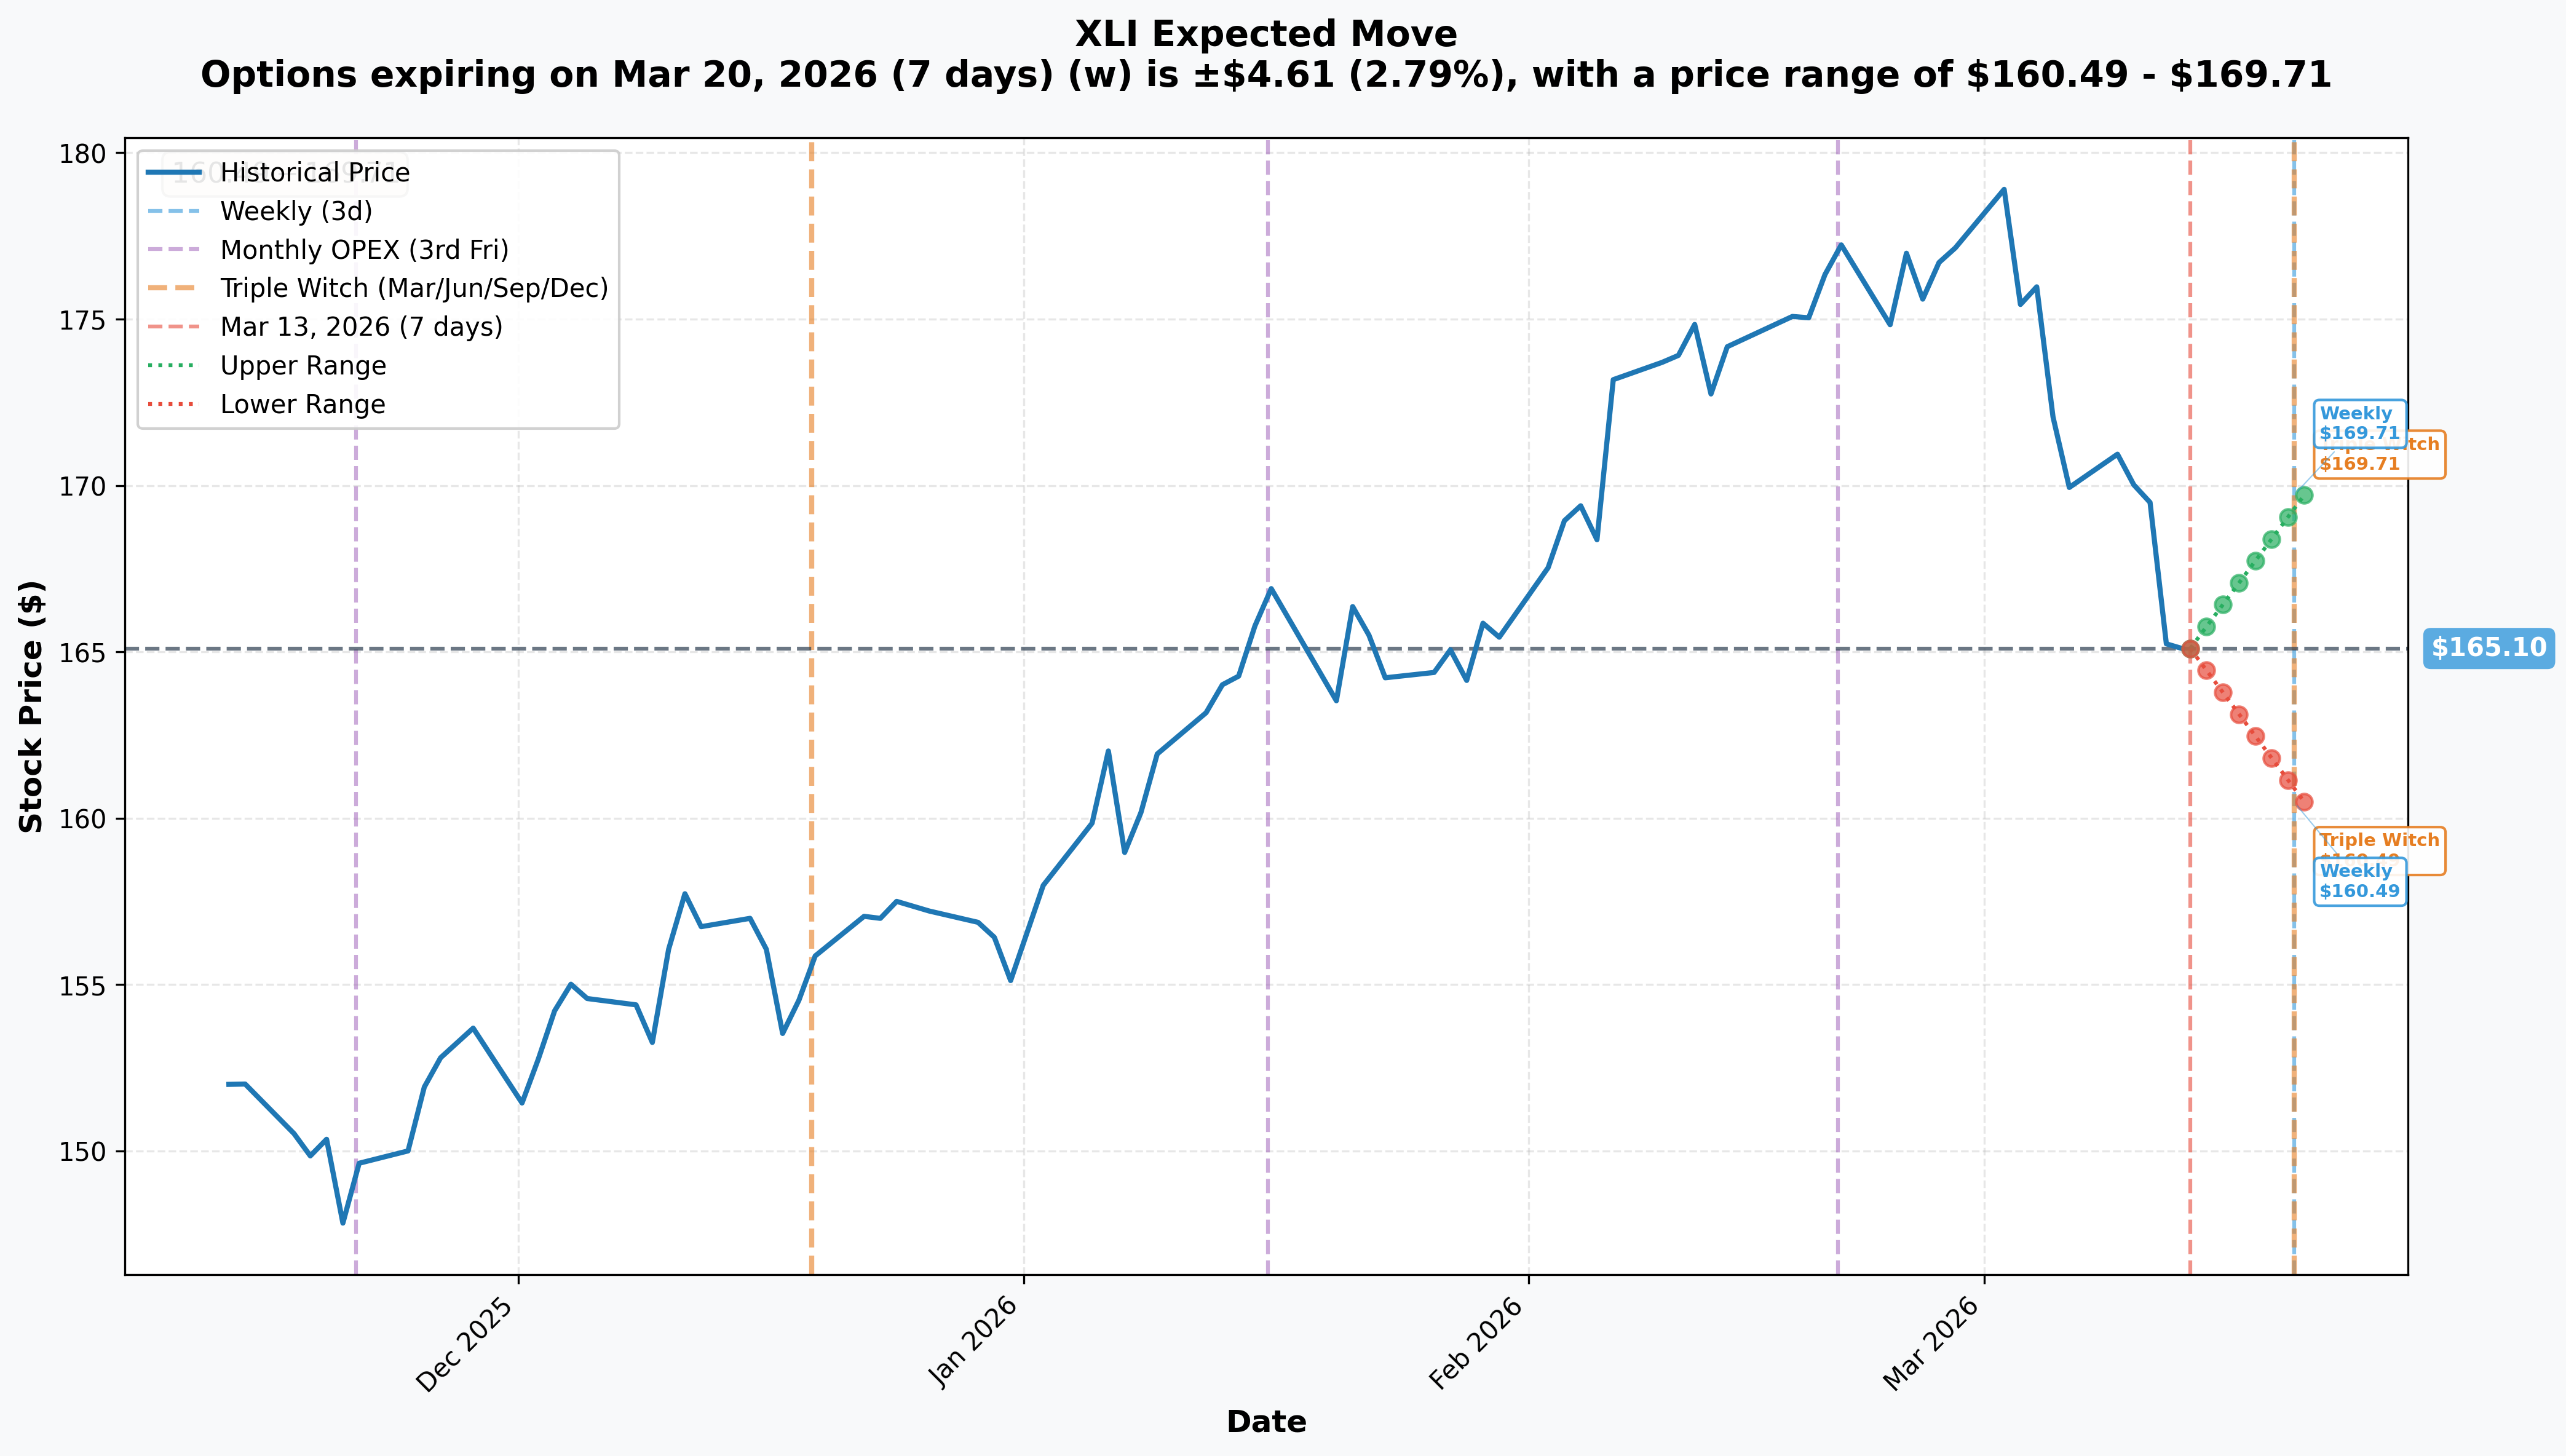
Options market pricing for upcoming expirations:
| Expiry | Days Out | Implied Move | Upper Range | Lower Range |
|---|---|---|---|---|
| Mar 20 (Triple Witch / Weekly OPEX) | 7 days | ±$4.61 (±2.79%) | $169.71 | $160.49 |
Translation for regular folks: The options market is pricing a 2.79% move ($4.61) by next Friday's Triple Witch expiration (March 20). That puts the lower bound at $160.49 — essentially the exact $160 strike where the institution just bought 40,000 put contracts for $14M. This alignment is NOT a coincidence. The institution ran the implied move math, identified $160 as the statistical downside boundary for the next 7 days, and bought protection exactly there.
The upper bound at $169.71 fits neatly between the $169 and $170 GEX resistance levels. The market's expected range for the week is bracketed almost perfectly by the existing GEX structure — which tells you the institutions that set option prices and the ones executing large trades are all reading the same gamma map.
For the Apr 17 and Apr 24 expirations (5-6 weeks out), a reasonable approximation suggests the expected range expands to roughly $155–$175, which encompasses both the $160 protection strike and the $145 short put floor with meaningful probability on each side.
🎪 Catalysts
🔥 Recent Catalysts (Last 3 Months)
XLI Hits All-Time High in Early March 2026 🏆
The Industrial Select Sector SPDR achieved a new ATH at $179.31 in early March 2026, the culmination of a remarkable 21% prior-quarter gain that made XLI the best-performing sector SPDR heading into 2026. The rally was driven by three converging forces: AI data center power infrastructure demand (GE Vernova, Eaton, Emerson leading), elevated global defense budgets (RTX, Northrop, L3Harris), and IIJA construction spending acceleration (Caterpillar, Deere). The current pullback to $165 is the context — the institution has profits to protect.
GE Aerospace Q4 2025 Beat — Aviation + Defense Strength 🛩️
GE Aerospace (6.64% of XLI, the largest single holding) reported strong Q4 2025 results driven by commercial aviation recovery and defense engine orders. The LEAP engine backlog for Boeing 737 MAX and Airbus A320neo remains deep, providing multi-year revenue visibility. Strong GE performance has been the primary single-stock driver of XLI's outperformance — which also means GE's April Q1 report carries outsized risk.
Caterpillar — IIJA + Mining Cycle Resilience 🏗️
Caterpillar (6.35%) demonstrated resilient demand in Q4 2025 despite macro noise, benefiting from IIJA-driven construction activity and mining equipment demand tied to energy transition metals (copper, lithium). The mining upcycle driven by battery metal demand has proven durable through multiple rate uncertainty cycles.
Defense Sector Tailwinds — RTX, L3Harris, Northrop 🛡️
Elevated geopolitical tensions (NATO expansion, Ukraine, Middle East) have driven defense budgets globally higher. RTX (5.19%) benefits from Patriot missile system demand, Raytheon radar upgrades, and Pratt & Whitney engine orders. U.S. defense authorization for FY2026 remains above $900B — a structural floor supporting roughly 20% of XLI's portfolio.
AI / Data Center Power Infrastructure Boom ⚡
The most powerful 2026 narrative for XLI: hyperscaler data center buildout is creating urgent demand for electrical transformers, switchgear, generators, and HVAC systems with lead times stretching 12–18 months. XLI holdings Eaton, Emerson, Rockwell Automation, and GE Vernova have multi-year order backlogs forming. JPMorgan's 2026 industrials outlook specifically highlighted this as the key differentiating catalyst.
📅 Upcoming Catalysts (Next 6 Months)
Q1 2026 Earnings Season — April 2026 (THE EVENT) 📊
This is the catalyst that the April put structure is explicitly designed around. All five major XLI holdings report in April:
- 🛩️ GE Aerospace — Aviation demand update, defense margins, LEAP engine delivery pace (6.64%)
- 🏗️ Caterpillar — Construction equipment volumes, mining cycle update, tariff cost impact (6.35%)
- 🚀 RTX Corporation — Defense bookings, Pratt & Whitney engine inspection resolution, aftermarket (5.19%)
- ⚡ GE Vernova — Power grid/electrification orders, data center power backlog update (4.23%)
- ✈️ Boeing — 737 MAX delivery ramp, FAA certification progress, cash flow trajectory (3.30%)
These five companies collectively represent approximately 25% of XLI. A disappointment across even two or three of them in the same reporting window would move the ETF materially — 5-8% intraday swings are plausible. The Apr 17 and Apr 24 option expirations bracket this window with precision.
Boeing 737 MAX Production Recovery — Wildcard ✈️
Boeing (3.30%) is working to ramp 737 MAX production rates toward 38-50 planes per month in 2026 after years of quality control disruptions. FAA certification progress or production rate announcements would be meaningful positive catalysts rippling through GE Aerospace (LEAP engines), Spirit AeroSystems, and the broader aerospace supply chain within XLI. Any fresh quality issues or regulatory setbacks go the other direction fast.
Tariff / Manufacturing Reshoring — Double-Edged Sword 🔄
U.S. tariff policy is driving manufacturing reshoring which benefits industrial machinery demand in XLI. However, steel and aluminum tariff costs directly pressure margins at Caterpillar, Deere, and precision equipment makers. Q1 earnings management commentary on tariff impact will be watched closely — this could be the most common negative surprise theme in April.
U.S. Infrastructure Act Spending Acceleration 🏛️
The IIJA continues disbursing approximately $1.2 trillion in federal infrastructure commitments through 2026-2027. Bridge, road, water, and grid spending benefits construction equipment (Caterpillar) and electrical equipment makers throughout XLI. Acceleration in disbursement rates is a potential positive surprise.
March 20 Triple Witch — Near-Term Volatility Event 🎢
The next major market structure event is Triple Witching this Friday (7 days away). With XLI sitting at $165.10 — directly between the $165.00 support (0.06% below) and $166.00 resistance (0.54% above) — the March 20 expiration will create mechanical repositioning pressure. Expect active dealer hedging and potential pin pressure around the $165-$166 zone through end of next week.
🎲 Price Targets & Probabilities
Using GEX levels, implied move data, the April earnings catalyst, and the architecture of today's 5-leg structure, here are the scenarios through the Apr 24 expiration:
📈 Bull Case (25% probability)
Target: $169–$175
How we get there:
- 💪 XLI holds $165 support through Triple Witch (Mar 20) and earnings momentum builds
- 🚀 $166 GEX resistance breaks on strong volume — dealer short-covering accelerates move to $169-$170
- 📊 GE Aerospace and Caterpillar both beat Q1 2026 estimates AND raise guidance
- ⚡ GE Vernova data center power order backlog commentary surprises to the upside
- 🛡️ Defense budget clarity (no sequestration risk) removes overhang from RTX and aerospace names
- 🌐 Tariff cost concerns prove manageable — margins hold better than feared
- 📈 Break above $166 opens path to the $169-$170 cluster ($15.7 combined GEX), then $175 (6.0% away)
What happens to today's structure in bull case:
- Long $160 put: expires worthless — $14M premium lost on the hedge
- Short $145 put: expires worthless — $6.1M premium kept
- Short $166 puts already closed (STC) — clean exit
- Net: Institution pays modest net cost for protection it did not need, while underlying long position benefits from the rally. This is the intended best-case scenario for a hedger.
🎯 Base Case (45% probability)
Target: $160–$166 (Earnings Chop Zone)
Most likely scenario:
- ⚖️ Mixed earnings season — GE Aerospace beats, Caterpillar guides cautiously on tariff cost pressures
- 📊 XLI trades sideways to slightly lower through April expiration, pinned between $160 support and $166 resistance
- 🔄 The gamma sandwich (put GEX 3x call GEX) keeps XLI range-bound — dealers systematically buy dips and sell rips
- ⚠️ Triple Witch March 20 creates short-term volatility but no sustained directional break
- 🤔 Sector digests the 21% quarterly gain; institutional money rotates within industrials rather than out of it
- 📅 $165 gamma support (15.1 GEX) absorbs initial selling but the $160 long put goes slightly in-the-money
What happens to today's structure in base case:
- Long $160 put: approaches breakeven but expires modestly OTM or barely ITM — partial value returned
- Short $145 put: expires worthless — full $6.1M premium kept
- Short $166 puts closed already — no exposure
- Net: Modest net cost for six weeks of earnings season protection. Institution's long position roughly unchanged. Mission accomplished from a risk management standpoint.
📉 Bear Case (30% probability)
Target: $155–$160
What could go wrong:
- 😰 Caterpillar guides Q2 conservatively citing tariff-driven margin compression — stock drops 8-10%, drags XLI down 2-3%
- 🚨 GE Vernova issues cautious commentary on data center power order timing — AI infrastructure narrative cracks
- 📉 Manufacturing ISM PMI falls below 50 again — industrial demand slowdown fears resurface
- 💥 Broader market selloff (S&P 500 breaks recent lows) drags all sectors lower simultaneously
- 🔴 XLI breaks below $165.00 support — net short gamma structure means dealers amplify the move lower
- 📉 $164 secondary support (10.7 GEX) gives way, opening gap toward $160
Critical gamma levels on the way down:
- 🛡️ $165 (15.1 GEX) — first line of defense, currently testing
- 🛡️ $164 (10.7 GEX) — secondary floor if $165 cracks
- 🛡️ $160 (9.2 GEX) — the long put strike, major gamma support AND implied move floor
- 🛡️ $150 (12.3 GEX) — deep structural wall, also where institution had prior short puts
- 🛡️ $145 (13.4 GEX) — outer boundary, the new short put floor
What happens to today's structure in bear case:
- Long $160 put: Activates below $160. Each $1 below $160 generates ~$4M in hedge value (40,000 × 100). At $155, puts worth ~$5, generating ~$20M — offsetting significant losses on the underlying long
- Short $145 put: Remains OTM unless XLI drops another 9%+ from $160 — structurally contained
- Net: The hedge works exactly as designed. Institution's downside on the long portfolio between $145 and $160 is substantially covered.
💡 Trading Ideas
🛡️ Conservative: Wait for Triple Witch Resolution Before Committing
Play: Stay patient through March 20 Triple Witch, let the $165/$166 gamma pin resolve before taking a new directional position
Why this works:
- 🧱 XLI is sandwiched between $165.00 support (0.06% below) and $166.00 resistance (0.54% above) — the worst environment for entering new positions
- 📅 Triple Witch (Mar 20, 7 days) creates mechanical repositioning flows that can whipsaw short-term trades
- 💡 Waiting costs nothing and gives you a cleaner read on near-term direction
- 📊 Post-Triple Witch, the gamma structure resets and directional trades have higher conviction
Action plan:
- 👀 Watch the $165-$166 zone this week — daily closes above $166 = confirmed resistance breakout
- 🎯 If XLI closes above $166: Consider long exposure or Apr $167-$170 call spreads targeting the $169-$170 GEX resistance zone
- 🔵 If XLI closes below $163: Respect the breakdown — next gamma support is $160, and the bear case becomes the working thesis
- ⏰ Cleanest window: after March 20 Triple Witch, with 4-5 weeks to April earnings as the next major catalyst
Risk level: Minimal | Skill level: Beginner-friendly
⚖️ Balanced: Put Debit Spread Aligned With the Institutional Thesis
Play: Buy an Apr 24 put spread targeting the move from $165 toward the $160 GEX support level
Structure: Buy Apr 24 $163 puts, Sell Apr 24 $157 puts
Why this works:
- 📊 Defined risk spread — max loss is the net debit, roughly $2.00-$2.50 per spread
- 🎯 Targets the move from current $165 toward the $160 implied move floor — the same target the institution identified
- 🐋 The $14M long put at $160 is the institution's stated thesis: they expect a test of $160 is plausible. Align with smart money directionally
- ⏰ Apr 24 expiry gives you the same extended timeline the institution chose — through the full Q1 earnings window
- 📈 Max profit: ~$5 per spread if XLI closes below $157 at expiry (~200% ROI)
- 📉 Max loss: $2.00-$2.50 net debit (fully defined)
Entry timing:
- 🎯 Best entry: a clean rejection at the $166 resistance wall — price touches $166, gets sold, closes below $165
- ⏰ Alternative entry: after Mar 20 Triple Witch if XLI shows continued weakness heading into earnings season
- ❌ Skip the trade entirely if XLI closes above $167 — the bearish near-term thesis is invalidated
Risk level: Moderate | Skill level: Intermediate
🚀 Aggressive: Fade the $166 Resistance With a Short-Dated Put Spread
Play: Buy a Mar 28 or Apr 17 put spread betting the $166 resistance holds and XLI retraces toward $160
Structure: Buy Apr 17 $165 puts, Sell Apr 17 $159 puts
Why this could work:
- 🐋 $38.4M in coordinated institutional put activity is the clearest possible signal that sophisticated money is managing downside risk on industrials RIGHT NOW
- 🧱 The $166 GEX resistance (net GEX -18.39, 19.5 total GEX) is by far the heaviest barrier on the board — dealer hedging mechanics will actively suppress any rally attempt through that level
- 🔵 XLI's net GEX bias is deeply bearish (put GEX 120.4 vs call GEX 43.9) — mechanical market structure amplifies downside moves
- 🔄 The institution closing their short $166 puts (removing their own upside cap) does NOT mean they think XLI rips higher — it means they are repositioning to benefit cleanly if it drops
- 📉 A rejection at $166 targeting $160-$162 is a 3-5% move with gamma amplification working in the bear's favor on the way down
- 💰 Elevated IV ahead of Triple Witch and earnings season makes put spreads relatively attractive sellers on the upside
Why this could blow up:
- 💥 If $166 breaks decisively to the upside (strong economic data, GE Aerospace pre-announcement), the resistance flips to support and a squeeze accelerates to $169-$170 quickly
- 🐂 The fundamental bull case (AI power infra, defense, IIJA) is structurally intact — macro positive surprise wipes the bearish thesis fast
- 📅 5-6 weeks to April expiration is a lot of time for thesis-changing headlines
- ⚠️ The 7.4% pullback from ATH means some of the near-term bearish move may already be priced in
Position sizing: High-risk, lower-probability trade. Risk only what you are comfortable losing entirely. Treat as a defined-risk directional bet, not a core position.
Risk level: HIGH | Skill level: Advanced only
⚠️ Risk Factors
Do not get caught by these potential landmines:
-
🧱 $166 resistance is 0.54% away — a break changes everything: If XLI breaks and closes above $166, the massive put gamma wall can flip from resistance to a dealer short-covering catalyst. A sustained break above $166 could accelerate toward $169-$170 quickly. Anyone in put spreads or bearish positions would face rapid adverse mark-to-market.
-
📅 Triple Witch March 20 creates near-term pinning risk: Large expiry events pull price toward key strikes. With XLI directly between the $165 support and $166 resistance, the most probable near-term outcome is a pin near $165 — not a dramatic directional move. Wait for the pin to resolve before making a high-conviction directional bet.
-
🤓 This is a HEDGE, not a directional crash call: The most important interpretation of today's $38.4M structure is that the institution is LONG XLI and protecting it. They are not predicting a sector collapse. They are a sophisticated fund manager running standard pre-earnings risk management at all-time-high levels. Do not confuse "institution hedging" with "institution expecting catastrophe."
-
📊 April earnings are a genuine binary catalyst cluster: GE Aerospace, Caterpillar, RTX, GE Vernova, and Boeing all reporting in April is a 25%-of-fund simultaneous earnings event. A strong sweep validates the ATH; a mixed or weak sweep (especially if CAT guides down on tariffs) could produce 5-8% intraday moves. The institution structured their expirations around exactly this window — follow that logic.
-
🔄 Net short gamma means moves in either direction are amplified: The overall XLI GEX structure has dealers net short gamma (put GEX 120.4 vs call GEX 43.9). In a falling market, net short gamma means dealers must sell more as price falls — accelerating the move. In a rising market, they must buy more as price rises — accelerating that too. Either way, the next sustained 5-10% move in XLI is likely to be faster than historical norms.
-
⚠️ Tariff uncertainty is an overnight headline risk: Manufacturing reshoring is bullish for XLI but tariff-driven steel and aluminum cost inflation hits Caterpillar, Deere, and precision equipment makers directly. One unexpected tariff escalation announcement can move the industrial sector 2-3% instantly — no amount of gamma support absorbs a true policy shock.
-
✈️ Boeing is the wildcard within the wildcard: At 3.3% of XLI, Boeing is the most volatile and unpredictable top-5 holding. Fresh 737 MAX quality control issues, FAA regulatory action, or production rate miss can move Boeing 5-10% on a single headline — rippling through the entire aerospace supply chain within XLI. Boeing tail risk is non-trivial.
-
🐋 The institution could be wrong, or this is a roll, not a new bet: Large options structures on sector ETFs are sometimes position rolls (closing old legs, opening new ones) rather than fresh directional conviction. The STC legs ($166 and $150 puts being closed) confirm this is partially a restructuring. Do not treat the $38.4M gross notional as equivalent to $38.4M of fresh bearish conviction.
🎯 The Bottom Line
Real talk: An institution just spent $38.4 million restructuring their entire put book on XLI, with all five legs firing at the same exact second. This is precision work. The message from the tape is clear: sophisticated money with a large long industrial position is upgrading their hedge ahead of Q1 earnings season, right after XLI hit an all-time high and pulled back sharply.
What this trade is really telling us:
- 🏆 The institution has meaningful unrealized gains from that 21% quarterly run and wants to protect them through April earnings — this is rational at-the-money risk management, not panic hedging
- 🎯 The $160 strike is the three-way convergence point: GEX key support, implied move lower bound ($160.49), AND where they paid $14M for protection — three independent signals agreeing on the same level
- 🔵 Closing the short $166 puts is the most underappreciated signal: they removed their own short position at the exact strongest resistance level (0.54% above price), clearing themselves to participate fully in any upside rally without their own position acting as a ceiling
- 📅 The Apr 24 expiry for the protection leg (two full weeks past Apr 17) tells you they want coverage through the complete Q1 earnings season — every major holding reports before that date
If you own XLI or industrial names:
- ✅ Hold with a mental stop around $162-$163 — below the $164 secondary GEX support and a signal of real technical breakdown
- 🔵 If XLI trades down to $160-$161 ahead of April earnings, that is where smart money built their protection floor — a reasonable re-entry or add zone if you believe in the long-term thesis
- 🎯 If XLI breaks above $167 on volume, consider scaling out 20-30% of position into strength — the resistance test cleared but the ATH is still 8% away
- 🛡️ The April put structure in the market tells you institutional consensus is cautious through earnings season — respect that signal even if you remain bullish
If you are watching from the sidelines:
- ⏰ Triple Witch March 20 is the first major catalyst — price action around $165-$166 through next Friday sets the directional tone for April
- 🎯 Post-Triple Witch weakness below $163-$164 would be a cleaner setup for bearish positions targeting $160
- 📈 Post-Triple Witch strength above $167 would be the "all-clear" signal for bulls targeting $169-$175
- 💡 The April earnings window is the real test — GE Aerospace and Caterpillar tone will determine whether the ATH was justified or was a blow-off top
If you are bearish on industrials:
- 🔴 The $165 immediate support (0.06% below current price) is your first trigger — a sustained close below $165 opens the door to $164, then the path to $160
- 📊 The heavily put-skewed GEX structure (120.4 vs 43.9) means the gamma mechanics favor you if price falls — dealer hedging amplifies the move
- 🎯 $160 is the primary target — GEX key support, implied move floor, 40,000 institutional put contracts — if XLI tests there, expect a serious battle
- ⚠️ If $166 breaks to the upside, reassess the bearish thesis immediately — the resistance flip scenario is a genuine risk
Mark your calendar — Key dates:
- 📅 March 20 (Friday) — Triple Witch Options Expiration (±$4.61 implied move, range $160.49–$169.71)
- 📅 April 17 — OPEX for the short $166 puts and short $150 puts legs
- 📅 April 2026 — Q1 earnings season: GE Aerospace, Caterpillar, RTX, GE Vernova, Boeing
- 📅 April 24 — OPEX for the long $160 put (protection) and short $145 put (income floor)
Final verdict: The XLI fundamental story is genuinely compelling — AI power infrastructure, defense spending, and IIJA disbursements are structural multi-year tailwinds, not cyclical bumps. But even the best sector story needs a breather after a 21% quarterly run to a new all-time high. The $38.4M put complex is not saying "sell everything" — it is saying "I love industrials, and I am not letting April earnings take me out without a parachute." That is smart risk management, not fear. Whether you follow the hedge, fade it, or just watch depends entirely on your position, risk tolerance, and conviction in April earnings. But know this: the GEX structure, the implied move math, and the institutional flow are all pointing at the same level — $160. That is the number to watch.
Be smart, size your positions appropriately, and never let a single trade's size convince you it cannot be wrong.
Disclaimer: Options trading involves substantial risk of loss and is not suitable for all investors. This analysis is for educational and informational purposes only and does not constitute financial advice or a recommendation to buy or sell any security. All options strategies described carry the risk of total loss of premium paid. The 5-leg complex institutional structure described here involves sophisticated risk management techniques not appropriate for most retail traders — do not attempt to replicate multi-leg structures without a thorough understanding of each leg's individual risk profile and combined portfolio impact. Selling put options creates an obligation to purchase shares at the strike price and requires sufficient margin or capital. Z-scores referenced (Z=2.94, Z=2.95) reflect the relative size of trade legs versus existing open interest — they indicate institutional-scale activity but do not imply the trades will be directionally profitable. Past performance does not guarantee future results. Always conduct your own due diligence and consult a licensed financial advisor before making investment decisions.
About XLI — Industrial Select Sector SPDR ETF: XLI tracks the Industrial Select Sector Index of the S&P 500, providing diversified exposure to 82 industrial companies spanning aerospace & defense, machinery, construction equipment, ground transportation, air freight, electrical equipment, and building products. Managed by State Street Global Advisors (SSGA) with approximately $25B in AUM and a 0.09% expense ratio, it is the benchmark vehicle for institutional-scale industrial sector exposure. Top holdings as of March 2026: GE Aerospace (6.64%), Caterpillar (6.35%), RTX Corporation (5.19%), GE Vernova (4.23%), and Boeing (3.30%), collectively approximately 25% of the fund.