⚡ XLU Massive $15.4M Bull Call Spread + Calendar Extension - Institutional Bet on AI Power Demand! 💰
📅 February 12, 2026 | 🔥 Unusual Activity Detected
🎯 The Quick Take
Someone just deployed $15.4 MILLION betting that utilities rally into June! This isn't a simple directional bet - it's a sophisticated multi-leg structure combining a bull call spread ($44/$47 March) with a calendar extension ($47 June) in XLU. The timing is perfect: Fed rate cuts supporting dividends, AI data center power demand exploding, and utilities sitting at a critical inflection point. Translation: Big money is positioning for the AI power trade with a defined-risk bullish structure!
📊 Company Overview
Utilities Select Sector SPDR Fund (XLU) tracks the Utilities Select Sector Index, providing concentrated exposure to S&P 500 utility companies:
- AUM: $21.89B
- Industry: Electric Power, Natural Gas, Water Utilities
- Current Price: $44.46 (as of February 11, 2026)
- 52-Week Range: $35.51 - $46.89
- Dividend Yield: 2.68% (quarterly dividend of $0.317)
- Expense Ratio: 0.08%
- Holdings: 32 stocks (top 10 = 59% of assets)
Top Holdings:
| Holding | Ticker | Weight |
|---|---|---|
| NextEra Energy | NEE | 13.68% |
| Southern Company | SO | 7.35% |
| Duke Energy | DUK | 7.05% |
| Constellation Energy | CEG | 6.55% |
| American Electric Power | AEP | 4.79% |
💰 The Option Flow Breakdown
📊 What Just Happened
The Tape (February 12, 2026 @ 10:56:24):
| Time | Option Symbol | Buy/Sell | Type | Expiration | Strike | Volume | Premium | OI Signal | Strategy Role |
|---|---|---|---|---|---|---|---|---|---|
| 10:56:24 | XLU20260320C44 | BUY | CALL | 2026-03-20 | $44 | 40,000 | $8.9M | HIGH_ACTIVITY | Bull Call Spread (Long Leg) |
| 10:56:24 | XLU20260320C47 | SELL | CALL | 2026-03-20 | $47 | 80,000 | $3.9M | HIGH_ACTIVITY | Bull Call Spread (Short Leg) |
| 10:56:24 | XLU20260618C47 | BUY | CALL | 2026-06-18 | $47 | 20,000 | $2.6M | HIGH_ACTIVITY | Calendar Roll (June Extension) |
🤓 What This Actually Means
This is a sophisticated three-leg institutional trade that tells us exactly what smart money expects:
🐂 The Bull Call Spread ($44/$47 March):
- 💚 Long 40,000 $44 calls ($8.9M premium) - buying upside exposure
- 🔴 Short 80,000 $47 calls ($3.9M collected) - capping gains but reducing cost
- 💰 Net cost: ~$5M for March bullish exposure
- 🎯 Max profit zone: XLU between $47+ by March 20 expiration
- 📊 Breakeven: Roughly $45.25-$45.50 (needs ~2% upside)
📅 The Calendar Extension ($47 June):
- 💚 Long 20,000 $47 calls ($2.6M premium) - extending bullish bet through June
- 🔄 This offsets half of the short March $47 calls
- 🎯 Purpose: If XLU rallies past $47 by March, this leg captures additional upside through June
Real talk - here's what they're doing:
- 📈 Primary bet: XLU rallies from $44.46 to $47+ (5.7% upside) by March 20
- 🛡️ Risk management: Spread structure defines max loss at ~$5M net debit
- ⏰ Extended exposure: June $47 calls give them a second bite at the apple if March times poorly
- 🎪 Catalyst alignment: CERAWeek (March 23-27) and Q1 earnings coming up
Why the 80,000 short vs 40,000 long in March? They're selling 2x the calls they bought at the $47 strike. This creates a ratio spread where they're heavily short above $47 in March BUT the June leg partially offsets that. Net effect: max profit if XLU reaches $47 by March, then continues higher into June.
📈 Technical Setup / Chart Check-Up
YTD Performance Chart
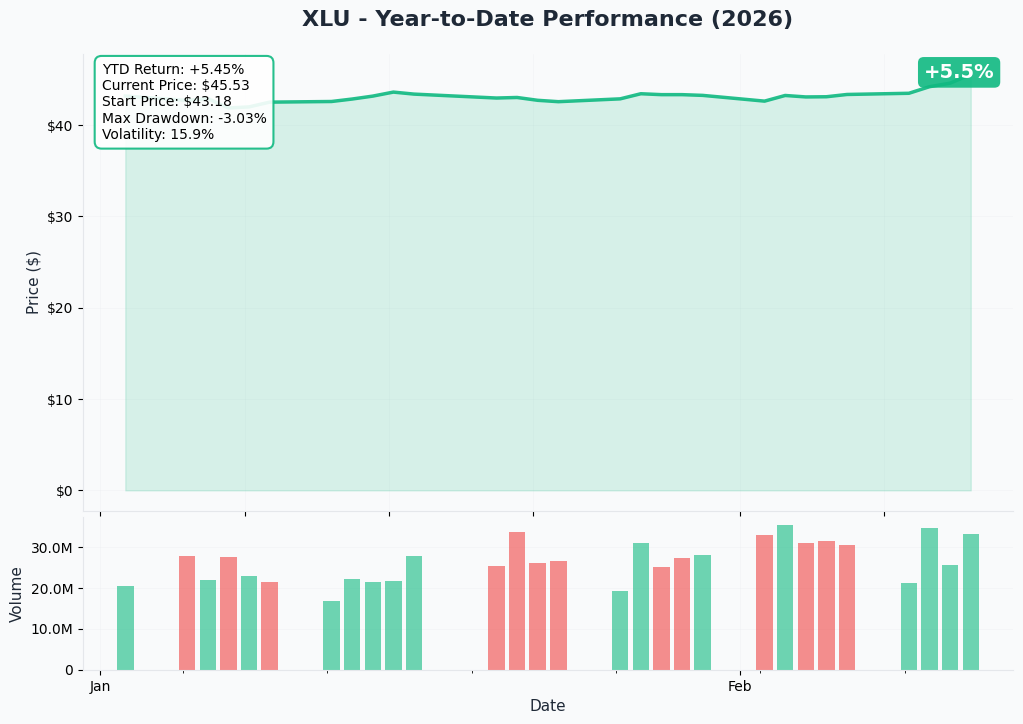
XLU is showing strength after surging 20.7% in 2025, outperforming most sectors according to MarketBeat. The ETF has pulled back slightly from its 52-week high of $46.89, now trading at $44.46 - creating a potential entry point for bulls betting on continued AI-driven power demand.
Key observations:
- 📈 Strong trend: Major rally in 2025 demonstrates institutional interest in utilities
- 💹 Consolidation: Currently digesting gains, trading ~5% below 52-week high
- 🎢 Support building: Recent trading range between $44.14 - $44.50 shows price stabilization
- 📊 Volume uptick: $15.4M in unusual options activity signals renewed institutional positioning
Gamma & Implied Move Analysis
Note: Gamma exposure and implied move charts are not available for XLU at this time. However, we can infer key levels from the trade structure:
Key Strike Levels from Option Flow:
- 🟢 $44 - Long call strike (current price level = immediate support)
- 🟠 $47 - Short call strike / Resistance target (5.7% above current)
- 📊 Implied Range: The spread structure suggests trader expects $44-$47 range through March with potential breakout into June
🎪 Catalysts
🔥 Recent Catalysts (Already Happened)
NextEra Energy Q4 2025 Results (January 27, 2026):
- 📈 GAAP Net Income: $1.535B ($0.73/share), up from $1.203B in Q4 2024
- 🏗️ Backlog: Added 13.5 GW of new generation/storage projects; total backlog near 30 GW
- 🎯 2026 Guidance reaffirmed at adjusted EPS of $3.92-$4.02
Vistra Corp 2026 Guidance (November 2025):
- 💰 Initiated 2026 adjusted EBITDA guidance of $6.8B-$7.6B, significantly above 2025's $5.7B-$5.9B
- 📈 Consensus estimates indicate 26.2% YoY earnings growth in 2026
Nuclear Power Deals:
- ⚛️ Constellation Energy secured 20-year PPA with Microsoft to restart Three Mile Island reactor
- ⚛️ Vistra signed 20-year PPAs with Meta for 2,176 MW of nuclear energy
🚀 Upcoming Catalysts (Next 6 Months)
Investor Conferences (March 2026):
- 📅 March 2 - JEF Flagship Power, Utilities, Clean Energy Conference
- 📅 March 4 - Jefferies Power, Utilities and Clean Energy Conference
- 📅 March 23-27 - CERAWeek in Houston (major energy industry event)
Federal Reserve Outlook:
- 📉 Current rate: 3.50%-3.75% (December 2025 cut)
- 🎯 Two additional cuts expected in 2026, potentially bringing rates to 3.00%-3.25%
- 💰 Lower rates = improved profitability for capital-intensive utilities
AI Data Center Power Demand:
- ⚡ U.S. data center power could reach 106 GW by 2035 (BloombergNEF)
- 🤖 AI data center power could grow 30x by 2035, reaching 123 GW (Deloitte)
- 📈 Data centers represent 40% of electricity demand growth (CNBC)
Clean Energy Transition:
- 🌞 Nearly 99% of new U.S. power capacity in 2026 from renewables/storage
- 💰 Solar + storage now costs 5-13 cents/kWh - cheaper than natural gas and coal
🎲 Price Targets & Probabilities
Based on the trade structure, catalysts, and market context:
📈 Bull Case (35% probability)
Target: $48-$50 by June 2026
How we get there:
- 💪 Fed delivers 2+ rate cuts in H1 2026, boosting dividend stocks
- ⚡ AI data center demand accelerates, driving utility revenue growth
- ⚛️ Additional nuclear PPAs announced with hyperscalers (Amazon, Google next?)
- 🎯 Average analyst price target: $48.55 (9% upside)
- 📈 March-June momentum builds through CERAWeek and Q1 earnings
Trade outcome: Both the bull call spread AND June extension pay off handsomely. Potential $8-10M+ profit on the structure.
🎯 Base Case (45% probability)
Target: $45-$47 range through June
Most likely scenario:
- ✅ XLU grinds higher into the spread's max profit zone ($47)
- 📊 March expiration: Bull call spread captures ~$3 of value ($44 to $47)
- ⏰ June extension: Provides optionality if rally continues
- 🔄 Trading within 52-week range, respecting recent high of $46.89
- 📈 Fund flows remain positive ($2.47B net inflows over past year)
Trade outcome: Solid profit on March spread (~$5-7M), June leg provides small additional gain or expires near breakeven.
📉 Bear Case (20% probability)
Target: $42-$44
What could go wrong:
- 😰 Tariff-induced inflation caps sector gains or triggers ~10% decline
- 📉 Interest rates stay elevated if inflation resurges
- ⚖️ Regulatory changes to clean energy incentives under "One Big Beautiful Bill Act"
- 💸 After 20.7% rally in 2025, profit-taking emerges
- 🌪️ Natural disaster liabilities or grid infrastructure concerns
Trade outcome: Loss limited to ~$5M net debit (defined risk structure). June leg could recover some losses if bearish move is temporary.
💡 Trading Ideas
🛡️ Conservative: Buy XLU Shares + Covered Call
Play: Buy 100 shares of XLU at $44.46, sell $47 call expiring March 20
Why this works:
- 📈 Participate in upside to $47 (5.7% gain)
- 💰 Collect dividend yield (2.68% annualized)
- 🛡️ Call premium provides downside cushion
- ⏰ If called away at $47 = 5.7% + premium + dividend = solid return
- 📊 Aligned with institutional trade thesis (bullish to $47)
Estimated P&L:
- 💰 Premium collected: ~$0.50-0.75 per share ($50-75 per contract)
- 📈 Max profit: $2.54 stock gain + $0.50 premium + dividend = ~$3.10 (7% in 5 weeks)
- 📉 Breakeven: ~$43.70 (covered by premium)
Risk level: Low | Skill level: Beginner-friendly
⚖️ Balanced: Bull Call Spread (Follow the Flow)
Play: Buy $44/$46 bull call spread expiring March 20
Structure: Buy $44 calls, Sell $46 calls (March 2026)
Why this works:
- 🎯 Similar structure to institutional trade but smaller target
- 📊 Defined risk, defined reward
- 💰 Lower cost than buying calls outright
- ⏰ 5-week holding period aligns with CERAWeek catalyst
- 📈 Needs only 3.5% move to max profit
Estimated P&L:
- 💰 Cost: ~$0.80-1.00 per spread ($80-100 per contract)
- 📈 Max profit: $2.00 - cost = ~$1.00-1.20 ($100-120 per contract)
- 📉 Max loss: Premium paid (~$80-100 per contract)
- 🎯 Breakeven: ~$44.90 (1% upside)
Risk level: Moderate | Skill level: Intermediate
🚀 Aggressive: Calendar Spread (June/March $46)
Play: Sell March $46 calls, Buy June $46 calls
Why this works:
- ⏰ Benefits from time decay on short March leg
- 📈 If XLU near $46 at March expiration, ideal outcome
- 🔄 Calendar structure mirrors institutional approach
- 💰 Lower initial cost than straight call purchase
- 📊 Profits from volatility if it increases into June
Estimated P&L:
- 💰 Net debit: ~$1.00-1.30 per calendar ($100-130 per contract)
- 📈 Max profit: Occurs if XLU at $46 at March expiration (can be 100%+ of cost)
- 📉 Max loss: Limited to premium paid
- 🎯 Sweet spot: XLU trades to $46 by March, then higher into June
Risk level: High | Skill level: Advanced
⚠️ Risk Factors
Don't get caught by these potential landmines:
-
💸 Valuation after strong 2025 rally: XLU surged 20.7% in 2025, potentially front-loading gains. After such a strong year, consolidation or pullback is common. Current price near 52-week high limits margin of safety.
-
📈 Interest rate sensitivity: While Fed is expected to cut rates, any inflation resurgence could pause cuts or reverse course. Utilities are inversely correlated with treasury yields - rising rates hurt.
-
🌪️ Natural disaster and liability risk: Climate-related disasters and mismanagement allegations pose material risks to utility holdings. Grid infrastructure aging may struggle to meet AI-driven demand growth.
-
⚖️ Regulatory overhang: IRA clean energy provisions face potential changes under "One Big Beautiful Bill Act." States considering new data center laws as electricity bills rise could impact growth assumptions.
-
💰 Tariff-induced inflation: Americans' energy bills increased 13% since January 2025; tariffs could cap sector gains or trigger ~10% declines. This directly pressures consumer sentiment and regulatory response.
-
📊 Concentration risk: XLU holds only 32 stocks with top 10 holdings representing 59% of assets. NextEra Energy alone is 13.68% - single-stock risk in a diversified ETF.
-
⏰ Complex trade structure timing: The institutional trade requires precise timing across two expirations. If XLU rallies too fast (above $47 before March), the ratio spread could face losses. If too slow, time decay erodes value.
🎯 The Bottom Line
Real talk: Someone just built a $15.4M multi-leg bullish structure on XLU with a very specific thesis - utilities rally to $47 by March and continue higher into June. The sophistication of this trade (bull call spread + calendar extension) tells us this is institutional money with a defined view and professional risk management.
Why utilities? Why now?
- ⚡ AI data center demand is the real deal - 40% of electricity demand growth
- 💰 Fed rate cuts directly improve utility profitability
- ⚛️ Nuclear renaissance creating 20-year contracted revenue streams
- 📊 Analysts have $48.55 average price target (9% upside)
- 🏦 $2.47B net inflows over past year shows sustained institutional interest
If you want exposure to utilities:
- ✅ Consider bull call spreads aligned with this institutional positioning ($44/$47 March)
- 📊 XLU offers diversified exposure to the AI power theme without single-stock risk
- 💰 2.68% dividend yield provides income while waiting for capital appreciation
- 🎯 Entry near $44 offers reasonable risk/reward with 52-week high at $46.89
If you're watching from sidelines:
- ⏰ March 23-27 - CERAWeek could be a catalyst for utility announcements
- 📊 Wait for pullback to $43-44 range for better entry if concerned about 2025 rally extension
- 🎪 Q1 2026 earnings from major holdings (NextEra, Southern, Duke) will confirm AI demand thesis
If you're bearish:
- ⚠️ The defined-risk nature of this trade suggests even smart money sees downside risk
- 📉 Support at $42-43 (10% below recent highs) would be logical target
- ⏰ Rising rates or regulatory headlines could trigger pullback opportunity
Mark your calendar - Key dates:
- 📅 March 2, 2026 - JEF Flagship Power Conference
- 📅 March 4, 2026 - Jefferies Power, Utilities Conference
- 📅 March 20, 2026 - March options expiration (bull call spread resolution)
- 📅 March 23-27, 2026 - CERAWeek in Houston
- 📅 June 18, 2026 - June options expiration (calendar extension resolution)
Final verdict: This is a high-conviction institutional bet on utilities as the "AI shovel trade" - you don't buy AI, you buy the power that runs AI. The defined-risk structure shows professional risk management, and the thesis aligns with multiple macro tailwinds (rate cuts, data center demand, nuclear renaissance). For retail traders, following with smaller bull call spreads or covered calls offers asymmetric risk/reward. The trade tells us: smart money sees $47 as achievable by March, with potential continuation into June.
Disclaimer: Options trading involves substantial risk of loss and is not suitable for all investors. This analysis is for educational purposes only and not financial advice. Past performance doesn't guarantee future results. The unusual activity highlighted reflects institutional positioning and does not guarantee profitability. Always do your own research and consider consulting a licensed financial advisor before trading.
About XLU: The Utilities Select Sector SPDR Fund tracks the Utilities Select Sector Index, providing exposure to 32 S&P 500 utility companies with $21.89B in assets under management. The fund focuses on electric power, natural gas, and water utility industries.