🛡️ AAL $10.8M Put Selling Spree - Bulls Collecting Premium on Downside Protection! 💰
📅 December 5, 2025 | 🔥 Unusual Activity Detected
🎯 The Quick Take
Someone just SOLD $10.8 MILLION in AAL puts this morning at 12:06:38! This aggressive premium collection involves 165,000 contracts across two strikes ($13 and $12) expiring March and May 2026 - locking in bullish positioning on American Airlines while pocketing massive income. With AAL trading at $14.59 and battling back from debt reduction achievements, smart money is betting the airline won't crash below $12-13 over the next 5-6 months. Translation: Institutional investors are getting PAID to say AAL stays above $12-13!
📊 Company Overview
American Airlines Group (AAL) is the world's largest airline navigating a complex recovery story:
- Market Cap: $9.47 Billion
- Industry: Air Transportation, Scheduled
- Current Price: $14.59 (up from $14.24 lows)
- Primary Business: Operates as the world's largest airline by aircraft and capacity with major hubs in Charlotte, Dallas/Fort Worth, Miami, Philadelphia, and Phoenix. Generates 30%+ of U.S. airline revenue through Latin America connections.
- Fleet: Operates 1,000+ mainline aircraft (youngest among legacy carriers)
- Employee Base: 136,900 employees
💰 The Option Flow Breakdown
The Tape (December 5, 2025 @ 12:06:38):
| Time | Symbol | Side | Buy/Sell | Type | Expiration | Premium | Strike | Volume | OI | Size | Spot | Option Price | Option Symbol |
|---|---|---|---|---|---|---|---|---|---|---|---|---|---|
| 12:06:38 | AAL | BID | SELL | PUT $13 | 2026-05-15 | $7.8M | $13 | 85K | 719 | 85,000 | $14.59 | $0.92 | AAL20260515P13 |
| 12:06:38 | AAL | BID | SELL | PUT $12 | 2026-03-20 | $3.0M | $12 | 80K | 85K | 80,000 | $14.59 | $0.38 | AAL20260320P12 |
🤓 What This Actually Means
This is AGGRESSIVE BULLISH PREMIUM COLLECTION - someone is getting PAID to bet AAL stays above $12-13! Here's the breakdown:
Trade #1: $13 May 2026 Puts Sold
- 💸 Premium collected: $7.8M ($0.92 per contract × 85,000 contracts)
- 🛡️ Obligation strike: $13 represents 10.9% downside cushion from current $14.59
- ⏰ Time horizon: 161 days to expiration (5+ months of theta decay working FOR them)
- 📊 Volume significance: 85,000 contracts on only 719 OI = 118x the existing open interest!
- 🔥 Unusual score: 830.38 Z-score = EXTREMELY UNUSUAL (happens maybe a few times per year)
Trade #2: $12 March 2026 Puts Sold
- 💸 Premium collected: $3.0M ($0.38 per contract × 80,000 contracts)
- 🛡️ Obligation strike: $12 represents 17.7% downside cushion
- ⏰ Time horizon: 105 days to expiration (3.5 months)
- 📊 Volume significance: 80,000 contracts on 85,000 OI = nearly equal to ALL existing positions
- 🔥 Unusual score: 14.99 Z-score = EXTREMELY UNUSUAL
Combined Strategy Analysis: This trader is running a SHORT PUT LADDER - selling naked puts at two different strikes and expirations to maximize premium income while accepting potential stock assignment risk. The total $10.8M premium collected represents their INCOME if AAL stays above these levels. However, if AAL crashes below $12-13, they're obligated to BUY 16.5 million shares at those strikes (worth $200M+ at current prices).
What's really happening here: This is either:
- 🏦 Institutional cash-secured put selling - Fund with $200M+ cash willing to own AAL at $12-13 (15-18% discount) while collecting $10.8M income
- 🐂 Covered short puts - Player already short AAL stock using puts to lock in profitable exit levels
- 💪 Bullish conviction trade - Sophisticated investor absolutely convinced AAL won't break below $12 over next 5 months
The strikes chosen ($13 and $12) sit well below current trading levels but ABOVE critical support zones identified in gamma analysis. This isn't reckless gambling - it's calculated premium harvesting with defined assignment risk.
Why this trade works (their thesis):
- 📊 AAL achieved $15B debt reduction goal ahead of schedule
- 💰 Generated record $2.2B free cash flow in 2024
- 🤝 $6.1B Citi co-branded credit card partnership provides recurring revenue stream
- 🚀 50+ new routes in 2025 expanding network
- 📈 Corporate travel recovery from -11% trough to -7% below historical share
- ⛽ Fuel costs down 13% in 2025 ($86/barrel vs $99 in 2024)
Risk if wrong: If AAL drops to $11 by expiration:
- May $13 puts: Forced to buy 8.5M shares at $13 = loss of $2/share × 8.5M = $17M loss (offset by $7.8M premium = $9.2M net loss)
- March $12 puts: Forced to buy 8M shares at $12 = loss of $1/share × 8M = $8M loss (offset by $3M premium = $5M net loss)
- Total potential loss: $14.2M if AAL at $11 (vs $10.8M max gain if above strikes)
This is NOT a risk-free trade - it's leveraged bullish exposure disguised as income generation.
📈 Technical Setup / Chart Check-Up
YTD Performance Chart
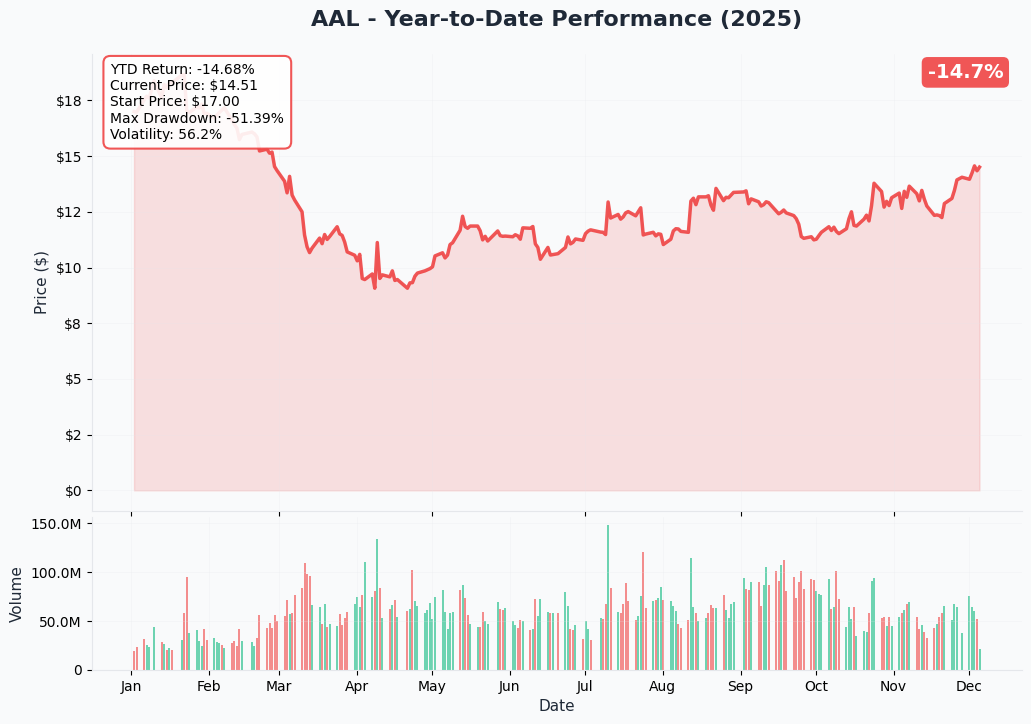
AAL is showing brutal volatility - currently trading at $14.59 after a turbulent year. The chart reveals a challenging recovery story with the stock starting 2025 around $14.24 and experiencing significant swings throughout the year.
Key observations:
- 📉 Volatile range: Trading in mid-$8 to mid-$19 range during 2025 (52-week: $8.50-$19.10)
- 🎢 Down 25% YTD through 2025 per catalyst research (significant underperformance vs market)
- 📊 Recent consolidation: Stabilizing in $14-15 range after sharp selloffs
- ⚠️ Failed breakout: Stock hit $19.10 highs but couldn't hold - rejection signals resistance
- 💔 Peer underperformance: While United up 118%+ in 2025, AAL struggling to gain traction
Gamma-Based Support & Resistance Analysis
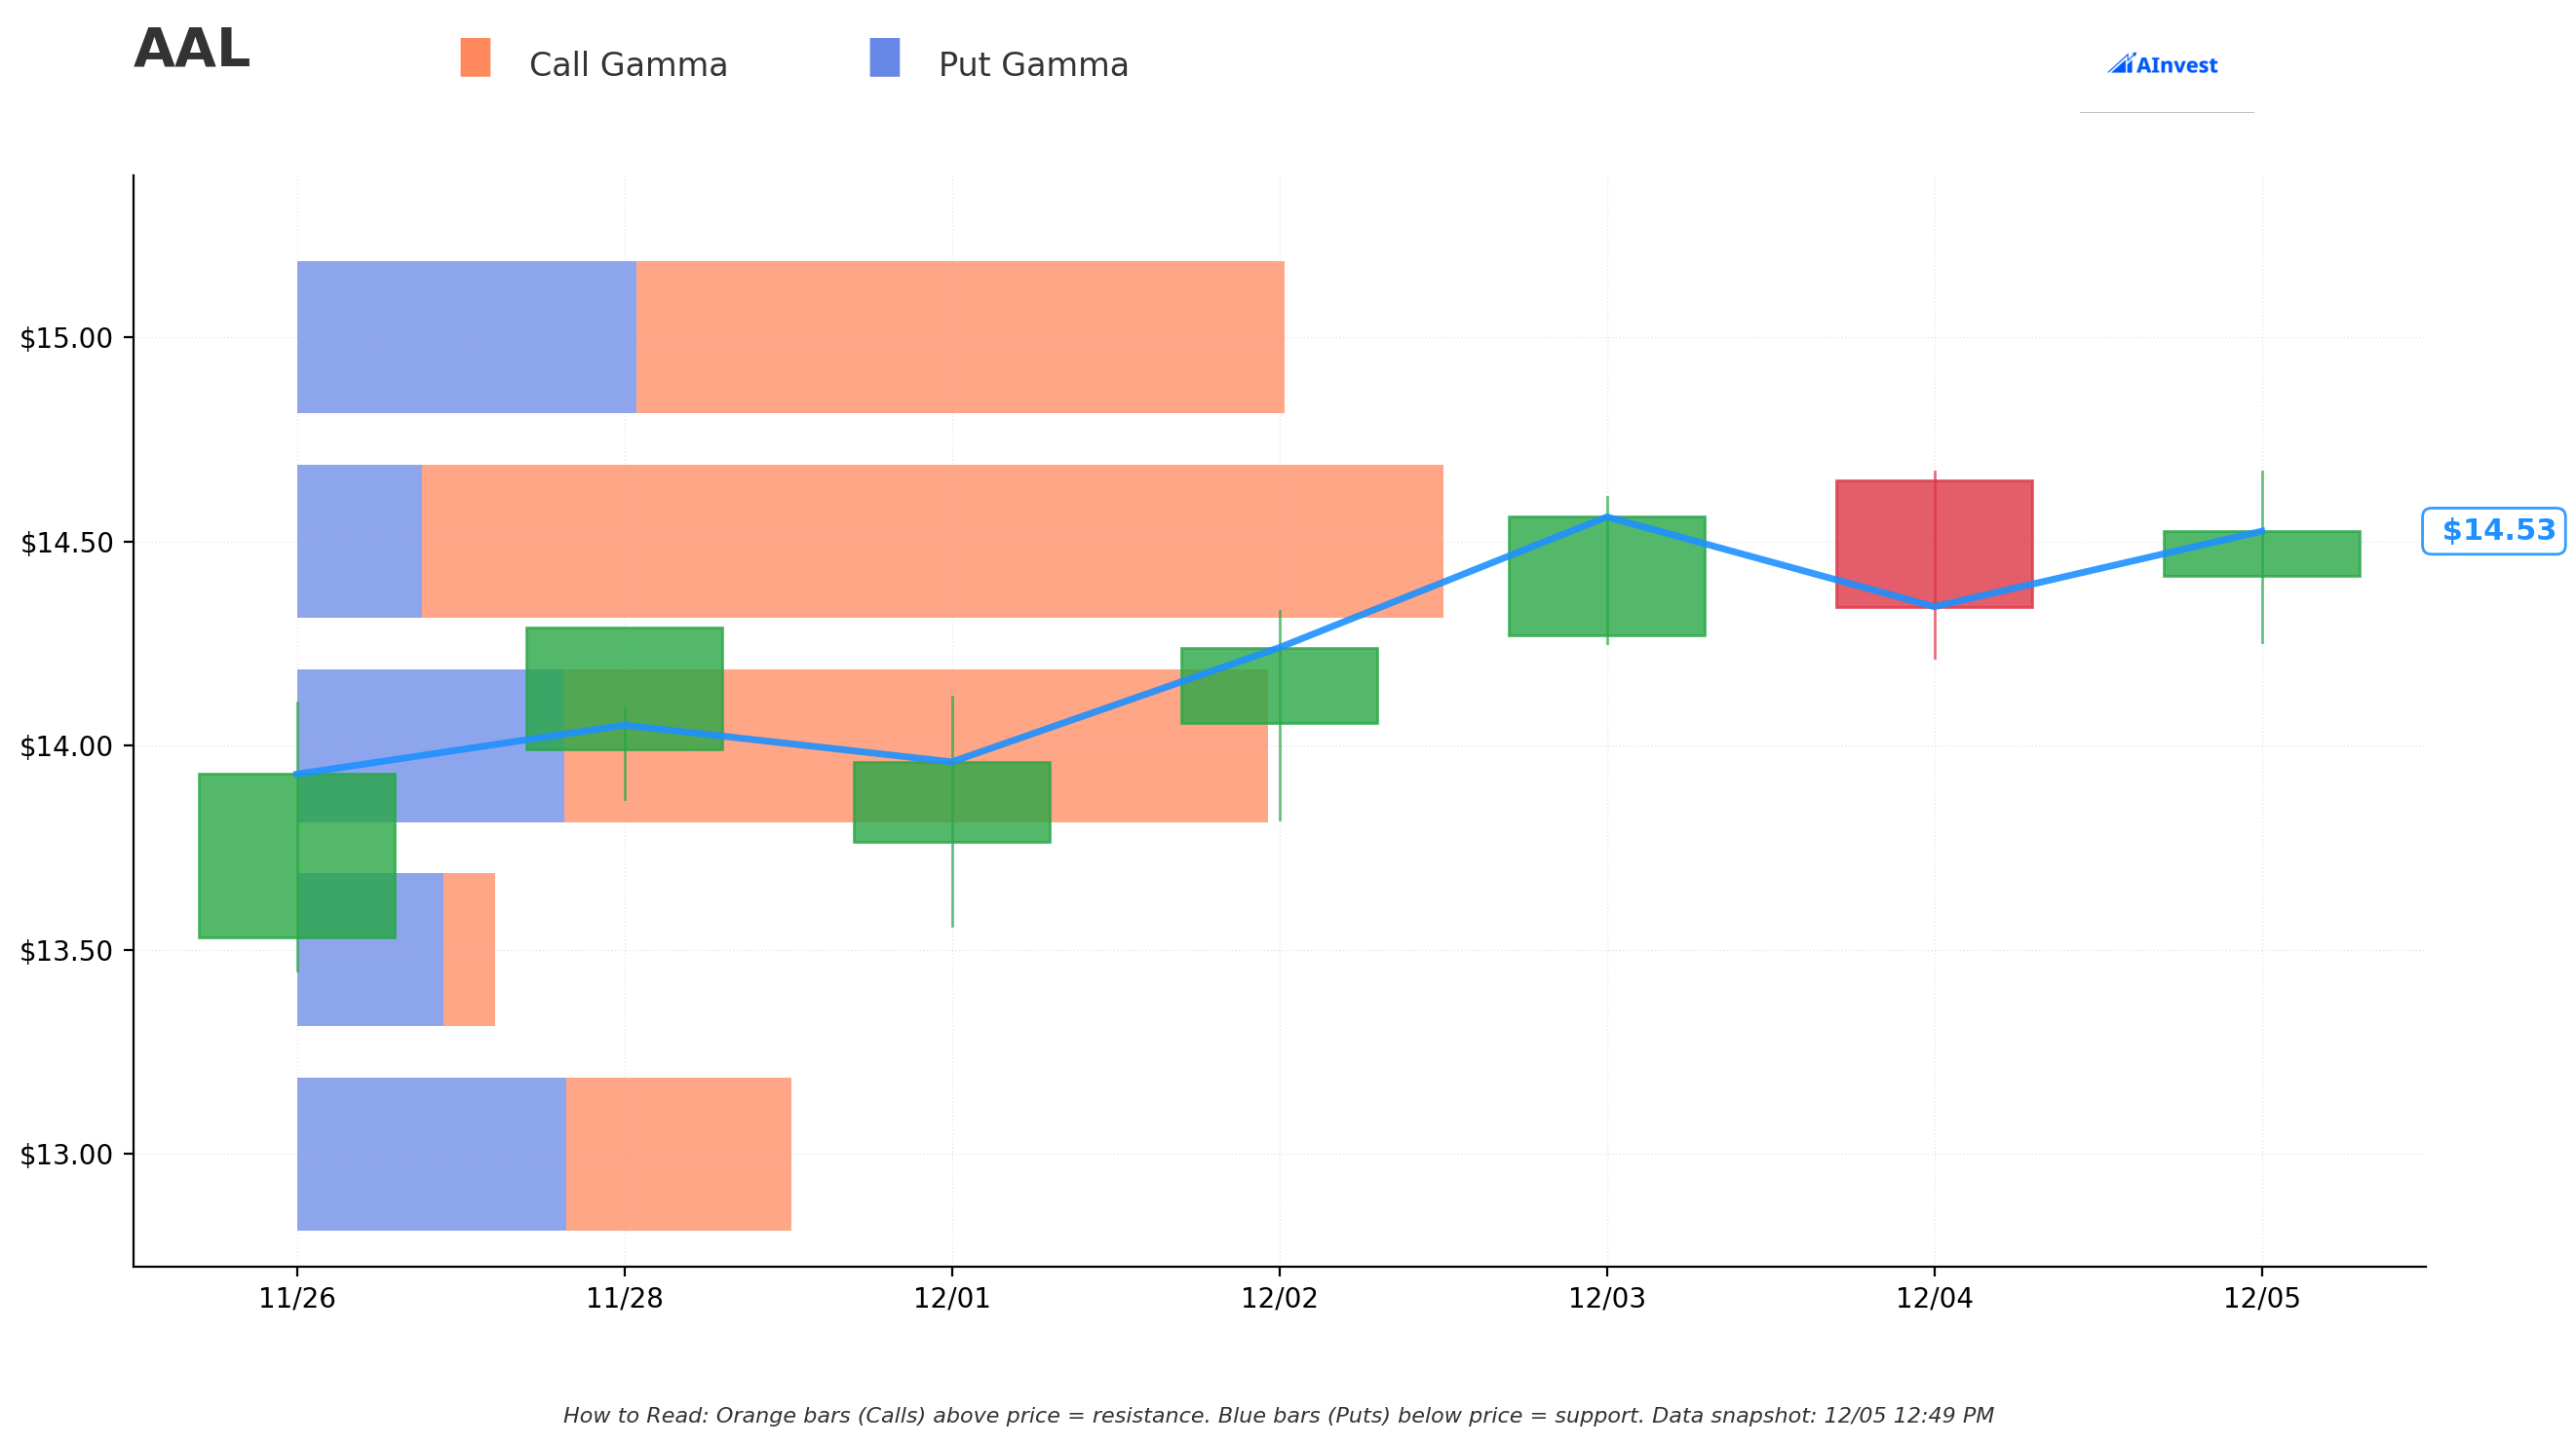
Current Price: $14.53
The gamma exposure map shows critical price magnets that will govern near-term price action:
🔵 Support Levels (Put Gamma Below Price):
- $14.50 - Immediate support with 41.2M total gamma (STRONGEST nearby floor!)
- $14.00 - Secondary support at 41.7M gamma (dealers will defend this level)
- $13.50 - Moderate support at 8.3M gamma (3.7% below current)
- $13.00 - CRITICAL FLOOR with 21.1M gamma (EXACTLY where Trade #1 puts are struck!)
- $12.50 - Light support at 1.2M gamma (14% below current)
- $12.00 - DEEP SUPPORT with 33.4M gamma (EXACTLY where Trade #2 puts are struck!)
🟠 Resistance Levels (Call Gamma Above Price):
- $15.00 - Immediate ceiling with 42.5M gamma (STRONGEST RESISTANCE - dealers will sell rallies)
- $15.50 - Light resistance at 1.4M gamma
- $16.00 - Secondary ceiling at 11.4M gamma (10% overhead)
- $17.00 - Extended resistance zone with 12.6M gamma
What this means for traders: AAL is trapped in a TIGHT consolidation box between massive $14.50 support and crushing $15.00 resistance (both 41-42M gamma). The stock is pinned by options positioning - market makers have enormous exposure at these strikes creating natural boundaries.
Critical insight for the put trade: Notice the put buyer struck EXACTLY at levels with significant gamma support:
- $13 strike: 21.1M gamma support = major institutional interest
- $12 strike: 33.4M gamma support = MASSIVE put wall (highest put gamma on the board)
This is NOT random strike selection - they positioned at precisely where gamma data shows dealers will aggressively defend. The $12 level with 33.4M gamma is THE line in the sand. The put seller is essentially betting "AAL won't break the biggest gamma support level over the next 5 months."
Net GEX Bias: Bullish (161.9M call gamma vs 114.6M put gamma) - Overall positioning remains bullish with call-heavy exposure suggesting upside bias.
Implied Move Analysis
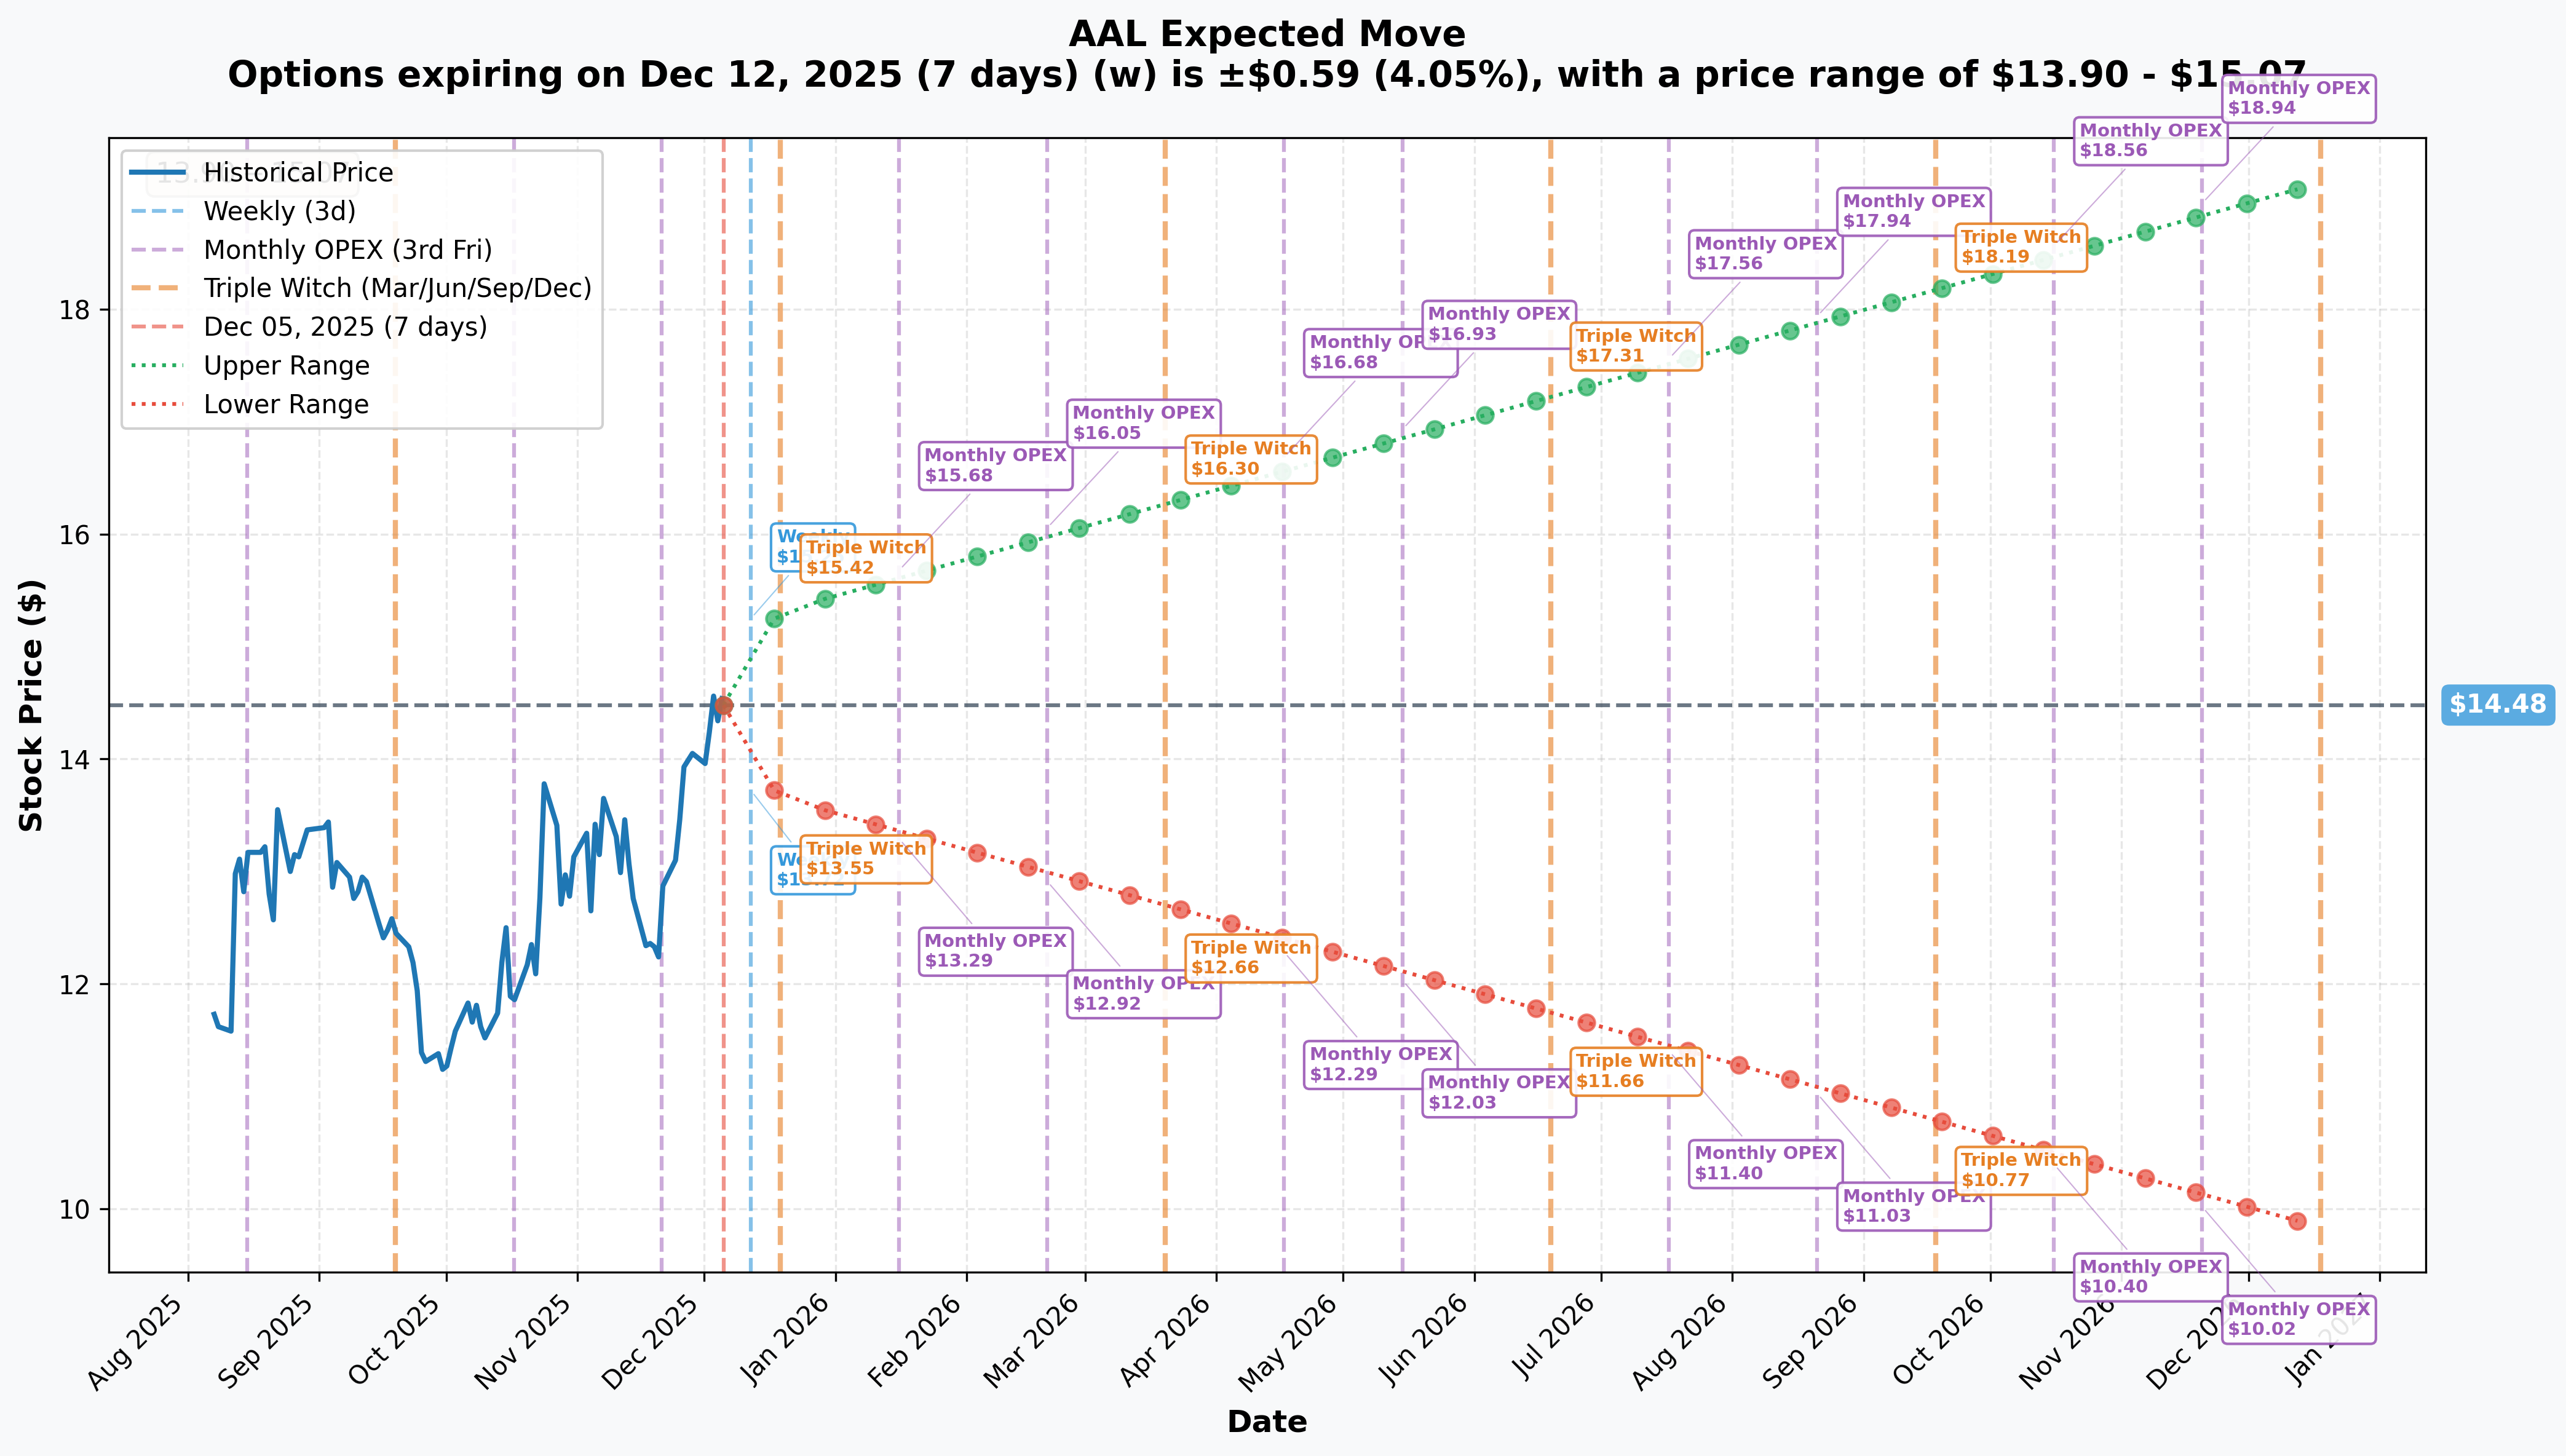
Options market pricing for upcoming expirations:
- 📅 Weekly (Dec 12 - 7 days): ±$0.59 (±4.05%) → Range: $13.90 - $15.07
- 📅 Monthly OPEX (Dec 19 - 14 days): ±$0.83 (±5.75%) → Range: $13.65 - $15.32
- 📅 Quarterly Triple Witch (Dec 19 - 14 days): ±$0.83 (±5.75%) → Range: $13.65 - $15.32
- 📅 March OPEX (Mar 20 - 105 days - Trade #2 expiration!): ±$1.78 (±12.3%) → Range: $12.70 - $16.26
- 📅 May OPEX (May 15 - 161 days - Trade #1 expiration!): ±$2.28 (±15.7%) → Range: $12.20 - $16.76
- 📅 Yearly LEAPS (Dec 18, 2026 - 378 days): ±$4.65 (±32.1%) → Range: $9.83 - $19.13
Translation for regular folks: Options traders are pricing in a 4% move ($0.59) through next Friday, but a larger 5.75% move ($0.83) through December monthly OPEX. The key observation: by March expiration, the market expects AAL could trade as low as $12.70 (very close to the $12 put strike!). By May, the lower range is $12.20 (just below the $13 strike).
Critical insight: The put seller chose strikes that sit RIGHT AT the edge of the implied move ranges:
- March $12 puts: Lower implied range is $12.70 (only $0.70 cushion)
- May $13 puts: Lower implied range is $12.20 (only $0.80 cushion below $13)
This means the options market is pricing a NON-TRIVIAL probability that AAL could trade at these levels. The put seller is betting against the tail risk, collecting premium from traders buying downside protection. If AAL stays within the expected ranges, they keep the full $10.8M. If AAL has a blow-up event (bankruptcy fears, recession, oil spike), they're on the hook for massive losses.
Volatility observation: The sharp increase from 5.75% (monthly) to 32.1% (yearly) reflects significant long-term uncertainty about AAL's financial health and competitive positioning. The airline sector's structural challenges are priced into longer-dated options.
🎪 Catalysts
🔥 Past Catalysts (Already Happened - Fundamentals Established)
Q4 2024 Results - January 23, 2025 (STRONG BEAT)
- ✅ Revenue: $13.66B (up 4.6% YoY), beating consensus by 1.81%
- ✅ Adjusted EPS: $0.86 vs $0.64 consensus (34% beat)
- ✅ Full-Year Revenue: Record $54.2 billion
- ✅ Free Cash Flow: Record $2.2 billion for full year 2024
- ✅ Debt Reduction Milestone: Achieved $15 billion total debt reduction goal from mid-2021 peak, one year ahead of schedule
Q1 2025 Results - April 24, 2025 (MISS BUT WITHDREW GUIDANCE)
- ⚠️ Revenue: $12.55B (flat YoY)
- ⚠️ Net Loss: $473M vs $312M prior year loss
- ⚠️ Adjusted Loss/Share: ($0.59) vs consensus ($0.65) - slightly better than expected
- ⚠️ Guidance Withdrawn: Management withdrew 2025 outlook citing "economic uncertainty" and weak leisure demand
- 📉 Management Commentary: "Domestic leisure travel fell off considerably" starting February 2025
- ✅ Free Cash Flow: $1.7B generated in Q1 - still strong despite loss
Citi Co-branded Credit Card Partnership - December 2024 (GAME-CHANGER)
- 🤝 10-year exclusive agreement with Citi becoming sole issuer starting 2026
- 💰 2024 Cash Remuneration: $6.1 billion from co-branded cards (up 17.0% vs 2023)
- 📈 AAdvantage Growth: Enrollments up 6% YoY, co-branded card spending up 8% in Q1 2025
- 🎯 Expected to drive "significantly expanded loyalty and rewards ecosystem"
Route Expansion - Throughout 2024-2025
- 🌍 50+ new routes launched in 2025 across domestic and international markets
- ✈️ Europe: Resumed Edinburgh, added Athens, Madrid, Milan, Rome; announced Prague and Budapest for summer 2026
- 🌴 Latin America: First Oklahoma-Cancun international service; expanded Caribbean routes
- 🏙️ Chicago Hub: Added 17 new destinations in 2025
- 🛫 Airbus A321XLR: First US airline to receive aircraft; launching JFK-Edinburgh March 2026
Fleet Modernization Milestones
- 🎉 1,000th mainline aircraft delivered (Boeing 787-9) in August 2025
- 📦 Order Backlog: 301 Airbus and Boeing aircraft on order
- 💺 Premium Seat Expansion: Retrofitting A319/A320 to increase first-class capacity; total premium capacity expected to grow 20%+ by 2026
Corporate Travel Recovery Progress
- 📊 Q4 2024: Business travel revenue up 8% YoY (sequential 2-point improvement from Q3)
- 📈 Current Position: Indirect channel bookings at -7% below historical share (improved from -11% trough in Q2)
- 🎯 Target: Full restoration to historical levels by exit 2025
🚀 Upcoming Catalysts (Next 6 Months)
Q2 2025 Earnings - Expected July 2025 (CRITICAL TEST)
- 📊 Q2 Guidance: Adjusted EPS between $0.50-$1.00 vs analyst consensus of $0.99
- 📈 Revenue Outlook: Down as much as 2% to up as much as 1% YoY vs 2.2% consensus expectation
- ✈️ Capacity: Expected to rise up to 4% in Q2
- 👀 Investor Focus: Corporate travel recovery trajectory, domestic leisure demand stabilization, unit revenue trends
- ⚠️ Risk: Guidance miss in Q1 and withdrawn 2025 outlook creates low expectations, but any further disappointment could be catastrophic
Citi Credit Card Transition - 2026 Launch
- ⏰ Timing: Citi becomes exclusive issuer starting 2026
- 💰 Revenue Impact: Already generated $6.1B in 2024; expected incremental value from expanded ecosystem
- 🤝 Mastercard Partnership: Renewed as exclusive payment network for co-branded cards
- 📊 Customer Base: Building on 6% YoY AAdvantage enrollment growth
A321XLR Route Launches - Q4 2025 to Q1 2026
- ✈️ First Delivery: Q4 2025
- 🛫 Inaugural Route: JFK-Edinburgh, March 2026
- 📦 Fleet Order: 50 A321XLR aircraft total on order
- 🎯 Strategic Value: Enables transatlantic expansion from secondary hubs with premium-heavy configuration
Summer 2026 Route Launches - Bookings Open
- 🇨🇿 Prague Service: New nonstop from US
- 🇭🇺 Budapest Service: Only US-Budapest nonstop service
- 🌍 Additional Europe: Expanded Athens, Milan, Zurich service
- 🌎 Buenos Aires: Expanded South America connectivity
Corporate Revenue Full Recovery - Target: Exit 2025
- 📊 Current Status: -7% below historical indirect channel share (Q3 2024)
- 🎯 Target: Full restoration exiting 2024/early 2025
- 📈 Progress Rate: Improved 4 percentage points from -11% trough in Q2 to -7% in Q3
- 💰 Revenue Impact: $14 billion in indirect channel revenue at stake (2023 baseline)
Debt Reduction Target - 2027 Goal
- 📉 Current Debt: Approximately $39 billion projected for 2025
- 🎯 2027 Target: Below $35 billion total debt
- 📊 Credit Rating Goal: Achieve BB rating
- 💰 Free Cash Flow: Building on $2.2 billion 2024 record for continued debt paydown
🎲 Price Targets & Probabilities
Using gamma levels, implied move data, and upcoming catalysts, here are the scenarios through May 15, 2026 expiration:
📈 Bull Case (30% probability)
Target: $16-$18
How we get there:
- 💪 Q2 earnings BEAT lowered expectations with revenue at upper end of guidance (+1% YoY growth)
- 🤝 Corporate travel recovery accelerates - reaches -3% vs historical by Q3 2025 (vs current -7%)
- 💰 Citi credit card partnership delivers incremental revenue surprises beyond $6.1B baseline
- ⛽ Fuel costs remain favorable ($80-85/barrel) supporting margin expansion
- 🛫 A321XLR launches successfully, premium cabin demand strong for transatlantic routes
- 📊 Management reinstates 2026 guidance showing confidence in demand recovery
- 🌍 Route expansion (50+ new routes) drives capacity growth without yield deterioration
- 💳 AAdvantage enrollment continues accelerating (8-10% growth) demonstrating brand loyalty
- 📈 Breakthrough above $15 gamma resistance triggers technical rally to $16-17
- 🏦 Debt reduction ahead of schedule (approaching $36B vs $39B target) improves credit profile
Key metrics needed:
- RASM (revenue per available seat mile) positive growth Q2-Q4 2025
- Operating margin expanding toward 6-8% range (from Q3's 4.7%)
- Free cash flow sustaining $500M+ per quarter
- Corporate revenue gap closing 2-3 percentage points per quarter
Why only 30% probability: Stock already struggled to hold $19 highs earlier in year. Requires PERFECT execution across multiple fronts while industry faces structural headwinds. Negative shareholder equity (-$4.0B) and massive debt ($28B) limit upside even with strong operations. Competitors (Delta, United) executing better - AAL playing catch-up. The $15 gamma resistance (42.5M) creates natural ceiling requiring sustained buying to overcome.
🎯 Base Case (45% probability)
Target: $12-$15 range (CHOPPY CONSOLIDATION)
Most likely scenario:
- ✅ Q2 earnings meet lowered expectations ($0.75-0.90 EPS in guidance range)
- 📱 Corporate travel recovery continues steady but unspectacular - exits year at -4% to -5% vs historical
- ⚖️ Leisure demand stabilizes at current levels - no dramatic improvement or deterioration
- 🤖 Citi partnership performs in-line with $6B+ baseline, no major surprises
- ⛽ Fuel costs range-bound $82-90/barrel - neither major tailwind nor headwind
- 🔄 Trading within gamma support ($14-$14.50) and resistance ($15-$15.50) bands for months
- 📊 Free cash flow continues but at lower rate ($1.5-1.8B annual vs $2.2B in 2024)
- 💤 Volatility remains elevated (30-40% range) but no crisis events
- 🛡️ Stock defends $13-14 levels on any selloffs (gamma support + put sellers stepping in)
- 📉 Unable to sustain rallies above $15.50-16 due to valuation concerns and sector rotation
This is the put seller's ideal scenario: Stock consolidates in $13-16 range, both puts expire worthless, and they keep the full $10.8M premium. The $13 May puts and $12 March puts never come close to being in-the-money. This consolidation allows time for corporate recovery to materialize, debt reduction to continue, and fundamental improvements to gain traction.
Why 45% probability: Stock at technical inflection point with strong support levels established. Fundamentals mixed but not catastrophic - debt reduction achieved, free cash flow positive, loyalty program strong. However, withdrawn guidance and weak leisure demand create uncertainty. Most likely path is "muddle through" - not great, not terrible. The $14-15 gamma sandwich keeps price action range-bound absent major catalyst.
Put seller P&L in Base Case:
- Stock above $13 at May expiration: $13 puts expire worthless, keep full $7.8M (100% profit)
- Stock above $12 at March expiration: $12 puts expire worthless, keep full $3.0M (100% profit)
- Total profit: $10.8M with ZERO work required, just waiting
📉 Bear Case (25% probability)
Target: $9-$12 (TEST THE PUT STRIKES!)
What could go wrong:
- 😰 Q2 earnings miss badly - revenue down 2% (low end of range) with EPS $0.50-0.60
- 🚨 Leisure demand deteriorates further - summer travel season disappoints
- 💔 Corporate revenue recovery stalls - stays at -7% or worsens to -9%
- ⛽ Oil price shock - fuel spikes to $110-120/barrel on geopolitical crisis
- 📉 Broader recession fears - consumer spending craters, discretionary travel collapses
- 🏦 Debt concerns resurface - negative equity (-$4.0B) limits financial flexibility in downturn
- 💸 Free cash flow turns negative on weak demand and higher costs
- ✈️ Competitive pressure intensifies - Delta/United/Southwest win share with better products
- 🇨🇳 China weakness impacts international travel demand
- 🔨 Break below $14 gamma support triggers cascade to $13, then $12
- 💀 Bankruptcy fears (however unlikely) resurface if losses accelerate
Critical support levels to watch:
- 🛡️ $14.00-$14.50: Current gamma floor (41-42M) - MUST HOLD or momentum shifts bearish
- 🛡️ $13.00: Major put strike + 21.1M gamma - $13 May puts start going ITM here
- 🛡️ $12.00: Deep support (33.4M gamma - HIGHEST put level) + $12 March puts ITM - disaster scenario
Why 25% probability: Requires multiple negative catalysts to align. AAL fundamentals improved significantly (debt reduction, free cash flow, credit card partnership). Industry tailwinds (fuel costs, capacity discipline) supportive. However, execution risk is real - weak leisure demand already evident, corporate recovery uncertain, negative equity creates vulnerability. The put seller clearly thinks this scenario has <25% odds or they wouldn't collect $10.8M in premium.
Put seller P&L in Bear Case (PAINFUL):
-
Stock at $11 at May expiration:
- $13 puts ITM by $2: Loss = $2 × 85,000 = $170M, offset by $7.8M premium = $162.2M NET LOSS
- $12 puts ITM by $1: Loss = $1 × 80,000 = $80M, offset by $3.0M premium = $77M NET LOSS
- TOTAL CATASTROPHIC LOSS: $239.2M (vs $10.8M max gain)
-
Stock at $10 at May expiration:
- $13 puts ITM by $3: $247.2M NET LOSS
- $12 puts ITM by $2: $157M NET LOSS
- TOTAL WIPEOUT: $404.2M LOSS (37x the premium collected!)
This is why naked put selling is EXTREMELY RISKY - limited upside ($10.8M) but theoretically unlimited downside (if stock goes to $0, losses would be $2+ BILLION).
💡 Trading Ideas
🛡️ Conservative: Follow the Smart Money - Small Put Sale After Confirmation
Play: Sell cash-secured puts at lower strikes ONLY after confirming Q2 earnings don't crater
Why this works:
- 🏦 Institutional player with $10.8M at risk clearly did deep due diligence - their conviction is meaningful signal
- 💰 Collecting premium on high IV (30%+ implied vol) while getting paid to potentially buy AAL at discount
- 🛡️ Cash-secured = defined risk (you MUST have cash to buy 100 shares per contract)
- 📊 Gamma support at $12-13 creates natural floor for put selling
- ⏰ Selling shorter-dated puts (30-45 days) captures theta decay more efficiently
- 📈 If assigned stock at $12-13, you're buying 15-20% below current levels with strong support
Conservative structure:
- ⏰ Wait for Q2 earnings (July 2025) - need to see revenue trajectory and guidance
- 🎯 IF earnings OK: Sell $12 puts expiring August 2025 (30-45 days out)
- 💰 Target premium: $0.25-0.40 per contract ($25-40 per contract)
- 📊 Position size: 1-2 contracts MAX (requires $1,200-2,400 cash secured)
- 🛡️ Risk management: Only sell if you're WILLING to own AAL at $12 (true cash-secured strategy)
Expected outcome:
- ✅ Best case: Collect $30-40 premium per contract, puts expire worthless (ROI: 2-3% in 30-45 days)
- ⚖️ Assigned case: Forced to buy AAL at $12, cost basis ~$11.60-11.70 after premium (stock must drop 20%+ from current levels)
- 💰 Annualized return: ~20-25% if consistently selling 30-45 day puts on cash (compounding monthly)
Action plan:
- 👀 Monitor Q2 earnings closely (July 2025) for revenue growth, margins, and guidance quality
- ✅ Need to see: Revenue flat to +1%, operating margins 5%+, corporate recovery continuing
- ❌ Avoid if: Revenue down 2%+, margins compress below 4%, guidance disappoints again
- 📊 Only deploy 5-10% of portfolio to this strategy (don't go all-in on airlines!)
Risk level: Low-Moderate (cash-secured, willing owner) | Skill level: Intermediate
⚖️ Balanced: Put Credit Spread - Copy the Structure with Defined Risk
Play: Sell put spread mirroring institutional positioning but with defined max loss
Structure: Sell $13 puts, Buy $12 puts (May 15, 2026 expiration - SAME as Trade #1)
Why this works:
- 📊 Defined risk spread ($1 wide = $100 max risk per spread)
- 🎯 Targets same gamma support zone at $12-13 where institutions positioned
- 🤝 Essentially "copying" the smart money but with risk controls they may not need
- ⏰ 161 days to expiration gives time for corporate recovery and debt reduction to materialize
- 💰 Collect premium from elevated IV without naked put risk
- 🛡️ Max loss capped at spread width minus premium collected
Estimated P&L:
- 💰 Credit collected: ~$0.35-0.45 net (sell $13 puts for ~$0.90, buy $12 puts for ~$0.50)
- 📈 Max profit: $35-45 per spread if AAL above $13 at May expiration
- 📉 Max loss: $55-65 per spread if AAL below $12 (defined and limited)
- 🎯 Breakeven: ~$12.55-12.65
- 📊 Risk/Reward: ~1.5:1 (acceptable for bullish assumption trade)
Entry considerations:
- ⏰ Could enter NOW (copy the institutional timing) OR wait for Q2 earnings clarity
- 🎯 Better risk/reward entering on any pullback toward $14.00-14.25
- ❌ Skip if stock already below $13.50 (spread too close to at-the-money)
- 📊 Look for IV spike (40%+) to maximize premium collection
Position sizing:
- 🎯 Risk 2-5% of portfolio maximum (this is directional speculation)
- 💰 Example: $10,000 portfolio = sell 3-8 spreads ($165-520 max risk)
- 📊 Treat as "high conviction bullish bet with training wheels"
Management plan:
- ✅ Take profit at 50% max gain ($17-22 per spread) if achieved with 60+ days remaining
- 📉 Hold to expiration if AAL trading $13.50+ with 30 days left (let theta work)
- 🚨 Close immediately if AAL breaks below $13 with 60+ days left (cut losses early)
- 🔄 Could roll down/out if stock consolidates $13-14 range approaching expiration
Risk level: Moderate (defined risk, bullish directional) | Skill level: Intermediate
🚀 Aggressive: Naked Put Selling - Maximum Premium (EXPERT ONLY!)
Play: Sell naked puts replicating the institutional trade at smaller scale
Structure: Sell $13 puts May 2026 OR $12 puts March 2026
Why this could work:
- 💰 MAXIMUM PREMIUM: Collect full $0.90-0.92 for $13 puts or $0.38 for $12 puts (no protection purchase)
- 🎯 Betting AAL stays above strikes just like the $10.8M institutional player
- 📊 Gamma support at both levels creates "smart money" positioning
- ⏰ Time decay working in your favor - collect theta daily
- 🏦 If you have 25-50% cash margin requirement, can leverage returns significantly
- 🤝 Institutions clearly believe risk/reward favorable at these strikes
- 💪 At $13 strike, getting paid 6.3% premium for 161-day obligation
Why this could blow up (SERIOUS RISKS):
⚠️ CRITICAL WARNING - READ THIS CAREFULLY:
This is NAKED PUT SELLING - the same strategy that has bankrupted retail traders, blown up hedge funds, and caused massive losses. Here's what can go wrong:
-
💸 UNLIMITED DOWNSIDE: If AAL goes to $8, you lose $5 per share × contracts sold
- Example: Sell 10 contracts of $13 puts, AAL drops to $8 = $50,000 LOSS (vs $9,200 max gain)
- The institutional player can survive $100M+ losses - CAN YOU?
-
📉 MARGIN CALLS FROM HELL: As AAL drops, broker will demand MORE cash
- Stock drops to $12: Broker demands $20,000+ additional margin immediately
- Can't meet margin call? Forced liquidation at the WORST possible time
- Your entire account can be wiped out in 1-2 bad days
-
🎢 ASSIGNMENT RISK: You WILL be assigned stock if puts go ITM
- Must buy 100 shares per contract at strike price
- 10 contracts = forced to buy $13,000 worth of stock you may not want
- If you don't have cash, broker sells at market (guaranteeing max loss)
-
😱 BLACK SWAN EVENTS: Oil crisis, recession, bankruptcy rumors = stock gaps to $6-8
- Implied move shows $9.83 lower range over 1 year - this is POSSIBLE
- In 2020 COVID crash, airlines dropped 60-70% in weeks
- Your losses would be catastrophic and unrecoverable
-
🔥 NO PROTECTION: Unlike the put spread strategy, you have ZERO downside hedge
- Every dollar AAL drops below strike = dollar-for-dollar loss
- Institutions can weather storms - retail traders get wiped out
Estimated P&L (IF YOU IGNORE WARNINGS):
-
💰 Sell 10 contracts of $13 May 2026 puts:
- Premium collected: $0.92 × 10 × 100 = $9,200 max gain
- Margin required: ~$13,000-15,000 (20-25% of obligation)
- Max theoretical loss: $130,000 if AAL goes to $0
- Breakeven: $12.08
-
💰 Sell 20 contracts of $12 March 2026 puts:
- Premium collected: $0.38 × 20 × 100 = $7,600 max gain
- Margin required: ~$24,000-30,000
- Max theoretical loss: $240,000 if AAL goes to $0
- Breakeven: $11.62
Probability of profit: ~65-70% (based on implied probabilities), BUT... Probability of CATASTROPHIC loss: 5-10% (based on tail risk scenarios)
THIS IS NOT WORTH THE RISK FOR 99% OF TRADERS
ONLY attempt naked put selling if you:
- ✅ Have $100,000+ liquid net worth (can absorb total loss)
- ✅ Maintain 200%+ cash margin buffer (never use max margin)
- ✅ Have sold naked options through market crashes before
- ✅ Can sleep at night with unlimited downside risk
- ✅ Understand options Greeks, margin mechanics, and assignment procedures
- ✅ Have iron discipline to close at 100-200% loss rather than "hoping" for recovery
- ✅ Accept that one bad trade can wipe out 2+ years of successful premium collecting
Risk level: EXTREME (unlimited downside risk) | Skill level: Expert only
Alternative approach: Instead of naked puts, do the Balanced strategy (put credit spread) 5-10 times. You'll collect similar premium ($350-450 vs $900-920) but with DEFINED $100 max loss per spread vs UNLIMITED loss on naked puts. Math: Risk $550-650 to make $350-450 (1.5:1) across 10 spreads = same profit potential as 1 naked put but with controlled risk.
⚠️ Risk Factors
Don't get caught by these potential landmines:
-
📉 Negative shareholder equity of -$4.0 billion: AAL has negative book value of -$4.0B with debt-to-equity ratio of -707.9% - among the WORST in the airline sector. This creates existential vulnerability in any downturn. If revenue deteriorates meaningfully, the company has limited financial flexibility to weather the storm. Competitors like Delta have positive equity and investment-grade credit - AAL does not. This is the #1 reason the stock trades at depressed multiples despite operational improvements.
-
💸 Withdrawn 2025 guidance signals uncertainty: Management withdrew full-year 2025 guidance in April citing "economic uncertainty" and weak leisure demand. They provided Q2 guidance but refused to commit beyond that. Translation: Management doesn't have confidence in the demand environment. The fact they cited "domestic leisure travel fell off considerably" starting February 2025 suggests structural weakness, not just seasonal variance.
-
🎢 Stock down 25% YTD while United up 118%: AAL declined 25% in 2025 while United Airlines soared 118.65%. This massive underperformance vs peers signals the market sees structural disadvantages specific to AAL. Investors choosing Delta/United over AAL despite similar industry tailwinds (lower fuel costs, capacity discipline). Gap may widen further if operational execution diverges.
-
🏦 $28 billion total debt despite $15B reduction: While achieving $15B debt reduction ahead of schedule is impressive, AAL still carries $28.0B total debt. The 2027 target of below $35B debt shows this will be multi-year burden. Interest expense limits capital allocation flexibility. Any revenue miss forces choice between debt reduction and operational investments.
-
📊 Corporate revenue recovery stalled at -7%: Despite 20% headcount increase in account management and restoring fares to GDS platforms, AAL remains -7% below historical indirect channel share. Progress from -11% to -7% has stalled. The $14B annual indirect channel revenue at risk represents significant upside IF recovered, but execution uncertain. What if business travelers permanently shifted to Delta/United?
-
⛽ Fuel price volatility - favorable now but could reverse: While 2025 jet fuel averaging $86/barrel vs $99 in 2024 (13% decline) is huge tailwind, this could reverse quickly. Middle East tensions, Russia-Ukraine conflict, OPEC production cuts could spike oil to $110-120/barrel. Every $1/barrel change = ~$30-40M annual impact for AAL. Current favorable environment may be temporary.
-
😰 Leisure demand "considerably weak" per management: The April 2025 commentary about leisure demand falling off "considerably" starting February is concerning. This suggests consumer spending weakness specific to discretionary travel. If recession emerges, leisure collapses first. AAL more exposed to leisure vs Delta/United who have stronger premium/business mix. Summer 2025 season critical test - any disappointment validates bearish thesis.
-
🌍 North American margin pressure - only 0.7% operating margins: Industry data shows North America operating margins of only 0.7% vs 15.6% in Latin America and 6.2% in Asia/Pacific. AAL is heavily weighted to North American domestic market with the weakest regional margins. This structural disadvantage limits profitability even with strong load factors. Competitors with better international networks capture higher-margin routes.
-
💀 Low-cost carrier disruption - Spirit bankruptcy creates chaos: Spirit filed Chapter 11 bankruptcy twice within a year, creating market uncertainty. Frontier and United expanding into Spirit's markets, intensifying price competition. AAL faces pressure from below (LCCs) and above (Delta/United premium products). Caught in the middle with limited pricing power.
-
🛫 Boeing delivery delays constrain growth: Continued 737 MAX production issues and supply chain constraints delay fleet modernization. AAL expecting only 14 Boeing 737 MAX aircraft in 2025, followed by 23 in 2026. Unable to execute route expansion plans at scale. Older fleet has higher maintenance costs. Boeing's problems become AAL's problems.
-
💰 Premium capacity expansion gamble - 20%+ increase by 2026: AAL is retrofitting A319/A320 to increase first-class seats and growing premium capacity 20%+ by end 2026. This bet assumes corporate travel recovery materializes and business demand stays strong. If recovery stalls or economy weakens, empty premium seats destroy RASM and profitability. High fixed cost of retrofits with uncertain demand ROI.
-
🚨 Q2 guidance already disappointing - $0.50-$1.00 EPS range: The Q2 adjusted EPS guidance of $0.50-$1.00 badly missed analyst consensus of $0.99. Revenue guidance of -2% to +1% also below 2.2% consensus expectation. This suggests Q2 will be weak even in base case. Any miss vs already-lowered guidance would be catastrophic for stock. The bar is low but AAL may still trip over it.
-
📉 Gamma resistance at $15 creates natural ceiling: Massive 42.5M call gamma at $15.00 means market makers will systematically SELL into any rallies to hedge their exposure. This creates mechanical selling pressure making breakouts difficult. Current price ($14.50-14.60) sitting just under this ceiling. Would need sustained institutional buying to overcome. Recent failed breakout to $19.10 shows this dynamic in action.
-
🎰 Put seller's unlimited downside vs $10.8M upside: The institutional trader collected $10.8M premium but faces BILLIONS in potential losses if AAL collapses. While unlikely, if AAL drops to $8-9 (not impossible in severe recession), losses would be $300-400M+. This asymmetric risk profile means even small probability of catastrophe creates expected value concerns. The fact they're willing to take this risk either signals extreme confidence OR portfolio hedging needs we don't understand.
🎯 The Bottom Line
Real talk: Someone just SOLD $10.8 MILLION in AAL put options, essentially saying "I'm so confident AAL won't drop below $12-13 over the next 5 months that I'll accept UNLIMITED downside risk to collect this premium." This isn't a bearish short - it's a massively bullish bet disguised as income generation.
What this trade tells us:
- 🎯 Sophisticated institutional player sees AAL risk/reward as FAVORABLE despite negative equity and weak guidance
- 💰 They're willing to potentially buy 16.5 million shares at $12-13 (worth $200M+) - not something you do if you think airline is heading to $8-9
- ⚖️ The timing (after guidance withdrawal, 25% YTD decline) suggests they see capitulation bottom forming
- 📊 They struck EXACTLY at gamma support levels ($13 = 21.1M, $12 = 33.4M) showing sophisticated technical analysis
- ⏰ Expiration dates (March and May 2026) capture Q2 earnings, summer travel season, corporate recovery progress, and A321XLR launch
- 🏦 $10.8M premium represents their conviction that probability of AAL below $12-13 is <30% (otherwise wouldn't collect premium vs downside risk)
This is a "the worst is over" signal for AAL, NOT a "buy with both hands" signal.
If you own AAL:
- ✅ Consider this a bullish confirmation - institutional money willing to take OTHER SIDE of panic sellers
- 📊 Set mental stop at $13.50-14.00 (just below gamma support) to protect against breakdown
- ⏰ Monitor Q2 earnings (July 2025) closely - revenue trajectory and guidance quality determine next 6 months
- 🎯 If holding, target $15.50-16.00 for partial profit taking (gamma resistance creates natural ceiling)
- 💪 The debt reduction achievement, $2.2B FCF, and $6.1B credit card revenue are REAL positives supporting floor
If you're watching from sidelines:
- ⏰ Wait for Q2 earnings clarity (July) before aggressive positioning
- 🎯 Post-earnings pullback to $13.00-13.50 would be EXCELLENT entry (10-15% below current, right at put strikes)
- 📈 Looking for confirmation: Revenue flat to +1%, margins 5%+, corporate recovery continuing toward -5% vs historical
- 🚀 Longer-term (12-18 months), corporate revenue restoration, A321XLR success, and continued debt reduction could drive $16-18
- ⚠️ Current risk/reward is NEUTRAL at $14.50-14.60 - better entry exists with patience
If you're bearish:
- 🎯 The $10.8M institutional put SALE is a WARNING - smart money taking other side of your bet
- 📊 First support at $14.00-14.50 (gamma), major support at $13.00 (put strike #1), disaster floor at $12.00 (put strike #2)
- ⚠️ Betting against this trade requires conviction that AAL breaks $12 (would need recession, bankruptcy fears, or catastrophic demand collapse)
- 📉 Risk/reward for shorts is POOR - stock already down 25% YTD with significant bad news priced in
- ⏰ If going bearish, wait for rally to $15-15.50 resistance before shorting/buying puts
Mark your calendar - Key dates:
- 📅 December 12, 2025 - Weekly options expiration (4% implied move)
- 📅 December 19, 2025 - Monthly OPEX & Quarterly Triple Witch
- 📅 July 2025 (TBD) - Q2 FY2025 earnings report (CRITICAL for 2H2025 outlook)
- 📅 March 20, 2026 - Expiration of $12 put trade ($3.0M premium at stake)
- 📅 May 15, 2026 - Expiration of $13 put trade ($7.8M premium at stake)
- 📅 Summer 2026 - Prague and Budapest routes launch, A321XLR deployment expands
Final verdict: AAL's turnaround story is REAL but FRAGILE. The $15B debt reduction, $2.2B free cash flow, $6.1B Citi partnership, and 50+ new routes are legitimate positives. BUT, negative equity (-$4.0B), massive debt ($28B), withdrawn guidance, and 25% YTD underperformance show the market doesn't trust the recovery yet.
The $10.8M institutional put sale is a STRONG BULLISH signal - someone with serious capital and sophisticated analysis is betting AAL stays above $12-13. However, this doesn't mean you should blindly follow.
Be patient. Wait for Q2 earnings. Look for entry at $13.00-13.50 if quality of results supports recovery thesis. The risk/reward improves significantly 5-10% lower from current levels.
This is a show-me story. Let AAL prove the bulls right before committing significant capital. 💪
Disclaimer: Options trading involves substantial risk of loss and is not suitable for all investors. This analysis is for educational purposes only and not financial advice. Selling naked puts creates UNLIMITED LOSS potential and is suitable only for sophisticated investors with significant capital. The unusual scores (830.38x and 14.99x average size) reflect these specific trades' size relative to recent AAL history - they do not imply the trades will be profitable or that you should follow them. Always do your own research and consider consulting a licensed financial advisor before trading. American Airlines faces significant financial risks including negative shareholder equity, high debt levels, and uncertain demand recovery.
About American Airlines Group: American Airlines operates as the world's largest airline by aircraft and capacity. The company maintains major U.S. hubs and generates over 30% of U.S. airline revenue through connections between Latin America and U.S. destinations, with a market cap of $9.47 billion in the Air Transportation, Scheduled industry.