🍎 AAPL Call Seller Dumps $19M - Profit Taking Before Q4 Earnings! 💰
📅 October 7, 2025 | 🔥 Unusual Activity Detected
🎯 The Quick Take
Big money just dumped $19 MILLION worth of Apple call options - someone's cashing out after AAPL's recent run to $256! This massive sell at the $220 strike with 45 days to expiration suggests institutional profit-taking before the October 30th earnings call. With AAPL up +4.95% YTD and trading near resistance, this player is taking chips off the table. Translation: Smart money is locking in gains!
📊 Company Overview
Apple Inc. (AAPL) is the world's most valuable technology company with:
- Market Cap: $3.81 Trillion
- Industry: Electronic Computers
- Employees: 164,000
- Primary Business: Apple designs and manufactures smartphones, personal computers, tablets, wearables, and accessories. The company also offers services including advertising, cloud, digital content, and payment services.
💰 The Option Flow Breakdown
📊 What Just Happened
The Tape (October 7, 2025 @ 12:01:47):
| Time | Symbol | Side | Buy/Sell | Type | Expiration | Premium | Strike | Volume | OI | Size | Spot | Option Price | Option Symbol |
|---|---|---|---|---|---|---|---|---|---|---|---|---|---|
| 12:01:47 | AAPL | BID | SELL | CALL | 2025-11-21 | $19M | $220 | 4.9K | 8K | 4,900 | $256.27 | $38.25 | AAPL20251121C220 |
🤓 What This Actually Means
This is a massive call sell - a textbook example of institutional profit-taking:
- Selling 4,900 contracts of deep in-the-money calls ($220 strike vs $256.27 spot)
- Collecting $19M in premium ($38.25 per option × 4,900 contracts × 100)
- Options expiring November 21, 2025 (45 days out, right after Q4 earnings on October 30th)
- Volume of 4.9K exceeded half the open interest of 8K - this is serious selling!
- These calls are $36.27 in-the-money - someone is closing a profitable position
Unusual Score: EXTREME (8,034x average size) - This size happens roughly every 4-5 days! This is a massive institutional position being unwound.
Real talk: When you see premium this large getting sold, it's usually a hedge fund or institutional desk that's been riding the AAPL rally and wants to book profits before volatility around earnings. They're not necessarily bearish - they're just smart about taking money off the table.
📈 Technical Setup / Chart Check-Up
YTD Performance Chart
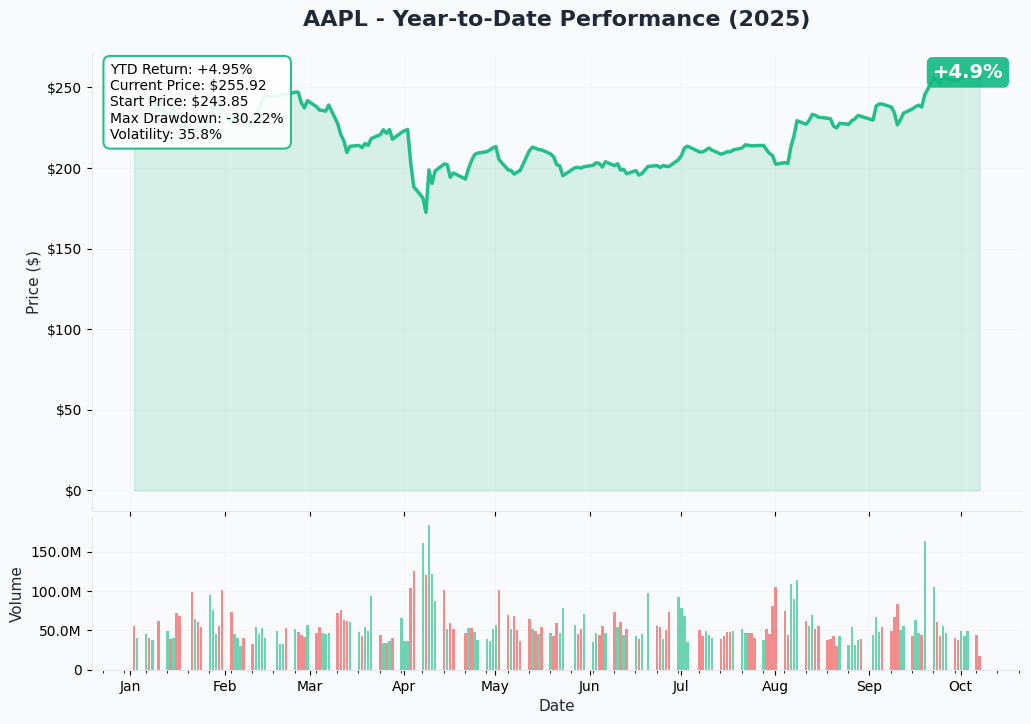
Apple is having a solid 2025 with +4.95% YTD returns. The chart tells a compelling story:
Key observations:
- Current Price: $255.92 near the YTD highs
- Started the year at $243.85
- Maximum drawdown: -30.22% (hit $170 in April - brutal selloff!)
- Strong recovery: Rallied over 50% from April lows to current levels
- Volatility: 35.8% suggests decent option premiums
- Recent momentum: September-October rally brought AAPL back to near all-time territory
The technical setup shows AAPL consolidating at highs after a monster recovery. This is exactly when smart money takes profits!
🎯 Gamma-Based Support & Resistance Analysis
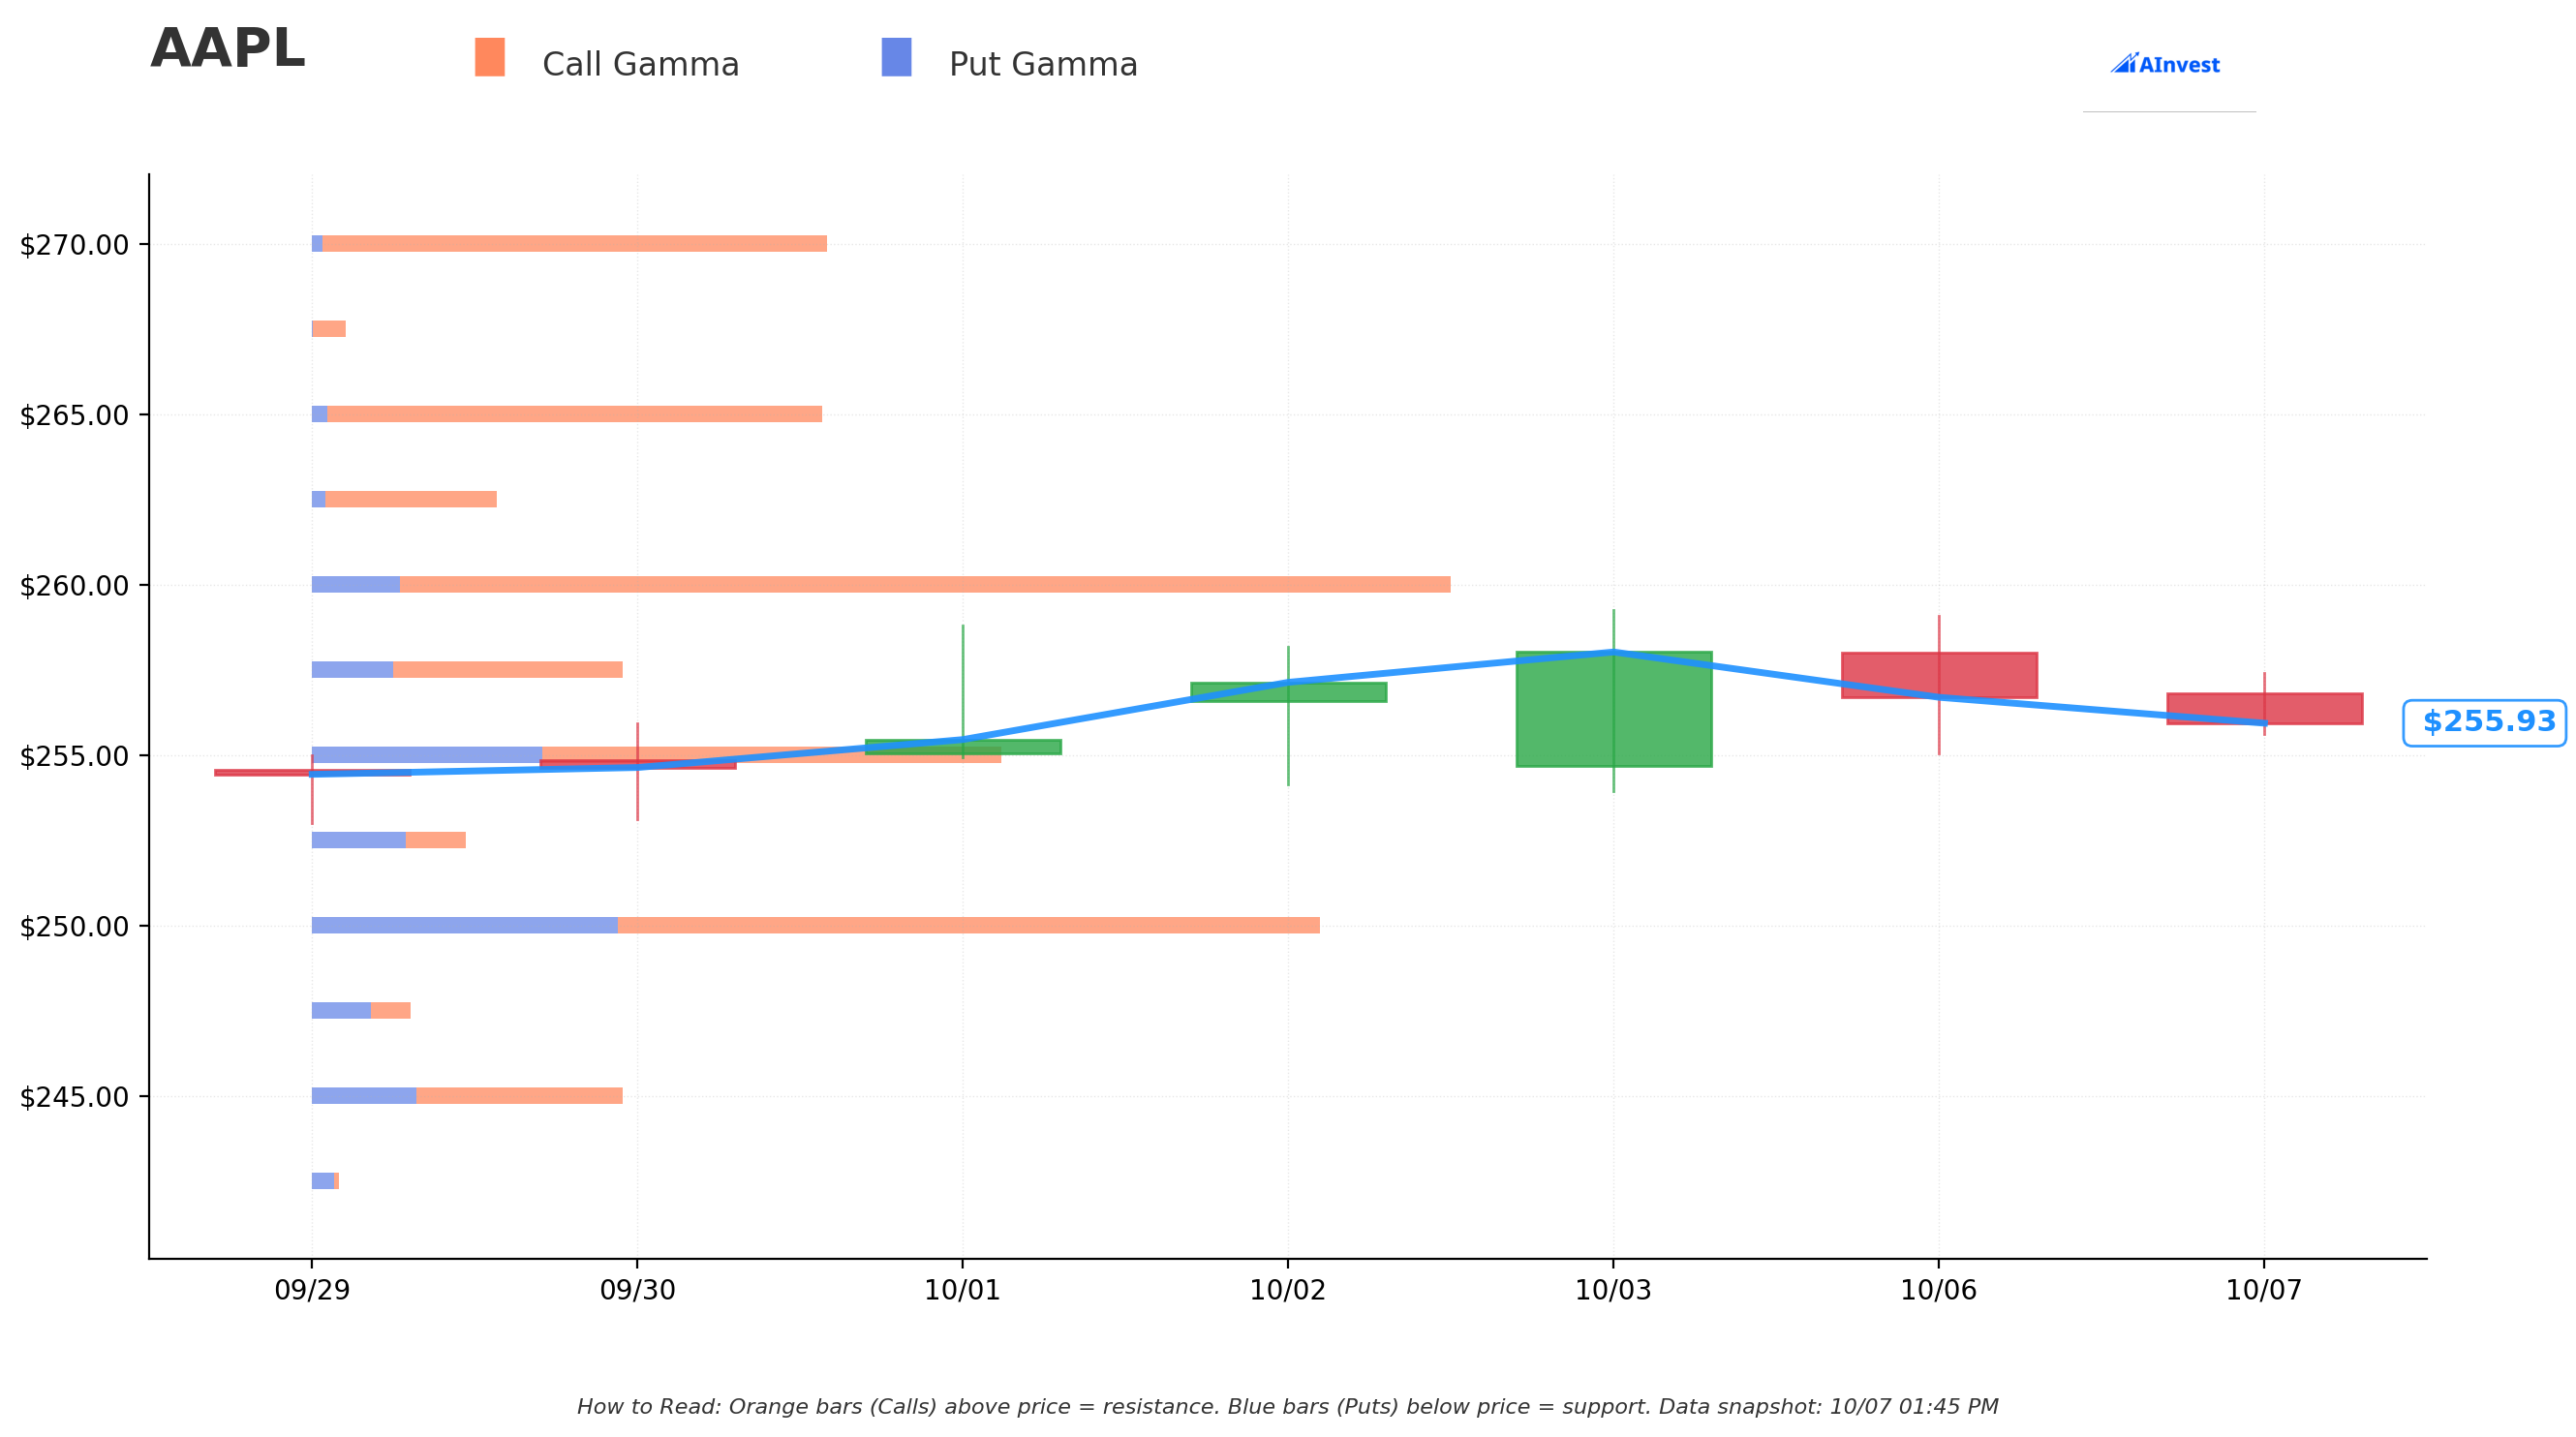
Current Price: $255.93
The gamma chart reveals critical price levels where options positioning creates natural support and resistance:
Resistance Zones (Orange bars above):
- $257.50: First resistance just 0.6% away - minor speed bump
- $260: MAJOR resistance with 153M in call gamma (1.6% above current) - this is THE ceiling
- $265: Secondary wall with 72M in call gamma (3.6% above)
- $270: Another significant barrier with 74M call gamma (5.5% above)
- $280: Long-term target with 36M gamma (9.4% above current price)
Support Zones (Blue bars below):
- $255: Strongest support at current level with 100M total gamma - we're sitting right on it!
- $250: Solid floor with 147M total gamma (2.3% below) - would be a gift buying opportunity
- $245: Secondary support with 45M gamma (4.2% below)
- $240: Strong support with 54M gamma (6.2% below)
- $230: Major floor with 35M gamma (10% below) - unlikely to test unless major news
What This Means: The gamma data shows AAPL is pinned between $255 support and $260 resistance. That $260 level is absolutely loaded with call options - meaning options sellers will naturally push against rallies above this level. This perfectly explains why someone would cash out $19M in calls here!
Net GEX Bias: Bullish (840M call gamma vs 269M put gamma) - Options positioning still favors upside, but $260 is a tough nut to crack short-term.
🎪 Catalysts
Upcoming Events
Q4 2025 Earnings - October 30, 2025
- Wall Street expects revenue around $95 billion (Source: WebProNews)
- Consensus EPS estimate of $1.76 with range of $1.63-$1.83 (Source: TipRanks)
- First full quarter to include iPhone 17 launch impact
- Apple forecasting mid-to-high single-digit revenue growth (Source: Ainvest)
iPhone 17 Demand Strength
- Launch demand 19% higher than iPhone 16 series (Source: Gadget Hacks)
- 71% of consumers surveyed expressed intent to purchase new iPhone in 2025 (Source: AppleInsider)
- Apple boosting production by at least 30% due to stronger-than-expected preorders (Source: Gadget Hacks)
Apple Intelligence Expansion
- Live Translation across Messages, FaceTime, and Phone calls now available (Source: Apple Newsroom)
- International expansion to eight more languages including Chinese, Dutch, and Portuguese (Source: Apple Newsroom)
- Foundation Models Framework allowing third-party developers to integrate Apple Intelligence (Source: Apple Newsroom)
Recently Completed
Q3 2025 Earnings Beat
- Delivered $94 billion in revenue, up 10% year-over-year (Source: Six Colors)
- iPhone revenue: $44.6 billion, up 13.2% (Source: Ainvest)
- Services revenue: $27.4 billion, up 13% to all-time high (Source: Ainvest)
- EPS of $1.57, beating estimates of $1.43 by $0.14 (Source: MarketBeat)
China Revenue Growth Returns
- China revenue grew 4.4% to $15.4 billion, marking the first growth in two years (Source: Ainvest)
🎲 Price Targets & Probabilities
Using gamma levels, catalyst timing, and technical setup:
🚀 Bull Case (30% chance)
Target: $270-$280
This happens if earnings absolutely crush expectations and iPhone 17 demand accelerates further:
- Q4 earnings beat on both revenue and EPS with strong guidance
- iPhone 17 sales exceed even bullish estimates with ASP expansion
- Services growth accelerates above 15% with margin expansion
- China recovery narrative strengthens with sequential growth
- Apple Intelligence adoption metrics impress investors
Key levels to watch:
- Need to break $260 resistance (major gamma wall)
- Then $265 becomes next test
- $270 resistance must flip to support
- $280 would be massive breakout to new highs
What could make this happen: Blow-out earnings plus $310-$320 analyst target raises from multiple firms would provide the fuel.
😐 Base Case (50% chance)
Target: $250-$265 range
Most likely scenario - AAPL trades sideways to slightly up around current gamma equilibrium:
- Q4 earnings meet expectations with in-line guidance
- iPhone 17 sales solid but not spectacular
- China shows stability but not acceleration
- Services growth continues mid-teens pace
- Stock remains range-bound between support and resistance
Key levels to watch:
- $255 support holds (current strong gamma floor)
- $260 continues to act as ceiling until earnings
- Post-earnings volatility resolves back to this range
Why this is base case: The $19M call sell suggests smart money expects consolidation. Gamma positioning shows price naturally wants to stay between $250-$260 until a catalyst forces a breakout.
😰 Bear Case (20% chance)
Target: $230-$245
This requires genuine disappointment on fundamentals:
- Q4 earnings miss or guidance disappoints
- iPhone 17 demand normalizes faster than expected
- China shows weakness or competitive pressure
- Services growth decelerates below 10%
- Broader market correction hits tech valuations
Key levels to watch:
- Break of $250 support would signal trouble
- $245 next major support level
- $240 strong gamma floor must hold
- Below $230 would mean serious fundamental concern
What could trigger this: Earnings miss plus guidance cut would do it. Or major macro event causing risk-off in high-multiple tech stocks.
💡 Trading Ideas
🛡️ Conservative: Cash-Secured Put Strategy
Play: Sell the November 21 $245 puts
- Collect $3-4 per contract in premium
- Only get assigned if AAPL drops 4.2% to $245
- If assigned, you own AAPL at $245 (with $3-4 discount from premium)
- Win if AAPL stays above $245 by November 21
Risk: Maximum risk is owning AAPL at $245 (probably not the worst thing!) Reward: Keep premium if stays above $245
Why this works: The $245 support level has strong gamma backing. You're selling puts at technical support with great risk/reward.
⚖️ Balanced: Bull Put Spread
Play: Sell November 21 $250 puts, Buy November 21 $240 puts
- Collect $3-4 credit per spread
- Max loss $7-6 per spread (capped risk!)
- Profit if AAPL stays above $250 (strong gamma support)
- Breakeven around $246-247
Risk: $600-700 per spread maximum loss Reward: $300-400 per spread maximum profit
Why this works: Defined risk with support levels at both strikes. The gamma data shows these are natural floors. Post-earnings volatility crush helps this trade.
🚀 Aggressive: Call Debit Spread
Play: Buy November 21 $255 calls, Sell November 21 $265 calls
- Pay $4-5 debit per spread
- Max profit $5-6 per spread if AAPL hits $265+
- Breakeven around $259-260
- Captures upside through earnings if bullish
Risk: $400-500 per spread (premium paid) Reward: $500-600 per spread maximum profit (100%+ return!)
Why this works: Counter-trade to the institutional sell. If earnings are strong, you profit from the move to $265. The gamma resistance becomes your profit target. High risk/high reward setup.
⚠️ Risk Factors
Earnings Volatility (October 30th):
- Q4 results in 23 days will be the make-or-break catalyst
- Any guidance disappointment could trigger 5-10% selloff
- iPhone 17 commentary will be heavily scrutinized
- Services growth trajectory matters for valuation
Valuation Concerns:
- P/E ratio of 38.95 is premium even for AAPL
- Jefferies downgraded to Underperform with $205 target citing valuation
- Consensus target of $247.49 actually below current price
- Any multiple compression risk if growth disappoints
Product Category Weakness:
- Wearables segment declined 9% in Q3 2025
- Apple Watch shipments down 19% year-over-year in 2024
- iPad revenue down 8% to $6.58B in Q3
- Vision Pro struggling with estimated sales under 500,000 units
China Market Uncertainty:
- While growing again, still vulnerable to geopolitical tensions
- Domestic competition from Huawei and others intensifying
- Regulatory risk remains elevated
- Critical 15-20% of revenue exposure
Technical Resistance:
- $260 gamma wall is formidable - lots of calls to work through
- Trading near YTD highs with limited upside room before resistance
- Need major catalyst to break through call gamma ceiling
- Momentum could stall if earnings don't deliver
🎯 The Bottom Line
Real talk: This $19M call sell is institutional profit-taking 101. Someone who's been riding AAPL's 50%+ rally from April lows is locking in gains ahead of earnings uncertainty. They're not saying AAPL is going down - they're saying "I've made enough and don't need the risk."
If you own AAPL: Consider trimming 20-30% to reduce risk ahead of earnings. You can always buy back after October 30th if results are strong. The gamma data shows $260 is tough resistance - taking some off at $256 is smart risk management.
If you're watching: October 30th earnings is your make-or-break date. The setup favors a $250-$265 consolidation into the print. If you're bullish, wait for a dip to $250 support to enter. If you're bearish, $260 is your shorting level.
If you're trading options: The premium being taken off suggests reduced conviction short-term. Selling premium strategies (put spreads, covered calls) make more sense than buying directional calls here. Let IV come down post-earnings before getting aggressive long.
Mark your calendar: October 30th after market close is when we get answers. Until then, AAPL is likely stuck between $250 support and $260 resistance. Trade the range, don't fight the gamma!
Disclaimer: Options trading involves substantial risk. This analysis is for educational purposes only and not financial advice. Past performance doesn't guarantee future results.
About Apple Inc.: Apple is the world's largest technology company by market capitalization at $3.81 trillion, designing and manufacturing consumer electronics including iPhone, Mac, iPad, Apple Watch, and AirPods, alongside growing Services offerings including Apple Music, iCloud, Apple TV+, and Apple Pay.