🍎 AAPL - Massive $40M Put Rollout Signals Institutional Hedging!
📅 December 31, 2025 | 🔥 Unusual Activity Detected
🎯 The Quick Take
Someone just rolled out $40.3M worth of put options in coordinated trades hitting at exactly 14:49:10 ET today - and this isn't retail panic, it's sophisticated institutional repositioning. The lead trade involved 23,000 puts at the $290 strike expiring Friday (2026-01-02) for a massive $22M premium, representing 13.5x average volume with a Z-score of 2.06 (highly unusual). Translation: Big money is aggressively hedging downside into year-end while systematically closing shorter-dated positions.
🏢 Company Overview
Apple Inc. (AAPL) is the world's most valuable company with a staggering $4.04 trillion market cap. In the electronic computers sector, Apple designs hardware (iPhone, Mac, iPad, Watch) and software (iOS, macOS) with an ecosystem of 2.3 billion active devices worldwide. The company generated $416.2B in revenue for fiscal 2025 with $112B in net income - both all-time records. Services revenue alone hit a $108.6B annual run rate with 1 billion paid subscriptions.
Currently trading at $272.84, AAPL is consolidating near all-time highs after iPhone 17 demand in China hit record levels (25% market share in October). The company employs 166,000 people and has been public since 1980.
💰 The Option Flow Breakdown
📊 What Just Happened
Here's the complete tape showing all five coordinated trades executing simultaneously at 14:49:10 ET:
| Time | Symbol | Buy/Sell | C/P | Expiration | Strike | Volume | Premium | OI | Size | Spot | Option Price | Option Symbol |
|---|---|---|---|---|---|---|---|---|---|---|---|---|
| 14:49:10 | AAPL | BUY | PUT | 2026-01-02 | $290 | 23,000 | $22.0M | 1,700 | 12,620 | $272.84 | $17.13 | AAPL20260102P290 |
| 14:49:10 | AAPL | SELL | PUT | 2026-01-16 | $295 | 4,100 | $9.0M | 348 | 4,070 | $272.84 | $22.19 | AAPL20260116P295 |
| 14:49:10 | AAPL | SELL | PUT | 2026-01-02 | $280 | 3,500 | $2.4M | 279 | 3,390 | $272.84 | $7.12 | AAPL20260102P280 |
| 14:49:10 | AAPL | SELL | PUT | 2026-01-09 | $290 | 2,600 | $4.3M | 200 | 2,490 | $272.84 | $17.10 | AAPL20260109P290 |
| 14:49:10 | AAPL | SELL | PUT | 2026-01-16 | $300 | 971 | $2.6M | 12,000 | 970 | $272.84 | $27.12 | AAPL20260116P300 |
Total Premium: $40.3M across 34,171 contracts
🤓 What This Actually Means
Classification Analysis (Calendar/Diagonal Rolls):
🔵 The Lead Position - $290 Friday Put (BUY $22M):
- Z-Score: 2.06 (Highly Unusual - occurs only a few times per month)
- Vol/OI Ratio: 13.5x (Volume is 13.5x larger than average activity)
- Similar Trades: 6 in recent history
- Strategy: BTC (Buy to Close existing short, or Buy to Open new hedge)
This is the anchor trade - someone aggressively bought 23,000 puts at $290 expiring in just 2 days (Friday, January 2, 2026). At $17.13 per contract, they paid $22M for the right to sell AAPL at $290 when it's trading at $272.84 - that's $17.16 out of the money. Translation: They're either closing a massive short put position before year-end OR establishing a brand new downside hedge paying pure time premium for 48 hours of protection.
🔴 The Offsetting Positions (SELL $18.3M total):
Four simultaneous SELL orders totaling $18.3M in premium collected:
- $295 Put (Jan 16): Z-Score 1.94, Vol/OI 11.8x - Above Average activity
- $280 Put (Jan 2): Z-Score 3.86, Vol/OI 12.5x - EXTREMELY UNUSUAL (highest Z-score in the batch)
- $290 Put (Jan 9): Z-Score 1.78, Vol/OI 13.0x - Above Average activity
- $300 Put (Jan 16): Z-Score 0.84, Vol/OI 0.08x - Typical/Low Activity
Net Cash Flow: -$22M (bought) + $18.3M (sold) = -$3.7M net debit
This is classic calendar/diagonal roll behavior - they're closing out scattered put positions across different strikes and dates while concentrating risk into the single $290 Friday expiration. The fact that all trades executed at the exact same millisecond (14:49:10) with "MEDIUM" confidence classification across the board screams automated institutional execution.
What They Know That We Don't:
- Someone believes AAPL needs aggressive downside protection for the next 48 hours
- They're willing to pay a net $3.7M to consolidate and extend this hedge
- The $280 put sell (Z-score 3.86 - extremely unusual) suggests they're comfortable with support at that level
- This is NOT speculation - these are sophisticated players managing existing positions into year-end
📈 Chart Check-Up
YTD Performance Overview
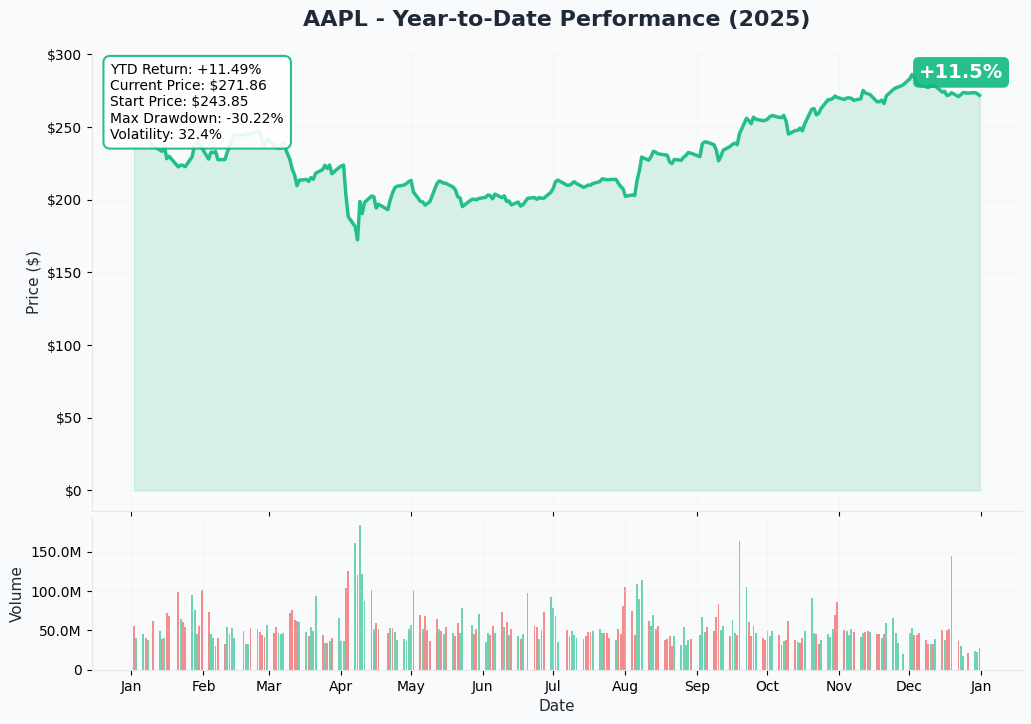
Apple has had an exceptional 2025, currently trading near all-time highs at $272.84 after bottoming around $185 earlier in the year. The iPhone 17 launch in September catalyzed a strong rally, with particular strength following Q4 FY2025 earnings on October 30 that showed record-breaking results ($102.5B revenue, $27.5B net income).
The stock has consolidated in a tight range recently as institutional holders like Berkshire Hathaway continue trimming positions (sold 61.8M shares in 2025) while new mega-cap buyers like Norges Bank ($38.9B position) provide support. The year-end consolidation sets up for a potential breakout into Q1 2026, particularly with Q1 earnings scheduled for January 29, 2026 expected to show 10-12% revenue growth.
🎯 Gamma-Based Support & Resistance Analysis
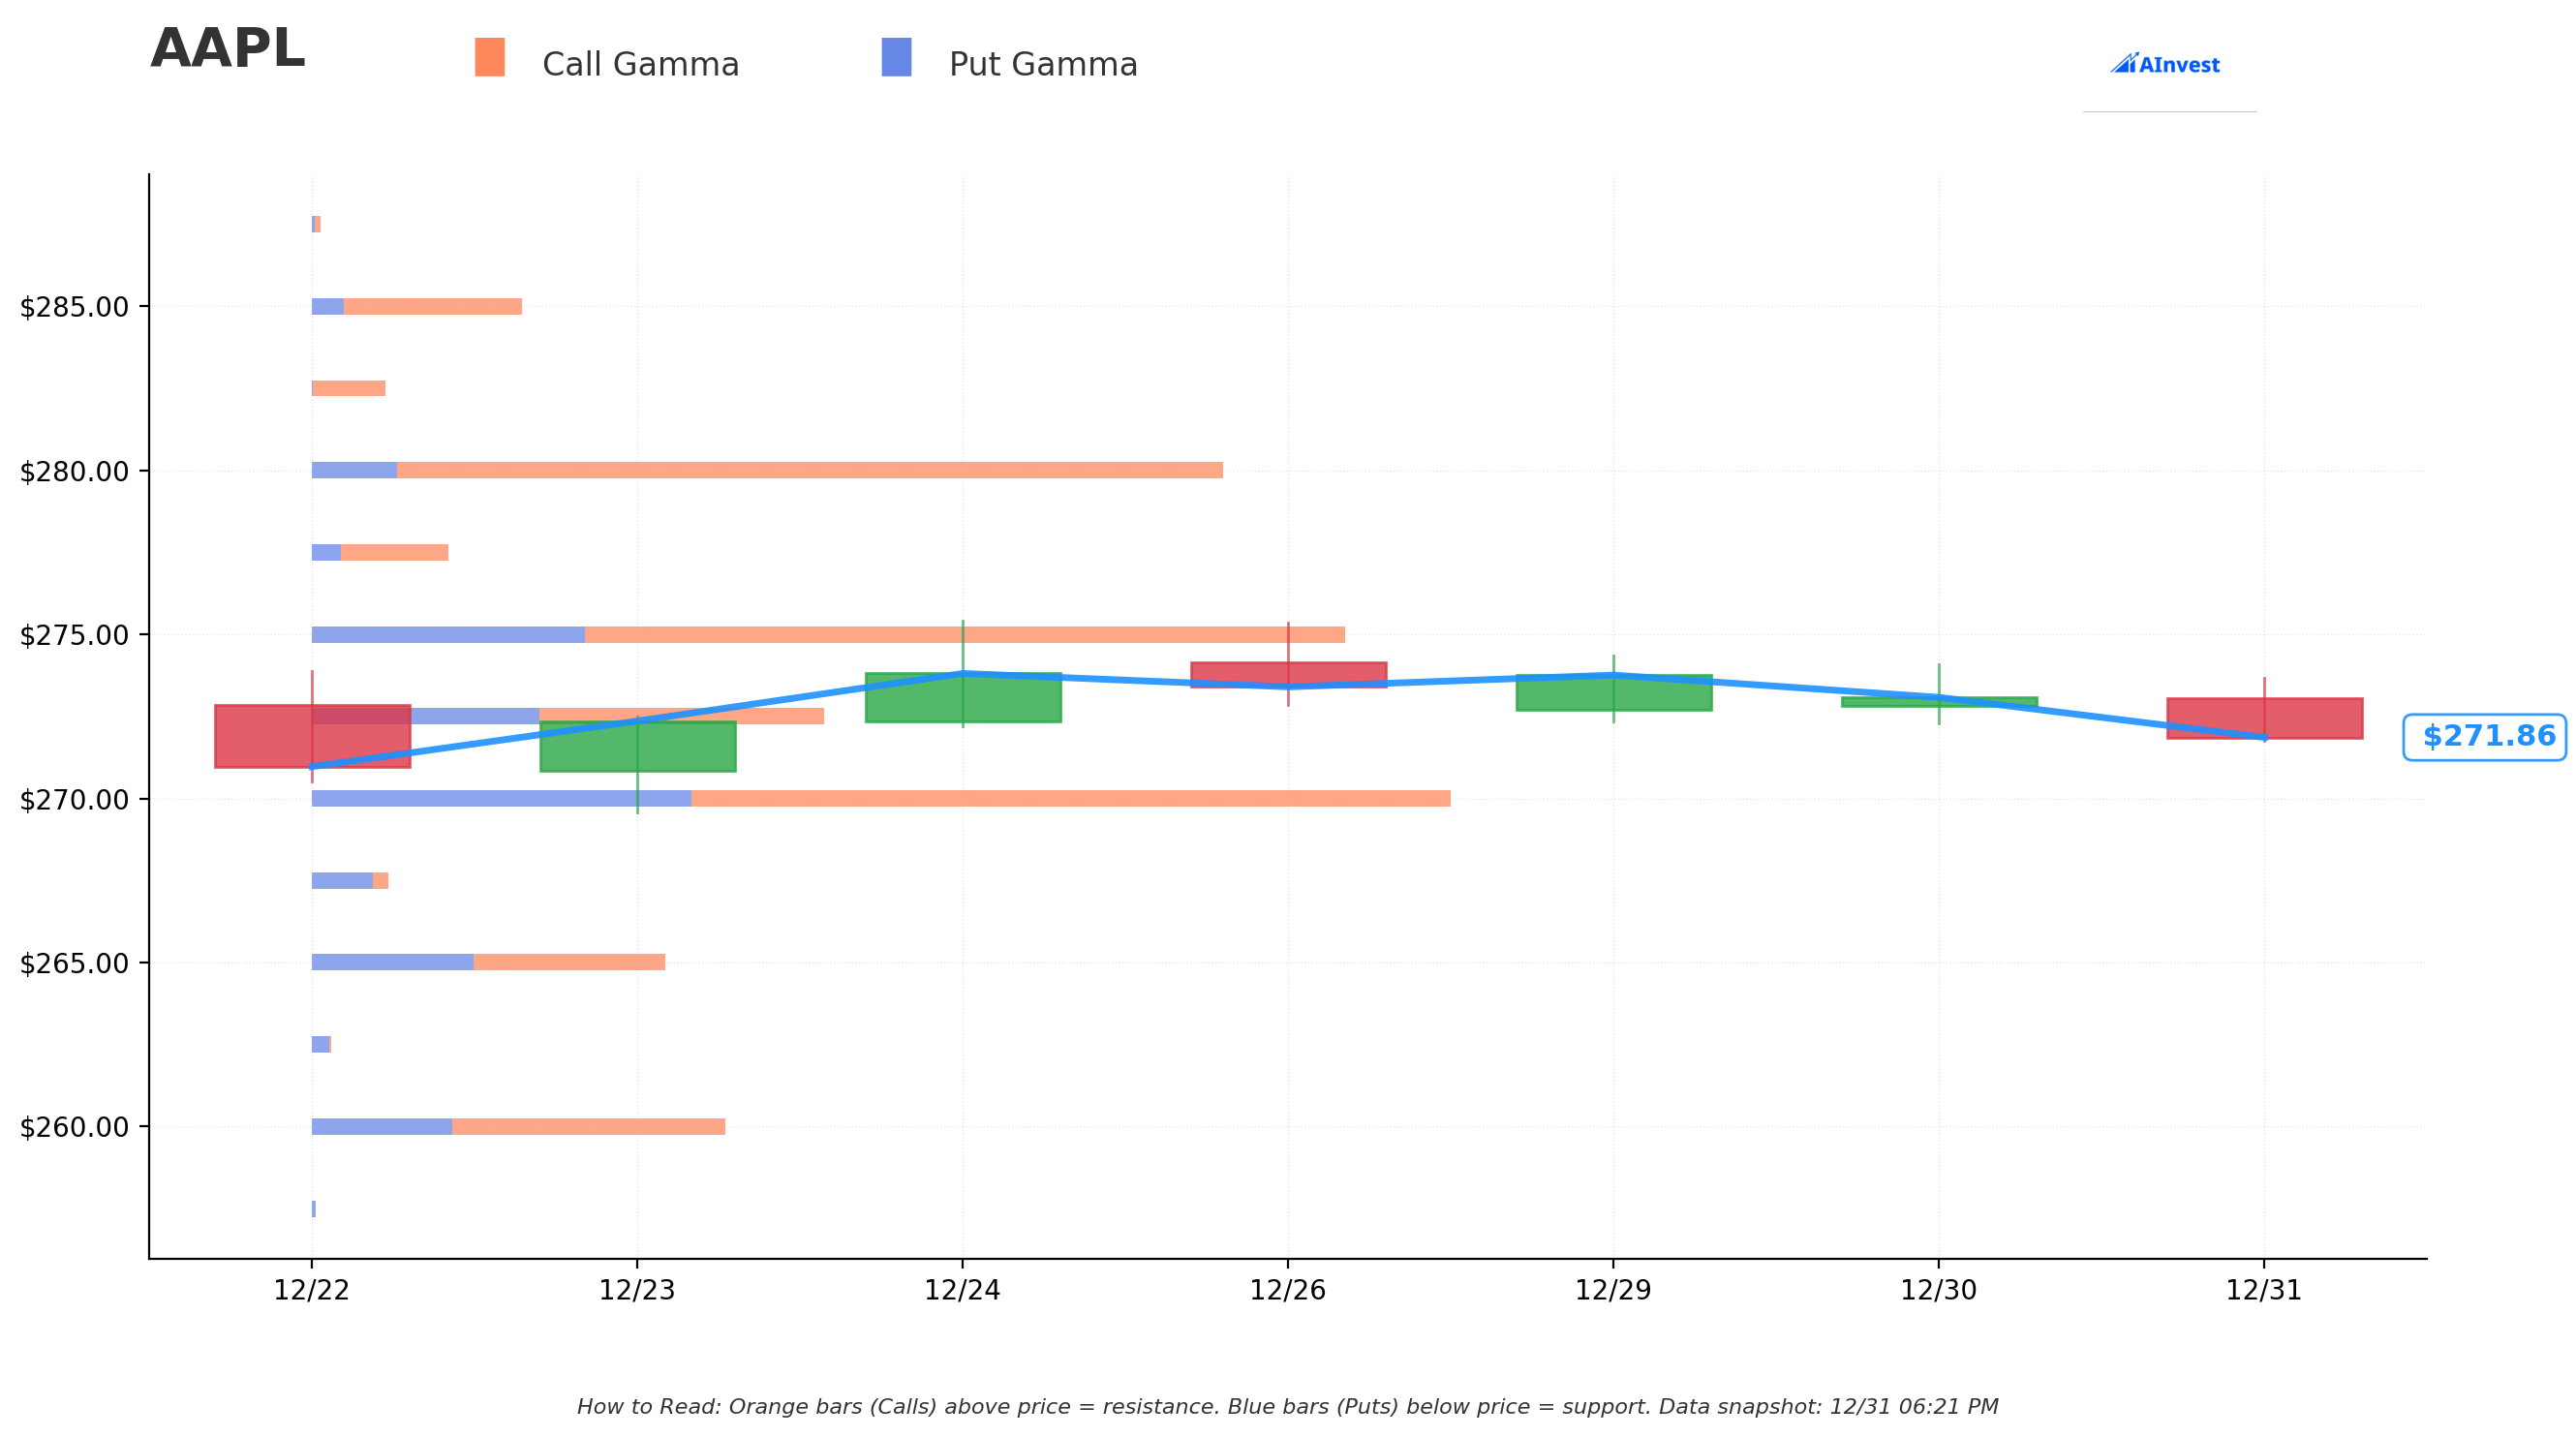
Current Price: $272.05 (snapshot time: December 31, 18:25 ET)
Immediate Resistance Zones:
- 🟠 $272.50 - Strongest nearby resistance (86.1M GEX, +0.17% away) - Heavy call gamma wall
- 🟠 $275.00 - Major resistance (173.2M GEX, +1.08% away) - Net gamma $81.1M bullish, but massive dealer hedging flows required
- 🟠 $280.00 - Critical level (153.4M GEX, +2.92% away) - Net gamma $124.7M, largest single resistance barrier
Immediate Support Zones:
- 🔵 $270.00 - Strongest support (191.6M GEX, -0.75% away) - Put gamma concentration creates natural floor
- 🔵 $265.00 - Secondary support (59.6M GEX, -2.59% away)
- 🔵 $260.00 - Major downside floor (69.8M GEX, -4.43% away)
Net GEX Bias: Bullish ($812.8M call GEX vs $326.2M put GEX = +2.5x ratio)
What This Means: The gamma exposure map reveals why AAPL is stuck in this tight $270-$275 band - there's a massive gamma squeeze zone here. The $270 support has 191.6M in total gamma exposure (strongest level), acting like a magnet pulling price down. Meanwhile, $272.50 and $275 create a ceiling with 259.3M combined GEX.
For AAPL to break out above $280, it would require sustained buying pressure to force dealers to delta-hedge approximately 153M in gamma exposure - that's significant work. Conversely, the $270 floor is well-defended by put gamma, which explains why today's $22M put purchase at $290 looks like excessive insurance - the options market structure itself provides natural support 2% below current price.
📊 Implied Move-Based Price Targets
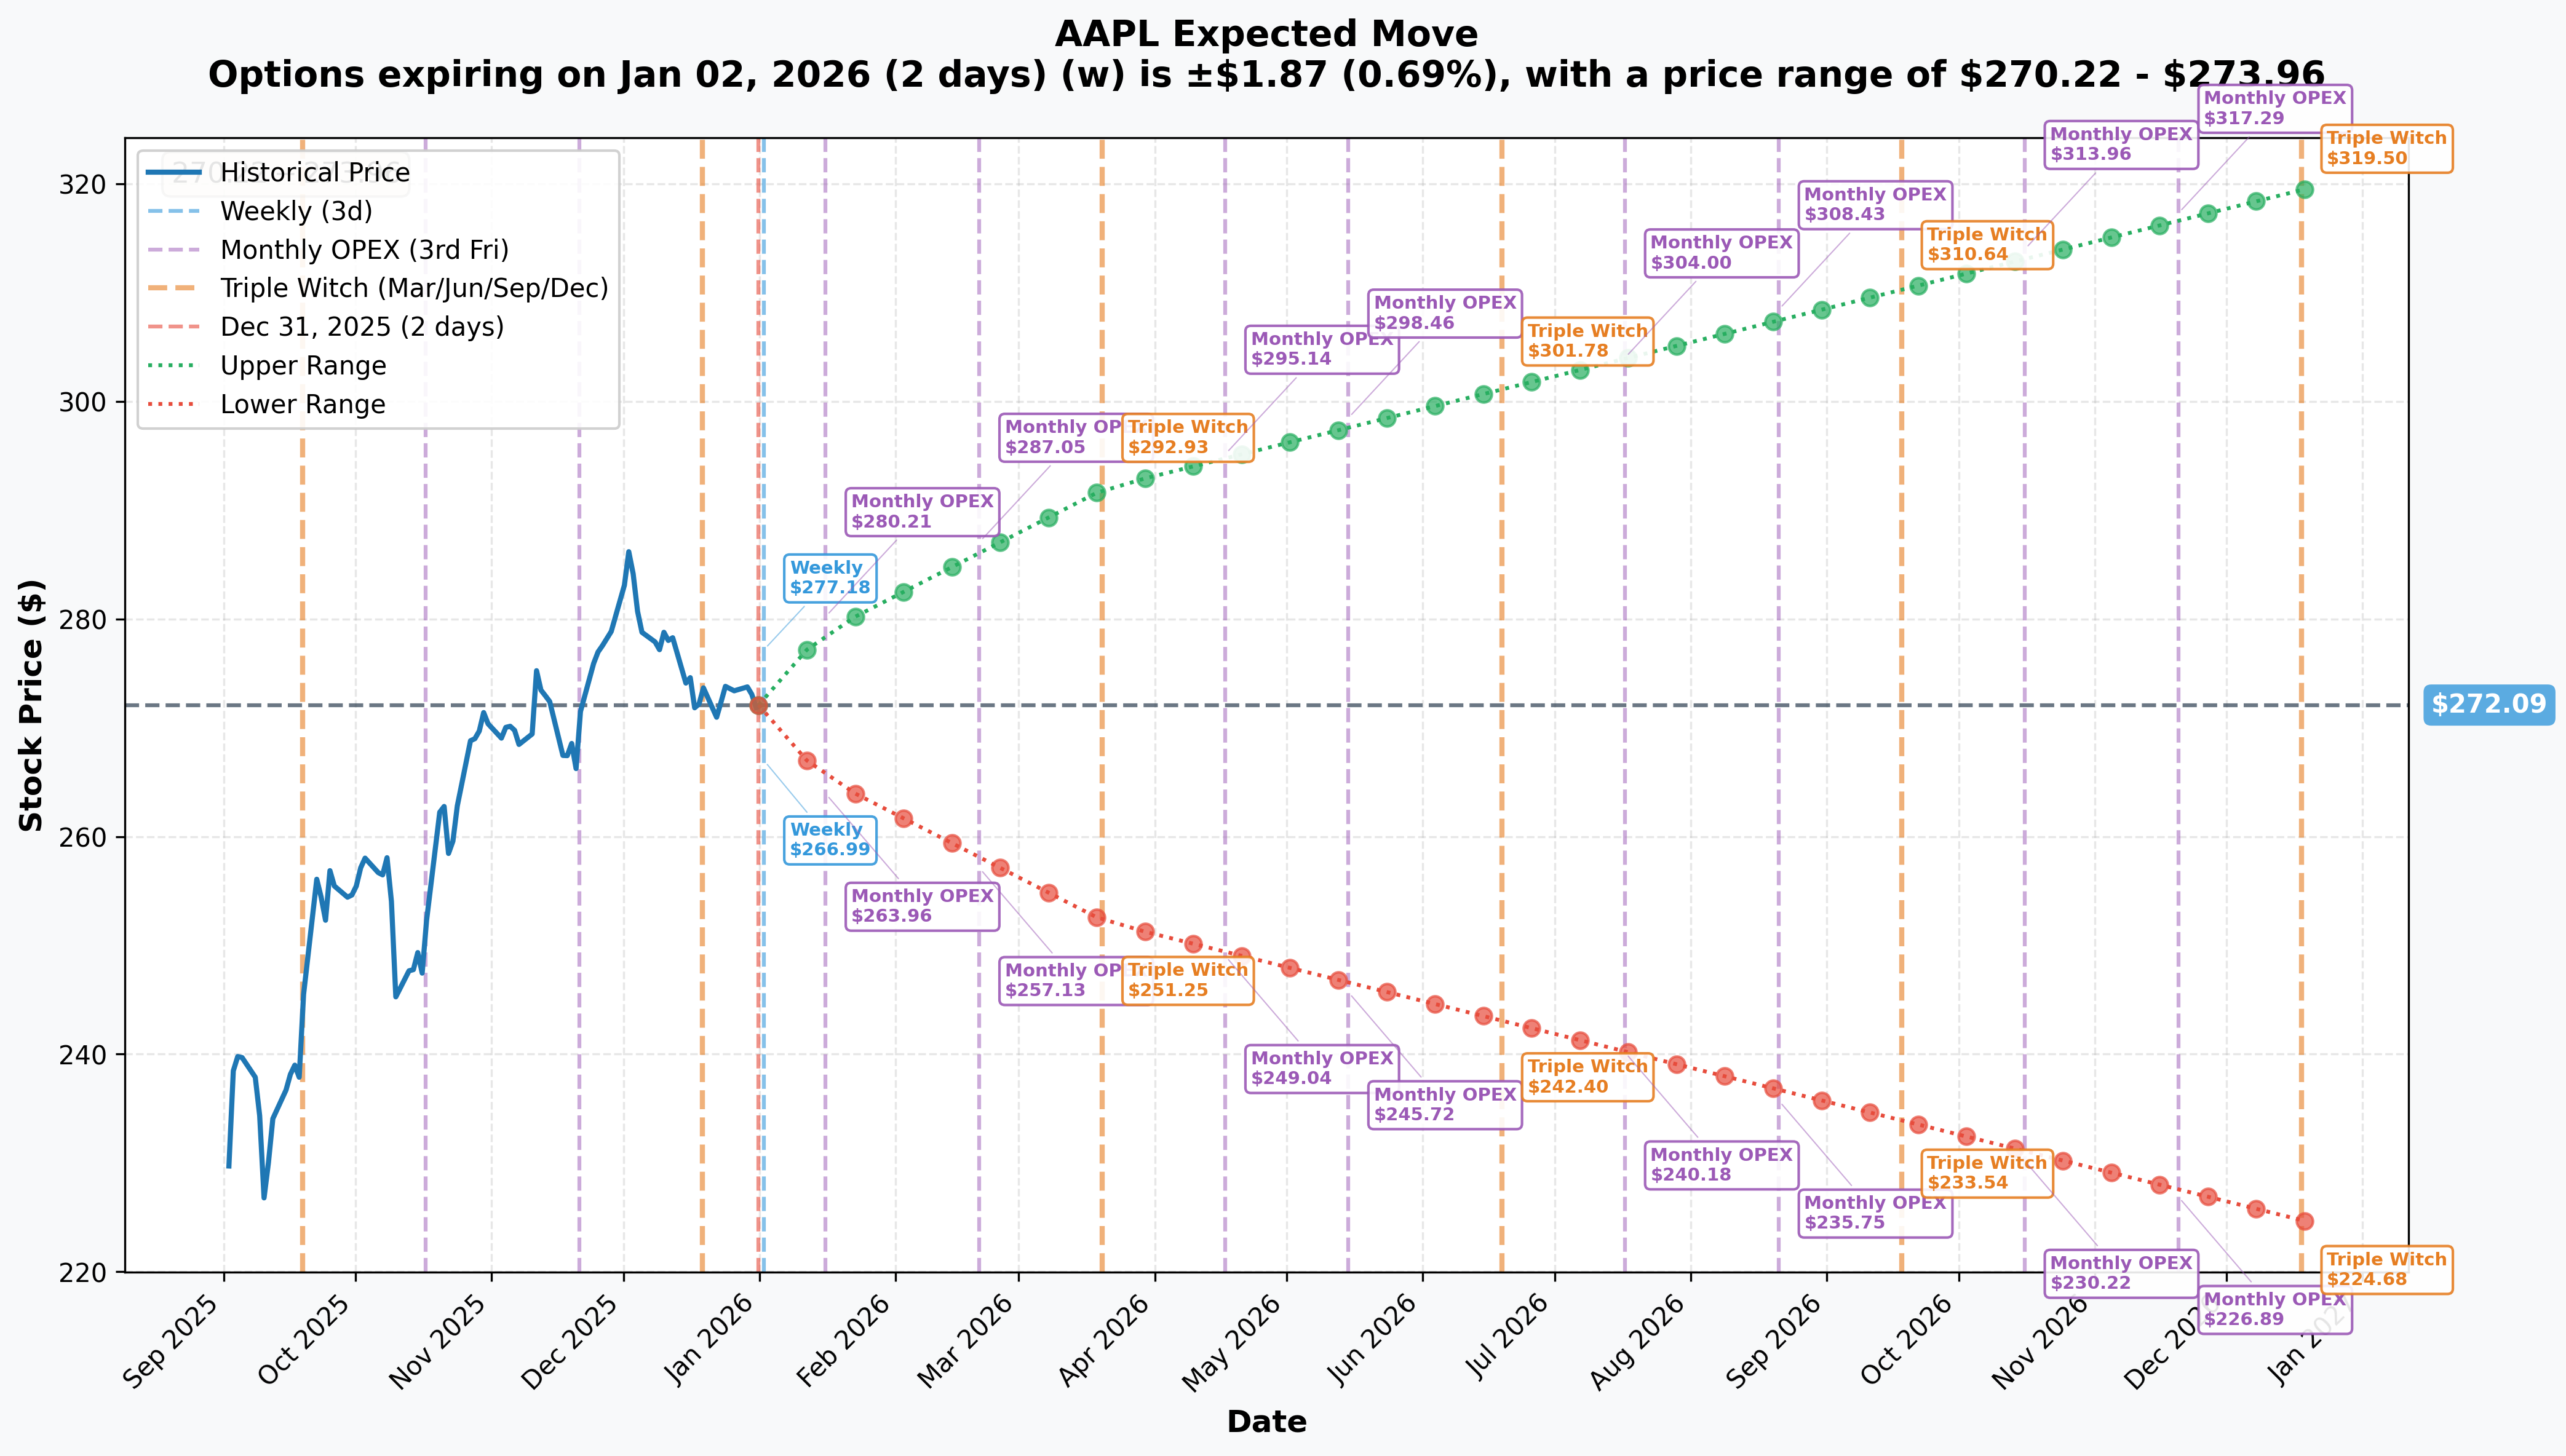
Current Price: $272.09 (as of December 31, 2025)
Options markets are pricing in the following expected ranges across different timeframes:
Weekly (Expiring 2026-01-02 - This Friday!):
- Implied Move: ±$1.87 (±0.69%)
- Expected Range: $270.22 - $273.96
- Reliability: High ✅
This confirms the Friday $290 put buyer paid $17.13 in pure time premium for protection $17.16 out of the money in a week where implied volatility only expects $1.87 of movement. That's either a very defensive hedge or they see specific event risk we don't.
Monthly OPEX (2026-01-16):
- Implied Move: ±$6.88 (±2.53%)
- Expected Range: $265.20 - $278.97
- Reliability: High ✅
The monthly expiration encompasses Q1 FY2026 earnings on January 29, but that's 13 days AFTER this expiration. The implied move of $6.88 suggests options traders expect some volatility from year-end positioning and potential early January macro events, but not massive swings.
Quarterly Triple Witch (2026-03-20):
- Implied Move: ±$19.93 (±7.33%)
- Expected Range: $252.16 - $292.02
- Reliability: High ✅
Q1 expiration covers the critical period including Q1 earnings, WWDC 2026 (June 8), and potential M5 MacBook Pro/Air launches expected in Q1 2026. The $292.02 upside target aligns with bullish analyst price targets (consensus $299.49).
Yearly LEAPs (2026-12-18):
- Implied Move: ±$47.41 (±17.42%)
- Expected Range: $224.68 - $319.50
- Reliability: High ✅
The annual range projects potential upside to $319.50, which is within striking distance of Wedbush's $350 bull case target (Dan Ives). This assumes iPhone 17 momentum continues, Services growth remains robust, and no major regulatory/tariff disruptions materialize.
🎪 Catalysts
🔜 Upcoming Catalysts
Q1 FY2026 Earnings - January 29, 2026
- Expected Revenue: $137-138B (+10-11% YoY)
- Expected EPS: $2.66 (+11% YoY)
- Company Guidance: 10-12% revenue growth with double-digit iPhone growth
- Key Focus: iPhone 17 sell-through, China performance sustainability, Services trajectory, tariff cost impact
This is Apple's biggest revenue quarter of the year, capturing holiday iPhone sales. Management guided 10-12% revenue growth on the October earnings call, with particular confidence in iPhone momentum. Consensus expects a beat based on strong China market share data (25% in October).
M5 MacBook Pro/Air Launch - Q1 2026 (Expected)
- 14-inch and 16-inch MacBook Pro with M5 Pro/Max chips
- M5 MacBook Air refresh
- M5 chip specs: +15% CPU, +30% GPU, 4x AI compute vs M4
The M5 chip was unveiled October 15, 2025 with significant performance gains. Three new MacBooks are slated for early 2026, which should drive Mac segment revenue (was $8.7B in Q4).
AI-Enhanced Siri Launch - 2026 (Delayed)
- Originally planned for March 2025, now pushed to sometime in 2026
- Leadership transition as AI chief John Giannandrea retires
- Critical for competitive positioning vs Google Gemini, ChatGPT
This delay is a notable negative catalyst. Apple "punted on AI this year" according to CNBC, creating potential market share risk if AI features become a major purchase driver in 2026.
WWDC 2026 - June 8, 2026
- iOS 27, macOS 27, watchOS 27 previews
- Expected hardware: M5 Mac mini, Mac Studio updates
- Possible smart speaker with display announcement
Annual developer conference typically includes software roadmaps and occasional hardware surprises. Following the "Liquid Glass" redesign in iOS 26, WWDC 2026 may focus more on stability and refinement.
Foldable iPhone - September 2026 (Speculative)
- Rumored book-style design, 7.6" open / 5.3" closed
- No visible crease (key differentiator vs Samsung)
- A20 chip on 2nm process
- Estimated price: ~$2,400
- Analyst projections: 8-10M units in 2026, up to 25M in 2027
Multiple reports confirm 2026 launch window, though supply constraints possible into 2027. This could be a major catalyst if executed without quality issues.
✅ Past Catalysts (Already Happened)
Q4 FY2025 Earnings Beat - October 30, 2025
- Revenue: $102.5B (+8% YoY) - Beat consensus
- EPS: $1.85 (+13% adjusted) - Beat consensus
- Net Income: $27.5B - Record quarter
- Full-Year Revenue: $416.2B - All-time record
- Services: $28.8B (+15% YoY) - Record quarter
Record-breaking results that exceeded Wall Street expectations and drove the stock to new highs. The September quarter is typically Apple's weakest, making this 8% revenue growth particularly impressive.
iPhone 17 Series Launch - September 9, 2025
- Four models: iPhone 17 ($799), iPhone 17 Pro ($1,099), iPhone 17 Pro Max ($1,199), iPhone Air ($999)
- New A19 chip, 48MP Dual Fusion camera, 6.3" ProMotion display
- Custom N1 networking chip with Wi-Fi 7
- Pre-orders September 12, shipping September 19
The iPhone 17 lineup drove exceptional demand, particularly in China where October sales surged +37% MoM to capture 25% market share - the highest since 2022.
China Sales Surge - October-November 2025
- 25% market share in October 2025 - Best month since 2022
- iPhone 17 achieved 69% penetration in premium segment
- +37% MoM sales growth in October
- First positive YoY growth since Q2 2023
This reversed years of declining China performance and positions AAPL well for the critical Q1 holiday quarter.
M5 Chip Announcement - October 15, 2025
- CPU: +15% multithreaded performance vs M4
- GPU: +30% overall, +45% ray tracing, 4x AI compute
- Neural Engine: Dedicated accelerator in each GPU core
- Memory bandwidth: 153.6 GB/s (+30% vs M4)
The M5 launched first in 14-inch MacBook Pro, iPad Pro, and refreshed Vision Pro. This sets the stage for the broader Mac lineup refresh in Q1 2026.
Analyst Price Target Increases - December 2025
- Wedbush (Dan Ives): $350 target - Highest on Street
- Citigroup: $330 target
- Evercore ISI: $325 target
- Morgan Stanley: $315 target
- Consensus: $299.49 (+9.5% upside from current levels)
Major Wall Street firms raised targets in December based on iPhone 17 China momentum and Services growth trajectory.
🎲 Price Targets & Probabilities
Based on gamma exposure levels, implied volatility data, and fundamental catalysts, here are realistic price targets across three scenarios:
🐂 Bull Case: $292-$300 (Q1 2026)
Probability: 30%
Catalyst-Driven Path:
- Q1 earnings (Jan 29) beats consensus with revenue above $140B
- iPhone 17 China momentum sustains through holiday quarter
- Services growth accelerates above 15% YoY
- M5 MacBook launches drive Mac segment resurgence
Technical Support:
- Quarterly implied move upside target: $292.02
- Gamma resistance at $290 breaks on strong volume
- Analyst consensus target: $299.49
- Wedbush bull case: $350 (extreme outlier)
Key Risk: Tariff costs escalate beyond $900M/quarter, forcing iPhone price increases that dampen demand.
⚖️ Base Case: $270-$280 (Q1 2026)
Probability: 50%
Scenario:
- Q1 earnings meet but don't exceed guidance (10-12% revenue growth)
- AAPL trades within gamma support/resistance band
- Regulatory overhang (DOJ antitrust, UK/EU App Store cases) caps upside
- Berkshire Hathaway selling continues to weigh on sentiment
Technical Support:
- Weekly implied range: $270.22 - $273.96
- Monthly implied range: $265.20 - $278.97
- Gamma support floor at $270 (191.6M GEX)
- Gamma resistance ceiling at $280 (153.4M GEX)
This is the "grinding higher" scenario where AAPL slowly appreciates on fundamental strength but faces periodic selling pressure from profit-taking and regulatory concerns.
🐻 Bear Case: $250-$265 (Q1 2026)
Probability: 20%
Trigger Events:
- Q1 earnings disappoint due to tariff margin compression
- China sales fade after October surge (Huawei competitive pressure)
- DOJ antitrust case accelerates with unfavorable ruling
- Broader market correction impacts tech valuations (33.6x forward P/E vulnerable)
Technical Support:
- Gamma support at $265 (59.6M GEX) and $260 (69.8M GEX)
- Quarterly implied move downside: $252.16
- Would represent ~8% pullback from current levels
What Would Have to Break: The option flow we're seeing today (massive put buying) suggests some smart money is hedging this exact scenario. For AAPL to fall to $250, we'd need multiple negative catalysts hitting simultaneously - earnings miss, regulatory bombshell, or macro shock.
💡 Trading Ideas
🛡️ Conservative: The "Sleep Well" Earnings Hedge
Setup: Bull Put Spread (Jan 16 expiration - after earnings)
- Sell $260 Put
- Buy $250 Put
- Net Credit: ~$2.50 per spread ($250 per contract)
- Max Risk: $750 per spread (if AAPL closes below $250)
- Max Profit: $250 per spread (if AAPL closes above $260)
- Breakeven: $257.50
Why This Works: You're betting AAPL stays above $260 (currently trading $272.84 = 4.7% cushion) through January 16 monthly OPEX. The gamma support at $260 (69.8M GEX) and $265 (59.6M GEX) provide structural floors. Even the quarterly implied move downside only goes to $252.16 - well below your short strike.
The collected premium ($250 per spread) represents a 33% return on capital at risk in 16 days if AAPL simply doesn't collapse. This captures the implied volatility premium without exposing you to unlimited risk.
Probability of Success: ~75-80% (AAPL would need to fall 5.4% to hit your breakeven)
Best For: Investors who are moderately bullish but want to earn income while protecting against moderate downside.
⚖️ Balanced: The "Gamma Scalper" Straddle
Setup: Short Iron Condor (Jan 16 expiration)
- Sell $280 Call / Buy $285 Call
- Sell $265 Put / Buy $260 Put
- Net Credit: ~$2.00 per IC ($200 per contract)
- Max Risk: $300 per contract
- Max Profit: $200 per contract
- Profit Range: $265 - $280
Why This Works: The monthly implied move is ±$6.88 ($265.20 - $278.97), which fits PERFECTLY inside your short strikes. You're exploiting the gamma pin at $270 support and $280 resistance. As long as AAPL stays in this 5.5% range over the next 16 days, you collect $200 per contract.
The beauty of this trade: both gamma exposure data AND implied volatility data suggest AAPL is stuck in this band. You're essentially selling insurance on a breakout that the market itself says is unlikely (only 2.53% implied move).
Probability of Success: ~65% (based on 1 standard deviation implied vol)
Best For: Experienced options traders who believe AAPL consolidates into earnings rather than making a big pre-announcement move.
🚀 Aggressive: The "China Momentum" Call Spread
Setup: Bull Call Spread (March 20 Triple Witch expiration)
- Buy $275 Call
- Sell $290 Call
- Net Debit: ~$5.50 per spread ($550 per contract)
- Max Risk: $550 per spread
- Max Profit: $950 per spread (at $290 or higher)
- Breakeven: $280.50
Why This Works: You're betting on the bull case: Q1 earnings beat (Jan 29), China momentum sustains, M5 product launches drive Mac revenue, and AAPL breaks through gamma resistance. Your upside target of $290 aligns with:
- Quarterly implied move upside: $292.02
- Gamma resistance at $290 (43.2M GEX)
- Within striking distance of analyst targets (~$300)
This trade gives you 73 days (expires March 20) to be right, capturing the full Q1 earnings catalyst, M5 MacBook launches, and any positive pre-WWDC buzz. The risk is defined at $550, but your profit potential is $950 (173% ROI) if AAPL rallies just 6.3% to $290.
Catalyst Timeline:
- January 29: Q1 earnings (expected beat)
- February-March: M5 MacBook Pro/Air launches
- March 20: Expiration captures 79-day move
Probability of Success: ~40-45% (requires breakout above $280.50)
Best For: Bullish traders who believe the iPhone 17 China surge (25% market share) translates to blockbuster Q1 results and multiple expansion. You're risking $550 to make $950 over 2.5 months - favorable risk/reward if you're conviction-weighted on the bull case.
Risk Management: Consider taking profits at 50% ($275 target hit) rather than holding for max gain. The gamma resistance at $280-$290 could create multiple opportunities to scale out.
⚠️ Risk Factors
Regulatory Headwinds Could Pressure Services Margins
The $108.6B Services business is Apple's crown jewel with estimated 70%+ gross margins, but it's under siege globally:
- DOJ Antitrust: Judge allowed case to proceed in June 2025, targeting 30% App Store fees
- EU DMA Fines: €500M fine in April 2025, commission rates reduced to 10-21% in regulated markets
- UK Appeal: Apple fighting £1.5B ($1.9B) overcharging ruling
- Brazil Settlement: Third-party app stores now required
- Japan Law: Smartphone Software Optimization Act effective December 18, 2025
If Apple loses the DOJ case or is forced to lower commissions globally, it could shave billions from Services revenue. At current valuation (33.6x forward P/E), any Services margin compression would hit the stock hard.
Tariff Exposure Is Real and Escalating
Q3 FY2025 tariff costs hit $900M, and with cumulative U.S. tariffs on Chinese goods now at 145%, there's potential for 10-30% iPhone price increases if Apple can't absorb costs. The company is accelerating India production (15-20% of iPhones by EOY 2025, 25% by 2027) and Vietnam manufacturing (20% of iPads/Watches, 65% of AirPods), but supply chain transitions take years.
If tariffs persist or escalate, Apple faces an impossible choice: raise prices (dampening demand) or absorb costs (crushing margins). Either outcome is negative for the stock.
AI Execution Risk - Siri Delays Are Embarrassing
Apple "punted on AI this year" with AI-enhanced Siri delayed from March 2025 to sometime in 2026, and AI chief John Giannandrea retiring mid-transition. Meanwhile, Google Gemini, ChatGPT, and Microsoft Copilot are racing ahead.
If AI becomes a major smartphone purchase driver in 2026 and Apple's implementation lags, it could stall the iPhone upgrade cycle. The counter-argument: Apple may view LLMs as commoditized utilities rather than differentiators, betting on hardware/ecosystem lock-in instead. Time will tell if this strategy works.
Valuation Premium Vulnerable in Rate-Sensitive Environment
At 33.6x forward P/E with only 11% expected EPS growth, AAPL is priced for perfection. Berkshire Hathaway sold 61.8M shares in 2025, reducing holdings from 300M to 238.2M shares - Warren Buffett clearly sees valuation risk.
If the Fed pivots hawkish or long-duration tech multiples compress, AAPL's premium valuation (highest among Mag 7 except TSLA/NVDA) makes it vulnerable to 10-15% corrections on no fundamental news.
China Momentum Could Fade Quickly
The 25% October market share was spectacular, but Huawei is surging with +37% YoY shipment growth, 16% market share, and government subsidies for devices under 6,000 yuan. Huawei's Kirin chips are domestic (no U.S. dependency), and geopolitical tensions could turn consumer sentiment against U.S. brands.
If China sales revert to the -8% YoY decline seen in Q1 2025, it would crater Q1 earnings expectations and force Street downgrades.
🎯 The Bottom Line
Here's the deal: Today's $40.3M put rollout is a masterclass in institutional risk management, not panic selling. Someone with deep pockets and sophisticated modeling believes AAPL needs downside protection into year-end, particularly with the Friday $290 put purchase representing pure insurance premium on a 0.69% implied weekly move. They're closing scattered positions and concentrating risk - classic de-risking behavior before a catalyst (likely positioning ahead of Q1 earnings Jan 29).
The Setup is Actually Bullish:
- iPhone 17 China momentum is real: 25% market share in October, best month since 2022
- Q4 earnings crushed expectations: $102.5B revenue, $27.5B profit (both records)
- Services at $108.6B annual run rate with 70%+ margins and 1B+ paid subscriptions
- Q1 guidance of 10-12% revenue growth with double-digit iPhone growth
- M5 product lineup launching Q1 2026
But Risks Are Not Trivial:
- Regulatory pressure globally (DOJ case proceeding, $1.9B UK liability)
- $900M quarterly tariff costs with risk of escalation
- AI/Siri execution delays creating competitive gap
- Valuation at 33.6x forward P/E leaves little room for disappointment
Action Plan:
📅 If you own AAPL: The gamma support at $270 (191.6M GEX) provides a natural floor. Consider holding through Q1 earnings (Jan 29) with a stop-loss at $267-268 if you're risk-averse. The implied move data suggests $265-279 range is base case through monthly OPEX.
📊 If you're watching: Mark your calendar for January 29, 2026 earnings. If AAPL guides Q2 revenue above $95B (consensus) and China commentary is positive, that's your entry signal. Wait for a pullback to the $270-275 gamma support zone.
🚫 If you're bearish: The put buying today validates downside hedging, but fighting a stock trading near all-time highs with record China momentum and Services tailwinds is tough. Better to wait for a confirmed breakdown below $270 support with increased volume before shorting.
The Unusual Options Activity Bottom Line: This isn't retail gambling - it's institutional hedging. The Z-scores (2.06 on the lead trade, 3.86 on the $280 put sale) indicate activity several standard deviations above normal, occurring only a few times per month or quarter. Someone with significant capital is repositioning ahead of year-end and potentially Q1 earnings volatility. That's not a reason to panic-sell your AAPL shares, but it IS a reason to respect risk management and consider defined-risk strategies like spreads rather than naked directional bets.
Final Thought: Apple enters 2026 with momentum, but the put buyers are reminding us that even the world's most valuable company isn't immune to macro shocks, regulatory pressure, or execution missteps. Trade accordingly.
Disclaimer: This analysis is for informational purposes only and does not constitute financial advice. Options trading involves substantial risk and is not suitable for all investors. Past performance does not guarantee future results. Always conduct your own due diligence and consult with a licensed financial advisor before making investment decisions.