ADBE $4M Bearish Put Position - Mega-Cap Software Under Q4 Earnings Pressure
December 10, 2025 | Unusual Activity Detected
The Quick Take
Someone just dropped $4 MILLION on deep downside protection in Adobe at 11:15:34 this morning! This institutional player bought 1,350 contracts of $320 strike puts expiring September 2026 - securing protection 7% below current levels just HOURS before Adobe's critical Q4 FY2025 earnings report after market close today. With ADBE down 28% YTD at $343.96 amid AI monetization concerns and the failed Figma acquisition, smart money is locking in downside insurance at a crucial inflection point. Translation: Major holders are buying protection before the earnings verdict on Adobe's AI strategy!
Company Overview
Adobe Inc. (ADBE) is a global software giant dominating creative content creation and digital marketing platforms:
- Market Cap: $144.1 Billion
- Sector: Software & Services (Prepackaged Software)
- Current Price: $343.96
- Primary Business: Creative Cloud (Photoshop, Illustrator, Premiere), Experience Cloud (marketing automation), Document Cloud (Acrobat), and AI-powered tools via Firefly
The Option Flow Breakdown
The Tape (December 10, 2025 @ 11:15:34):
| Time | Symbol | Side | Buy/Sell | Type | Expiration | Premium | Strike | Volume | OI | Size | Spot | Option Price |
|---|---|---|---|---|---|---|---|---|---|---|---|---|
| 11:15:34 | ADBE | ASK | BUY | PUT $320 | 2026-09-18 | $4M | $320 | 1,400 | 806 | 1,350 | $343.96 | $29.90 |
What This Actually Means
This is a defensive hedge on a substantial Adobe position positioned for potential downside over the next 9 months! Here's the breakdown:
- Massive premium paid: $4M ($29.90 per contract × 1,350 contracts)
- Protection strike: $320 provides 7% downside cushion below current price
- Strategic timing: 282 days to expiration captures TODAY's Q4 FY2025 earnings, Q1 FY2026 earnings (March 2026), Semrush acquisition close (H1 2026), MI350 competitive launches, and full FY2026 guidance trajectory
- Size matters: 1,350 contracts represents 135,000 shares worth ~$46.4M
- Institutional insurance: This is sophisticated portfolio hedging ahead of a binary earnings catalyst
What's really happening here: This trader likely holds a SIGNIFICANT long position in Adobe stock or calls accumulated during better times (perhaps $400-500 range). Now, with ADBE down 28% YTD and trading at $343.96 just HOURS before the most critical earnings report of the year, they're paying $29.90 per share for September 2026 $320 puts as insurance. If ADBE drops below $320 by September 2026, these puts pay off dollar-for-dollar. Think of it like buying a $4M insurance policy when you're worried about a major accident.
Unusual Score: EXTREME (Z-Score: 24.6, classified as "EXTREMELY_UNUSUAL") - This is 24.6 standard deviations above normal Adobe option activity! The 1.74 volume-to-OI ratio signals HIGH_ACTIVITY with strong conviction. Zero similar trades in recent history makes this a standalone bet with medium confidence classification.
Technical Setup / Chart Analysis
YTD Performance Chart
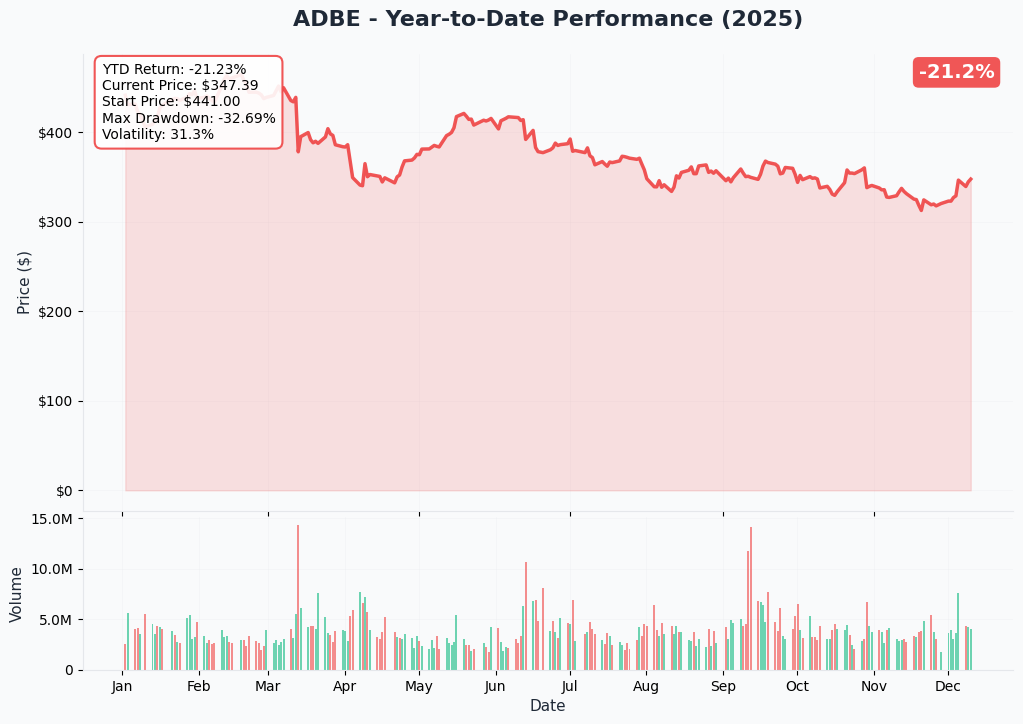
Adobe is suffering through a brutal year - down 28.1% YTD with current price of $343.96 (started 2025 at ~$471). The chart tells a painful AI disruption and competitive pressure story - after hitting 52-week highs of $552.83, ADBE collapsed to lows of $311.59 in the selloff.
Key observations:
- Massive decline: Down from $550+ highs to current $344 levels (38% peak-to-trough drawdown)
- Failed breakout: Multiple attempts to reclaim $400 level have failed throughout 2025
- Negative momentum: Stock trending lower despite broader tech market strength (+10.7% Dow YTD)
- Support tested: Currently trading just 10% above 52-week lows of $311.59
- Volume concern: Selling pressure persisted despite earnings beats earlier in year
Gamma-Based Support & Resistance Analysis
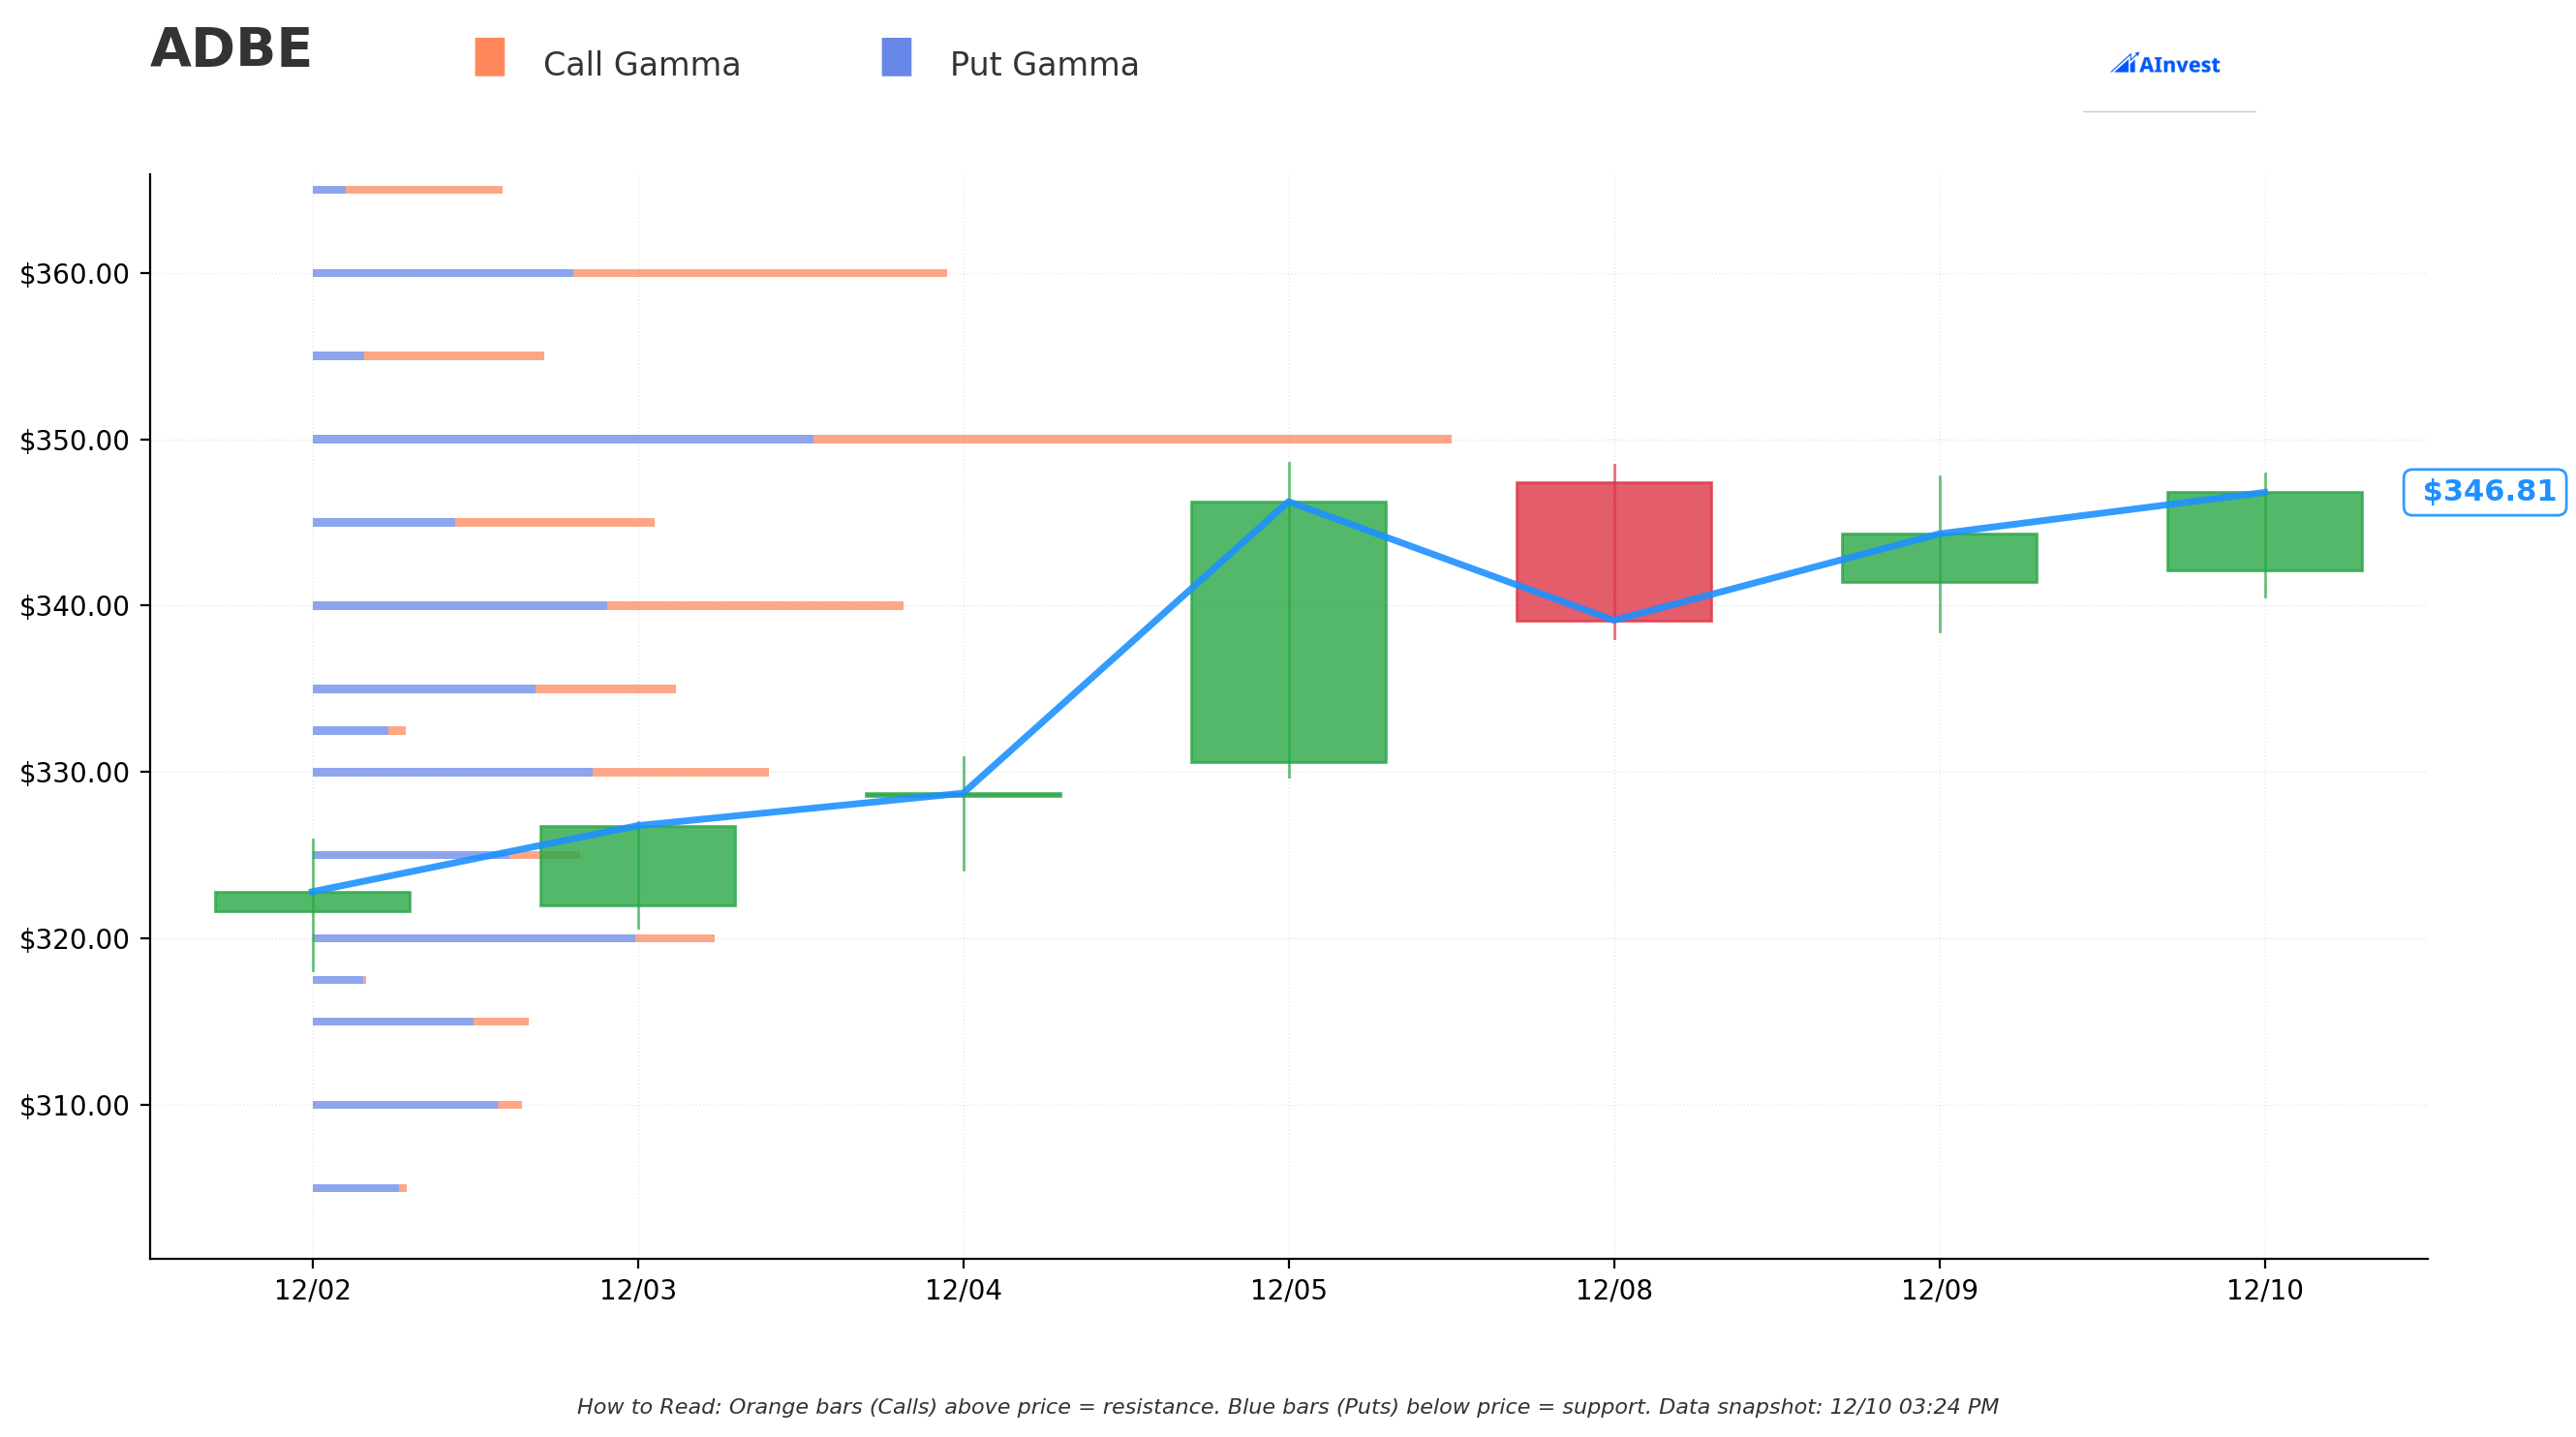
Current Price: $346.69
The gamma exposure map reveals critical price magnets and barriers that will govern near-term price action after today's earnings:
Support Levels (Put Gamma Below Price):
- $345 - Immediate support with 2.48B total gamma exposure (strongest nearby floor, just 0.5% below current!)
- $340 - Secondary support at 4.30B gamma (dealers will buy dips aggressively here)
- $335 - Tertiary support zone with 2.63B gamma
- $330 - Major structural floor with 3.31B gamma
- $320 - Deep support at 2.92B gamma (exactly where this put trade is struck! Not coincidental)
- $300 - Disaster floor at 3.04B gamma (13.5% below current levels)
Resistance Levels (Call Gamma Above Price):
- $350 - STRONGEST RESISTANCE with 8.26B gamma exposure (massive ceiling just 1% overhead!)
- $360 - Secondary resistance at 4.61B gamma (dealers will sell into rallies)
- $370 - Extended ceiling zone with 2.61B gamma
- $400 - Major psychological and technical resistance at 5.05B gamma (15.4% rally required)
What this means for traders: ADBE is trading in an extremely tight range with massive $350 resistance (8.26B - the single largest gamma level) creating natural selling pressure just 1% above current price. The setup screams "capped upside" unless earnings deliver a blowout surprise. Meanwhile, $345 support at 2.48B provides immediate floor, but break below could accelerate toward $340 and then $320.
Notice anything? The put buyer struck EXACTLY at $320 where there's 2.92B gamma support and elevated put open interest. They're positioning for a scenario where Adobe breaks below the $330-340 support cluster and finds a floor around $320. Smart defensive positioning.
Net GEX Bias: Bullish (38.66B call gamma vs 33.03B put gamma) - Overall dealer positioning leans slightly bullish, but the massive $350 resistance creates immediate upside constraint.
Implied Move Analysis
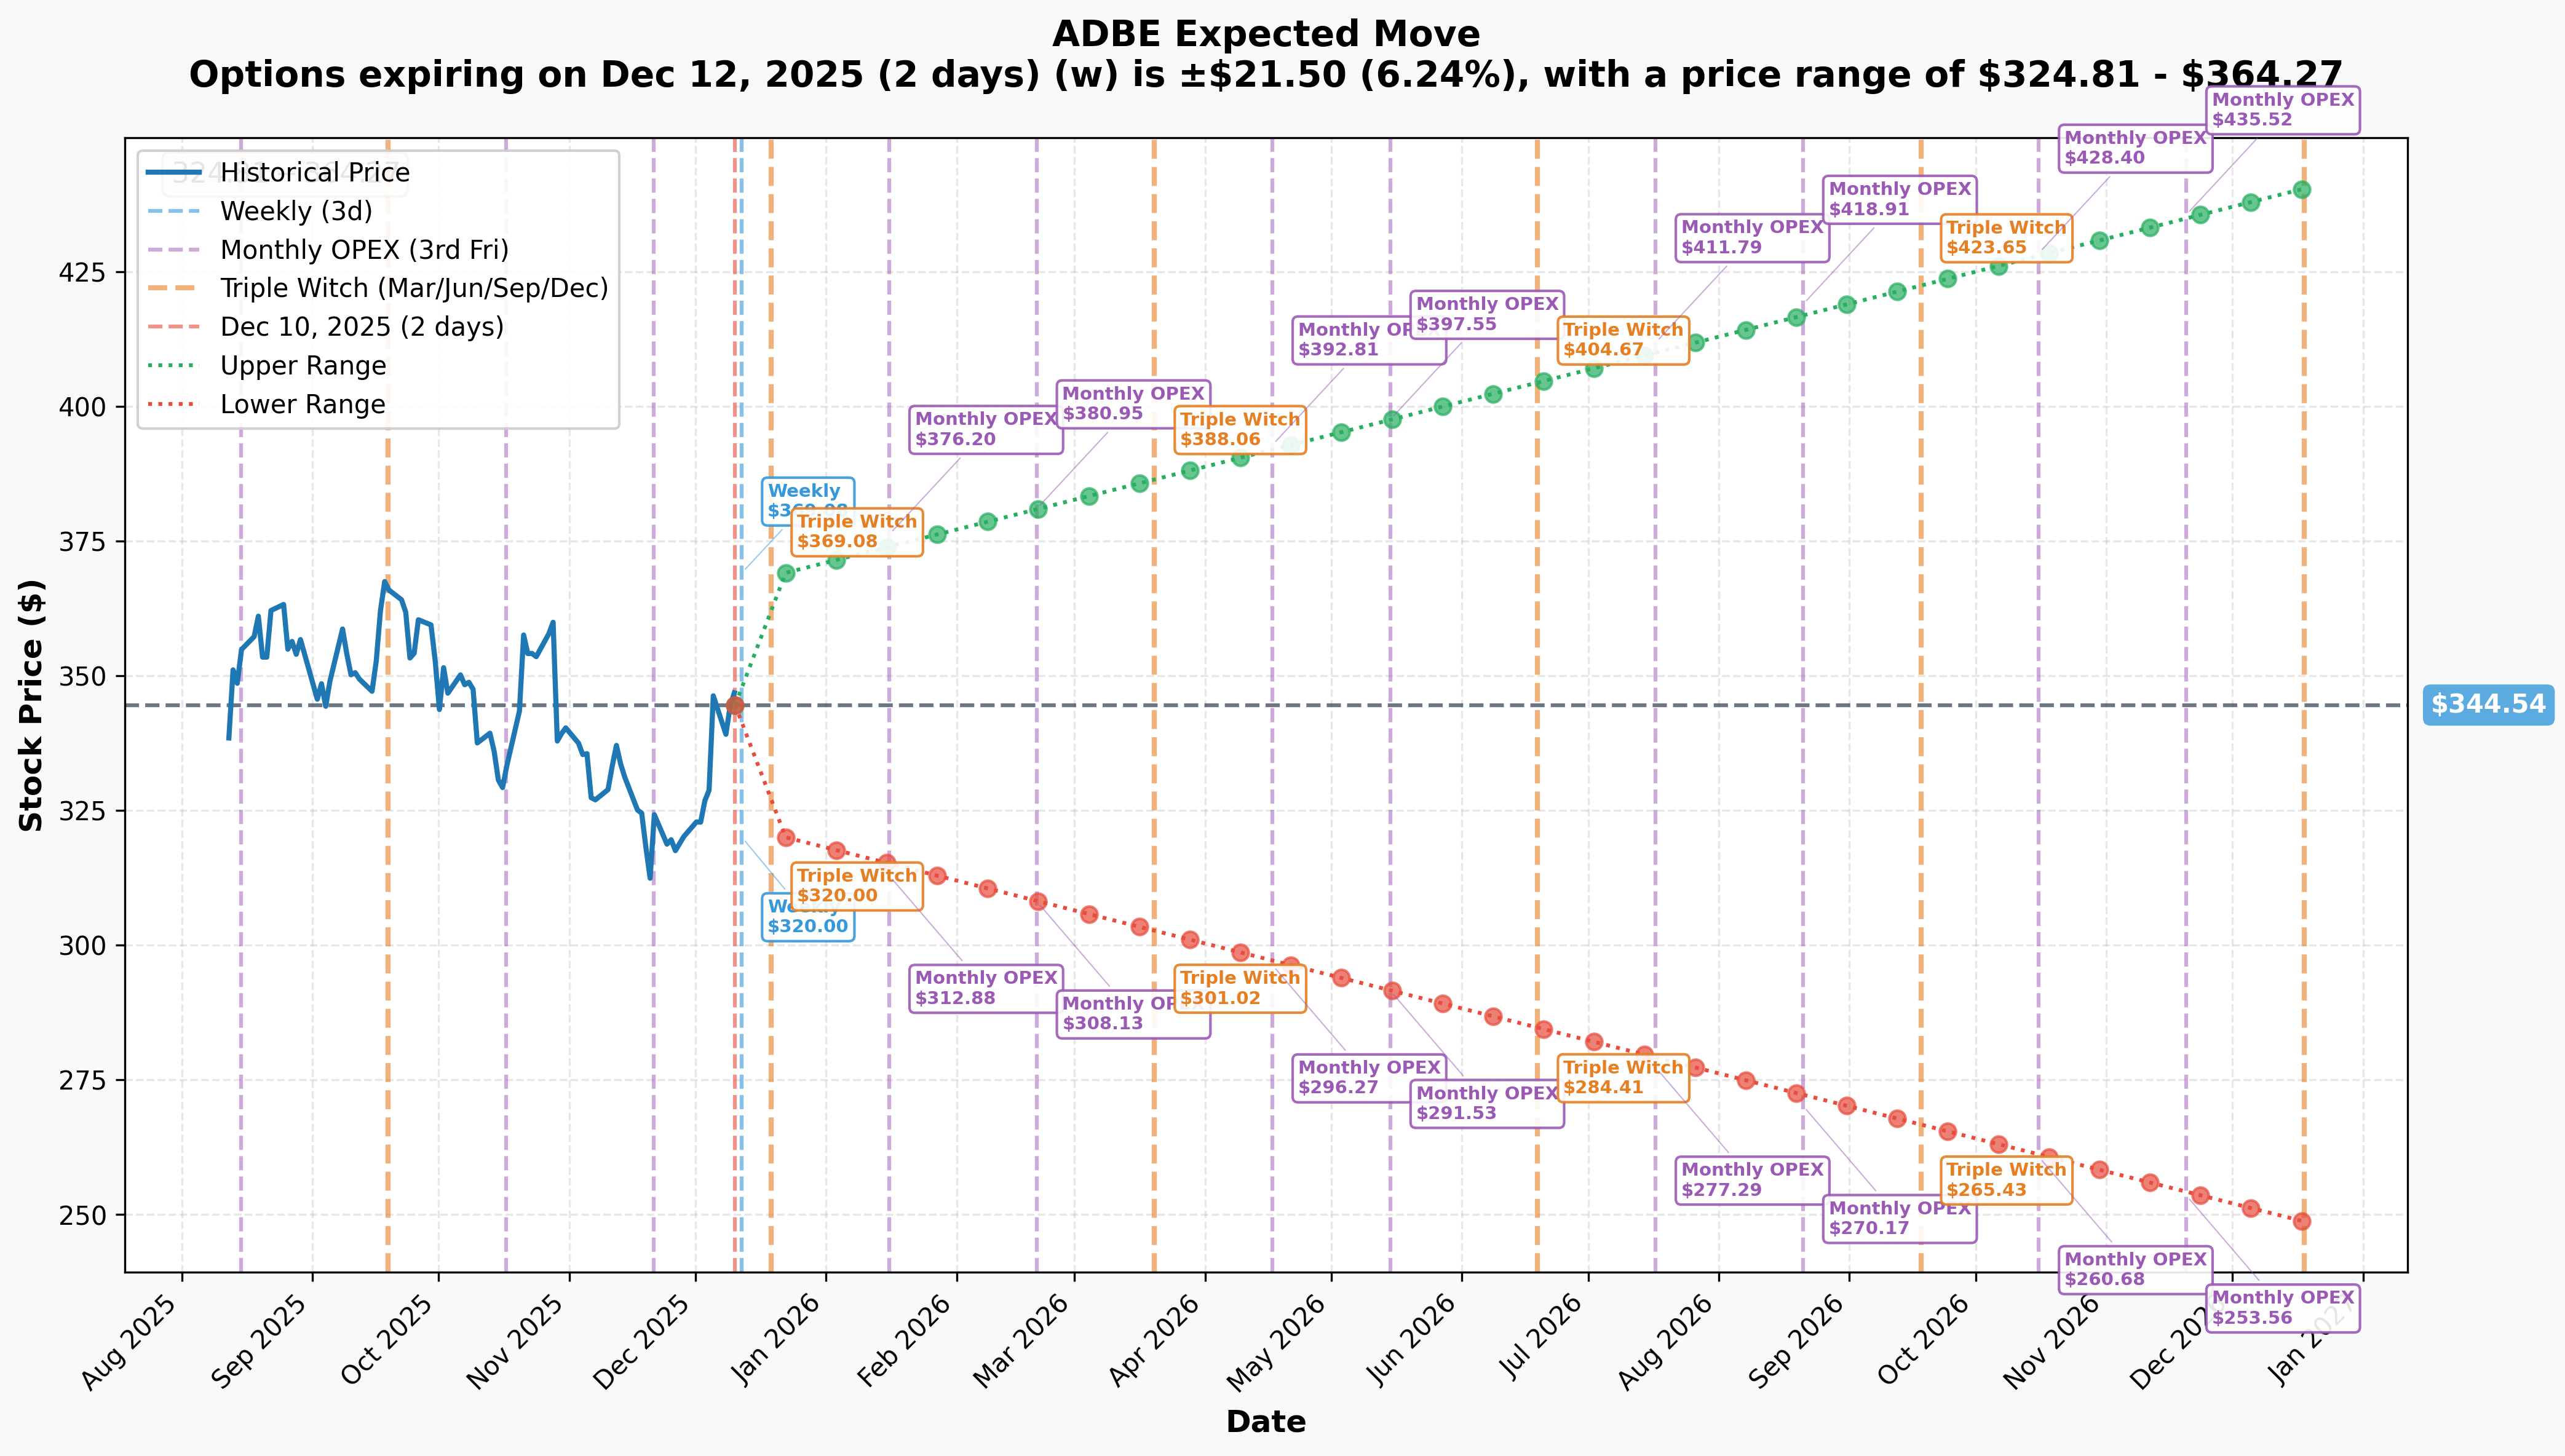
Options market pricing for upcoming expirations:
- Weekly (Dec 12 - 2 days): ±$21.50 (±6.24%) → Range: $324.81 - $364.27
- Monthly OPEX (Dec 19 - 9 days): ±$23.95 (±6.95%) → Range: $320.59 - $368.49
- Quarterly Triple Witch (Dec 19 - 9 days): ±$23.95 (±6.95%) → Range: $320.59 - $368.49
- Yearly LEAPS (Dec 18, 2026 - 373 days): ±$90.59 (±26.29%) → Range: $248.62 - $440.46
Translation for regular folks: Options traders are pricing in a 6.2% move ($21.50) by Friday for the weekly expiration that includes TODAY's earnings - that's a huge expected swing for a $144B mega-cap stock! The market expects FIREWORKS around this earnings report. The monthly implied move of 7% suggests continued volatility through December OPEX.
The yearly LEAPS pricing is particularly telling: the lower range of $248.62 suggests the market thinks there's a real possibility Adobe could trade down another 28% over the next year if AI monetization disappoints or competitive pressures intensify. This aligns with the put buyer's defensive thesis.
Key insight: The sharp 6.2% weekly implied move reflects massive earnings uncertainty. Smart money is paying up for protection into this binary event - volatility is expensive for good reason.
Catalysts
Immediate Catalyst (TODAY!)
Q4 FY2025 Earnings - December 10, 2025 (AFTER MARKET CLOSE TODAY!)
Adobe reports fourth-quarter fiscal 2025 results TODAY after market close. This is THE catalyst that will determine whether the 28% YTD decline represents a buying opportunity or the beginning of structural headwinds. Wall Street consensus and key expectations:
- Revenue: $6.11B consensus (up ~9% YoY) vs $5.61B in Q4 FY2024
- EPS: $5.39-5.40 non-GAAP consensus vs $4.81 in Q4 FY2024
- AI Revenue Contribution: Target of $250M+ for full FY2025, with analysts watching Firefly monetization velocity
- Digital Media ARR: Critical metric - need strong net new ARR growth to validate subscription health
- Document Cloud: Continued 15%+ growth expected following 17% growth in Q4 FY2024
- FY2026 Guidance: Most important part - market needs 10%+ ARR growth guidance to justify current valuation
Market Expectations: Polymarket odds price 91% probability Adobe beats EPS estimates, but guidance will be the determining factor for stock reaction.
Upside surprise potential: If Adobe delivers blowout AI revenue numbers (Firefly exceeding targets), strong Creative Cloud subscriber additions, and aggressive FY2026 guidance confirming 10%+ ARR growth, stock could break through $350 resistance toward $370-380.
Downside risk factors: Any disappointment in ARR growth trajectory, conservative FY2026 guidance, or soft commentary around Firefly monetization could trigger sharp selloff given the stock's already-battered condition. Historical pattern shows Adobe has dropped 10-15% on guidance disappointments even after beating quarterly estimates - December 2024's 14% single-session plunge is fresh in investors' minds.
Near-Term Catalysts (Q1-Q2 2026)
Semrush Acquisition Closing - H1 2026
Adobe announced acquisition of Semrush Holdings for $1.9 billion in all-cash transaction on November 19, 2025, expected to close in first half of 2026:
- Strategic Rationale: Integration with Adobe Experience Cloud to strengthen digital marketing and SEO capabilities, competing against Salesforce and HubSpot
- Revenue Impact: Semrush projected $600M ARR with 50% YoY growth - potential $100-200M incremental ARR from cross-selling to Adobe's enterprise base
- Regulatory Risk: 60-70% probability of successful clearance given non-overlapping product lines, but post-Figma scrutiny may create delays
- Integration Execution: Success requires seamless combination with GenStudio and Experience Platform
Why this matters for the put trade: If regulatory approval delays extend beyond H1 2026 or integration challenges emerge, it could validate concerns about Adobe's M&A execution post-Figma disaster. The September 2026 put expiration captures this integration period perfectly.
Q1 FY2026 Earnings - Expected March 11-13, 2026
Based on Adobe's historical pattern, Q1 FY2026 earnings will likely be reported in mid-March 2026:
- Key Metrics: First read on FY2026 ARR growth trajectory, Semrush integration progress updates
- Critical Question: Will management confirm 10%+ ARR growth guidance for full FY2026?
- Firefly Adoption: Need to see continued 45%+ engagement among Creative Cloud subscribers
- Competitive Dynamics: Commentary on Canva competitive pressure and market share trends
Adobe Summit 2026 - Expected March 2026
Adobe's flagship Digital Experience Conference will showcase:
- AI Platform Enhancements: Deeper integration of AI agents across Experience Cloud
- GenStudio Roadmap: Enterprise AI content generation at scale
- Partnership Announcements: Expected expansions with AWS, Microsoft, Google Cloud
- Customer Testimonials: Critical validation of Experience Cloud value proposition
Product & Competitive Catalysts
Creative Cloud AI Monetization Scaling (Q1-Q2 2026)
- AI Credits Model Expansion: Firefly usage-based pricing rolling out to broader subscriber base beyond current penetration
- Creative Cloud Pro Tier: Potential premium subscription tier with enhanced AI capabilities
- Target: AI-linked ARR exceeding $5 billion (management confirmed surpassed as of Q3 FY2025)
- Adoption KPI: Maintaining 45%+ Firefly engagement among 37 million Creative Cloud subscribers
Firefly Video Model Enhancements - H1 2026
- Next-generation text-to-video and video extension capabilities
- Integration with models from Runway, Luma AI, and Google Veo
- Competitive response to OpenAI's Sora and other video generation tools
- Critical for defending Adobe's video editing franchise (Premiere Pro, After Effects)
Canva Competitive Threat - Ongoing
Canva's $3.1B ARR growing at mid-40% YoY rates poses existential threat:
- Risk: Canva moving upmarket into Adobe's professional territory
- Adobe's Response: Adobe Express targeting Canva's SMB stronghold with uncertain success
- Market Fragmentation: User base fragmenting with casual creators choosing Canva's freemium model
- Share Loss Risk: Any acceleration in Adobe's subscriber churn to Canva would be catastrophic
Risk Factors
Don't get caught by these potential landmines:
-
Earnings binary event TODAY: Results after close create MASSIVE volatility risk. Stock could gap 6-8% either direction based on revenue quality, ARR growth, and most importantly FY2026 guidance. The 6.2% implied move is substantial but Adobe has shown ability to move 10-15% on guidance misses - December 2024's 14% plunge on disappointing FY2025 guidance is the template bears fear will repeat.
-
Valuation offers no cushion at 21.55x P/E: While not as stretched as high-growth peers, Adobe trades at premium multiples requiring flawless execution. Stock down 28% YTD despite broader tech strength shows market has lost patience with the AI monetization story. At current $144B market cap, every dollar of incremental AI revenue is being heavily scrutinized.
-
FTC Subscription Practices Lawsuit overhang: U.S. Department of Justice civil enforcement action alleges hiding early termination fees (50% of remaining payments) and creating complex cancellation processes. While ETF revenue represents less than 0.5% of total revenue, potential settlement requiring practice changes could impact margins and subscriber retention dynamics.
-
Figma acquisition fallout continues to haunt: Failed $20B acquisition cost $1B breakup fee and estimated $38B+ in lost market cap and competitive disadvantage. Figma emerged stronger with dilution-free cash, acquired Dynaboard, and now poses bigger competitive threat. Adobe XD placed in "maintenance mode" leaves no credible competitor in collaborative design space.
-
AI monetization velocity skepticism: Despite 16 billion Firefly creations and 45% subscriber penetration, investors remain skeptical whether this translates to meaningful incremental revenue at scale. The market needs concrete evidence that Firefly economics justify current valuation against backdrop of free/low-cost AI alternatives (ChatGPT, DALL-E, Stable Diffusion) commoditizing creative tasks.
-
Canva's enterprise expansion existential threat: Canva's $3.1B ARR growing at mid-40% YoY while successfully moving upmarket threatens Adobe's prosumer and SMB segments. Adobe Express response has shown limited traction. Risk is that Canva's freemium model and ease-of-use philosophy wins the next generation of creators while Adobe's "complexity as moat" strategy fails in era valuing accessibility.
-
Software complexity becoming liability: Adobe's traditional strength (professional-grade precision) may be structural weakness as market values speed and accessibility over high-end features. AI-native tools designed for simplicity could fragment Adobe's user base: high-end artists → Midjourney, developers → Stable Diffusion, casual users → Canva.
-
Semrush acquisition execution risk: $1.9B deal closing H1 2026 creates integration risk, regulatory uncertainty (60-70% approval odds), and potential distraction from organic growth initiatives. Adobe's M&A track record post-Figma is questioned by Street.
-
Economic sensitivity in enterprise software: Recession scenario would pressure both SMB Creative Cloud subscriptions and enterprise Experience Cloud spending. Marketing technology budgets typically cut first in downturns. Adobe's subscription revenue provides stability but not immunity.
Price Targets & Probabilities
Using gamma levels, implied move data, and catalyst analysis through September 2026 expiration:
Bull Case (30% probability)
Target: $400-$450
How we get there:
- Earnings CRUSH: Q4 revenue toward $6.2B+ high-end, Digital Media ARR exceeds $600M, gross margins expand
- FY2026 Guidance: Management confidently guides 10%+ ARR growth with $250M+ AI revenue target exceeded
- Firefly Monetization: Concrete metrics showing AI credits model generating $50-100M+ quarterly incremental revenue
- Semrush Integration: Deal closes smoothly in Q1 2026, early cross-sell wins announced
- Competitive Defense: Evidence that Adobe Express is slowing Canva's market share gains
- Summit Success: March 2026 Adobe Summit reveals major enterprise AI wins and strengthened competitive positioning
- Technical Breakout: Stock breaks above $350 resistance (8.26B gamma), then $370, momentum carries to $400+
Key metrics needed:
- Digital Media ARR growth >12% YoY
- Creative Cloud net subscriber additions accelerating
- Document Cloud sustaining 15%+ growth
- AI revenue visibility toward $1B+ annual run-rate by end of FY2026
Probability assessment: 30% because it requires strong execution across multiple fronts with stock already damaged by 28% YTD decline. Market needs proof that Firefly monetization is real and durable. Gamma resistance at $350 creates technical headwind.
Base Case (50% probability)
Target: $320-$370 range (CHOPPY CONSOLIDATION)
Most likely scenario:
- Solid but unspectacular earnings: Revenue meets ~$6.1B consensus, EPS slightly beats at $5.45-5.50
- In-line guidance: FY2026 ARR growth guided toward 8-10%, in-line with expectations but not inspiring
- AI revenue progressing: Firefly showing steady adoption but not enough to expand valuation multiple from current levels
- Competitive pressures persist: Canva continues growing but Adobe maintains core creative professional franchise
- Semrush closes: Deal gets regulatory approval with minor delays, integration proceeds without major issues
- Trading range-bound: Stock oscillates between $320 support and $370 resistance for months, waiting for proof points
- Volatility normalizes: Post-earnings IV crush from current elevated levels to 30-35% range
This is the put buyer's insurance scenario: Stock consolidates in a range with occasional dips toward $320 put strike during periods of uncertainty (Semrush delays, weak data points, macro volatility). Puts provide valuable protection during these drawdowns even if stock ultimately recovers. The $4M premium is the cost of sleeping well during a turbulent 9-month period.
Why 50% probability: Stock at crossroads - neither clearly recovering nor collapsing. Fundamentals remain solid (dominant market position, strong cash flow, AI integration) but growth trajectory and competitive dynamics uncertain. Most institutional players will hold and monitor quarterly progress.
Bear Case (20% probability)
Target: $260-$320 (TEST THE PUT STRIKE!)
What could go wrong:
- Earnings disappointment: Revenue/EPS miss or weak guidance triggers -10-15% gap down tomorrow
- FY2026 guidance cautious: Management guides below 8% ARR growth citing competitive pressures and macro uncertainty
- AI monetization stalls: Firefly engagement metrics flatten or decline, raising questions about long-term monetization
- Subscriber churn accelerates: Creative Cloud net additions disappoint as Canva captures casual creators
- Semrush deal problems: Regulatory delays extend beyond H1 2026 or deal terms renegotiated/terminated
- Competitive losses: Major enterprise accounts switching to Salesforce or other Experience Cloud alternatives
- FTC lawsuit settlement: Terms require margin-dilutive subscription practice changes
- Economic downturn: Recession pressures SMB and enterprise software spending
- Technical breakdown: Break below $340 support accelerates selling toward $320, potential cascade to $300
Critical support levels:
- $340: Secondary support (4.30B gamma) - break here signals trouble
- $330: Major floor (3.31B gamma) - MUST HOLD or momentum shifts decisively bearish
- $320: Deep support (2.92B gamma) + this put strike - likely strong buying zone
- $300: Disaster floor (3.04B gamma) - crisis scenario
Probability assessment: 20% because it requires multiple negative catalysts compounding. Adobe's competitive moat in professional creative tools remains intact, $8B+ operating cash flow provides financial strength, and 42% creative software market share won't evaporate overnight. However, execution risk is real and market has shown willingness to punish software stocks trading at premium valuations.
Put P&L in Bear Case:
- Stock at $280 on Sept 18, 2026: Puts worth $40.00, profit = $10.10/share × 1,350 = $1.36M gain (34% ROI)
- Stock at $260 on Sept 18, 2026: Puts worth $60.00, profit = $30.10/share × 1,350 = $4.06M gain (101% ROI!)
- Stock at $320 on Sept 18, 2026: Puts worth $0 (at-the-money), loss = -$29.90/share × 1,350 = -$4.04M (essentially 100% loss)
Trading Ideas
Conservative: Wait for Post-Earnings Clarity
Play: Stay on sidelines until after TODAY's earnings volatility settles and direction becomes clear
Why this works:
- Binary risk TODAY: Earnings after close creates ±6.2% expected move - too dangerous to enter before results
- Implied volatility expensive: Options priced with elevated IV that will crush post-earnings
- Technical uncertainty: Stock at critical juncture between $345 support and $350 resistance
- Prove-it mode: After 28% YTD decline, market needs concrete evidence of AI monetization and ARR reacceleration
- Better entry likely: Post-earnings consolidation could provide $320-330 entry with 6-8% margin of safety
- Let professionals take risk: The $4M institutional put shows smart money is worried - why fight the setup?
Action plan:
- Watch TODAY's earnings closely: Revenue quality ($6.1B+ target), Digital Media ARR (need $600M+), FY2026 guidance (10%+ ARR growth critical)
- Monitor stock reaction tomorrow: Gap up above $360 = bull case playing out; gap down below $335 = bear case validating
- Look for consolidation entry: Pullback to $320-330 over next 2-4 weeks provides attractive risk/reward for stock position
- Track competitive dynamics: Any commentary about Canva, Figma, or market share trends in earnings call
- Revisit Q1 2026: March earnings will provide next major catalyst with updated FY2026 trajectory
Risk level: Minimal (cash position) | Skill level: Beginner-friendly
Expected outcome: Avoid potential 8-12% earnings gap risk in either direction. Maintain optionality to enter at better levels with reduced uncertainty.
Balanced: Post-Earnings Put Diagonal Spread (Time Arbitrage)
Play: After earnings, construct diagonal put spread taking advantage of volatility curve
Structure:
- Buy March 2026 $340 puts (longer-dated, ~100 days)
- Sell January 2026 $330 puts (shorter-dated, ~37 days)
Why this works:
- IV crush benefit: After earnings, longer-dated options retain more value than near-term options
- Defined risk structure: Maximum loss capped at net debit paid (around $6-8 per spread post-earnings)
- Gamma support alignment: Positioned around $330-340 support cluster where institutions are defending
- Time decay advantage: Short January puts decay faster, can roll forward monthly while holding March protection
- Flexibility: If stock drops toward $330, can close short puts at profit and hold long puts for continued downside
- Lower capital requirement: Diagonal costs less than outright put purchase while maintaining directional exposure
Estimated P&L (post-earnings IV environment):
- Net debit: ~$6-8 per spread (buy $340 put for ~$18-20, sell $330 put for ~$12-14)
- Max profit scenario: Stock trades $320-330 at January expiration - short puts expire worthless, long puts worth $10-20
- Max loss: Net debit paid (~$6-8) if stock above $340 at March expiration
- Management strategy: Roll short puts monthly to collect additional premium while maintaining downside exposure
Entry timing:
- Wait 2-3 days post-earnings for full IV collapse (by Dec 12-13)
- Only enter if stock trading $345+ to give room to work
- Skip if stock already below $335 (too close to short strike)
Position sizing: Risk only 3-5% of portfolio (directional speculation on continued Adobe weakness)
Risk level: Moderate (defined risk diagonal) | Skill level: Intermediate (requires understanding of calendar/diagonal mechanics)
Aggressive: Bearish Put Ratio Spread (ADVANCED - High Risk/Reward)
Play: Bearish structure betting on move toward $320 support over next 3-6 months
Structure:
- Buy 10 June 2026 $340 puts (~190 days)
- Sell 20 June 2026 $310 puts (same expiration)
Why this could work:
- Net credit or small debit: Structure may be entered for small credit or minimal cost due to ratio (2:1)
- Profit zone targeting: Maximum profit occurs if stock settles near $310 at June expiration
- Probability enhancement: Selling twice as many puts enhances probability of profit in range $310-$340
- Volatility play: Benefits from decline toward $320-330 support levels over time
- Catalyst timing: Captures Q1 FY2026 earnings (March), Semrush close timeline, Adobe Summit reactions
Why this could blow up (SERIOUS RISKS):
- NAKED SHORT PUTS: Below $310, exposure becomes unlimited (short 10 extra puts naked)
- Disaster scenario: If Adobe collapses to $250-280 (bear case extreme), losses multiply exponentially
- Margin requirements: Broker will require substantial margin/buying power for naked short puts
- Undefined risk: Below $310 breakeven, every dollar drop costs $1,000 per ratio spread
- Assignment risk: Short puts could be assigned early if stock drops significantly, creating margin calls
- Volatility expansion: Major selloff would spike IV, increasing short put values dramatically
Estimated P&L:
- Entry cost: Small credit to $2-3 debit (selling 20 vs buying 10 offsets cost)
- Maximum profit: ~$30 per spread ($3,000 total) if stock at $310 at June expiration
- Breakeven points: Upper ~$337-340, Lower ~$280 (exact depends on entry prices)
- Loss zones: Stock above $340 loses incrementally, stock below $280 loses exponentially
- Danger zone: Below $300, ratio spread creates massive losses ($1,000+ per dollar of decline)
CRITICAL WARNING - DO NOT attempt unless you:
- Have significant options trading experience with ratio spreads
- Can afford substantial losses if Adobe collapses below $300
- Have margin account with excess buying power for naked short puts
- Understand that losses can exceed initial capital by multiples
- Can monitor position daily and adjust/close proactively if stock approaches $310
- Accept that "small credit" entry can turn into 5-10x account-sized loss in disaster
Management strategy:
- Set mental stop-loss if stock drops below $325 (close entire position to limit exposure)
- Consider closing short puts and holding long puts if stock reaches $320-315 (reduces naked exposure)
- Don't hold to expiration - take profits if stock in $310-320 zone with 30-45 days remaining
Risk level: EXTREME (unlimited loss potential below $310) | Skill level: Expert only (margin, ratio spread, naked options experience required)
Probability of profit: ~60% (wide profit range $280-$340), but magnitude of max loss in tail scenario is catastrophic
The Bottom Line
Real talk: Someone just spent $4 MILLION protecting a major Adobe position just HOURS before the most consequential earnings report of the year. This isn't a "sell everything" panic signal - it's sophisticated risk management by institutions who understand that at 21.5x P/E after a 28% YTD decline, Adobe is at a critical inflection point where execution matters more than ever.
What this trade tells us:
- Volatility expected through September 2026: The 282-day duration captures multiple binary catalysts (Q4 earnings TODAY, Q1 earnings March, Semrush close, full FY2026 trajectory)
- Downside protection priority: Willing to pay $29.90/share for $320 puts (8.7% of stock price) suggests genuine concern about 7%+ downside scenario
- Earnings uncertainty: Timing just hours before results shows acute awareness this report will determine narrative for next 6-9 months
- Support level targeting: $320 strike positioned just below $330 major gamma support - expects that IF stock breaks support cluster, it finds floor around $320
- Long-term holder protecting gains: 9-month duration suggests this is core position holder protecting against extended weakness, not short-term trader
This is NOT a bearish call on Adobe's franchise - it's a "protect what you have before the verdict" signal.
If you own Adobe:
- Consider partial profit-taking: If sitting on gains from higher levels, taking 20-30% off at $344 locks in some return before earnings risk
- Set mental stops: If holding through earnings, commit to exit plan if stock breaks below $335 support (signals bear case validating)
- Don't fight the tape: Down 28% YTD underperforming tech sector by 38%+ for a reason - market skeptical of AI monetization story until proven
- Watch FY2026 guidance: This is THE most important part of today's earnings - needs 10%+ ARR growth commitment to stabilize sentiment
- Consider protective puts: If holding substantial position, buying 1-2 March 2026 $340 puts per 100 shares provides downside insurance through next earnings cycle
If you're watching from sidelines:
- Today's earnings = moment of truth: DO NOT enter before results - binary risk too high with 6.2% implied move
- Pullback to $320-330 = opportunity: Post-earnings consolidation to support levels would provide attractive entry with 6-8% margin of safety from current
- Validation needed: Look for concrete evidence of Firefly monetization (not just usage metrics), ARR reacceleration, and competitive defense
- Summit catalyst: March 2026 Adobe Summit will provide important read on enterprise AI adoption and Experience Cloud momentum
- FY2026 trajectory: Adobe needs to prove the AI story is real with revenue and margins to match - show-me mode after disappointing FY2025 guidance last year
If you're bearish:
- Earnings volatility = opportunity: Post-earnings IV crush creates better entry points for put spreads and diagonal structures
- Key support levels: Watch $340 (4.30B gamma), then $330 (3.31B gamma) - breaks signal momentum shift
- Ratio spreads require expertise: Only advanced traders should consider naked put exposure strategies
- Time horizon matters: This $4M put position has 9 months - don't try to time exact bottom
- Respect the franchise: Adobe still dominates professional creative tools with 42% market share and $8B+ annual cash flow - this isn't a collapsing company
Mark your calendar - Key dates:
- December 10 (TODAY) after market close - Q4 FY2025 earnings report (THE BIG ONE!)
- December 11 (Tomorrow) - Post-earnings price action and analyst reactions
- December 19 - Monthly/Quarterly OPEX (implied move window closes)
- March 11-13, 2026 - Q1 FY2026 earnings report (next major catalyst)
- March 2026 - Adobe Summit (Digital Experience Conference)
- H1 2026 - Semrush acquisition expected close
- September 18, 2026 - Put expiration date for this $4M trade
Final verdict: Adobe's long-term franchise in professional creative tools remains strong - 37 million Creative Cloud subscribers, 16 billion Firefly creations, 42% creative software market share, and $8B operating cash flow don't disappear overnight. BUT, at current valuation after 28% YTD decline with earnings TODAY, the risk/reward is UNCERTAIN until we see FY2026 guidance and concrete AI monetization proof points. The $4M institutional put buy is a CLEAR signal: manage risk, protect capital, and wait for execution proof before committing new capital aggressively.
Be patient. Let TODAY's earnings provide clarity. The creative software market will still be here tomorrow, and you'll make better decisions with information than gambling on binary events.
This is chess, not poker. Capital preservation over speculation.
Disclaimer: Options trading involves substantial risk of loss and is not suitable for all investors. This analysis is for educational purposes only and not financial advice. Past performance doesn't guarantee future results. The "EXTREMELY_UNUSUAL" classification with Z-Score of 24.6 reflects this trade's statistical rarity - it does not imply the trade will be profitable or that you should follow it. Earnings create binary event risk with potential for 6-12% gaps in either direction. The put buyer may have complex portfolio hedging needs not applicable to retail traders. Always do your own research and consider consulting a licensed financial advisor before trading.
About Adobe Inc.: Adobe specializes in content creation, document management, and digital marketing and advertising software and services, operating through Digital Media, Digital Experience, and Publishing segments with a market capitalization of $144.1 billion in the Software & Services sector.