Date: January 14, 2026 | Ticker: AIG | Current Price: $72.93
Trade Summary
| Time | Symbol | Buy/Sell | Call/Put | Expiration | Premium | Strike | Volume | OI | Size | Spot Price | Option Price | Option Symbol |
|---|---|---|---|---|---|---|---|---|---|---|---|---|
| 09:53:28 | AIG | SELL | PUT | 2027-01-15 | $4.8M | $77.5 | 5,000 | 3,700 | 5,000 | $72.95 | $9.70 | AIG20270115P77.5 |
Quick Take
A large institutional player just closed out a $4.8 million short put position on AIG, pocketing profits after the stock dropped roughly 14% from its 52-week high. The timing is interesting: CEO Peter Zaffino is stepping down, Q4 earnings drop February 17, and the stock is sitting right at key gamma support. This looks like a smart exit ahead of potential volatility rather than a fresh directional bet.
Company Overview
American International Group (AIG) is one of the world's largest insurance companies, offering property-casualty insurance, life insurance, and retirement solutions. After a massive turnaround under CEO Peter Zaffino since 2021, AIG has delivered five consecutive years of underwriting profitability and returned over $19 billion to shareholders.
| Metric | Value |
|---|---|
| Market Cap | ~$46.2 billion |
| 52-Week High | $88.07 |
| 52-Week Low | $69.24 |
| YTD Performance (2025) | +19.71% |
| Recent 1-Month | -11% |
| Dividend Yield | ~2.5% |
| Analyst Consensus | Hold (Avg PT: $88.53) |
Real talk: AIG has come a long way from its 2008 bailout days. The company is now a lean, profitable machine with an 86.8% combined ratio (lower is better in insurance). But the stock has pulled back hard lately, and there's a leadership change brewing.
Option Flow Breakdown
The Trade That Caught Our Eye
This trade represents a Sell to Close (STC) order - someone who previously sold these puts (betting AIG wouldn't crash below $77.50) just bought them back to close the position.
Key Metrics:
- Vol/OI Ratio: 1.351 (HIGH ACTIVITY)
- Order Type: STC (Sell to Close)
- Strategy: Close Short Put
What Does This Mean?
Translation: Someone who previously sold these puts (betting AIG wouldn't crash below $77.50) just bought them back to close the position. At $4.8 million, this represents roughly 500,000 shares worth of exposure (5,000 contracts x 100 shares). This is the kind of trade you see maybe a handful of times per year on AIG.
Why Close Now?
Several possibilities:
- Profit-taking: AIG fell from $88+ to $73, making those short puts profitable
- Risk reduction: CEO transition + earnings = potential volatility
- Capital redeployment: Freeing up margin for other opportunities
- Thesis complete: Original bullish bet played out
Technical Setup / Chart Check-Up
Year-to-Date Price Action
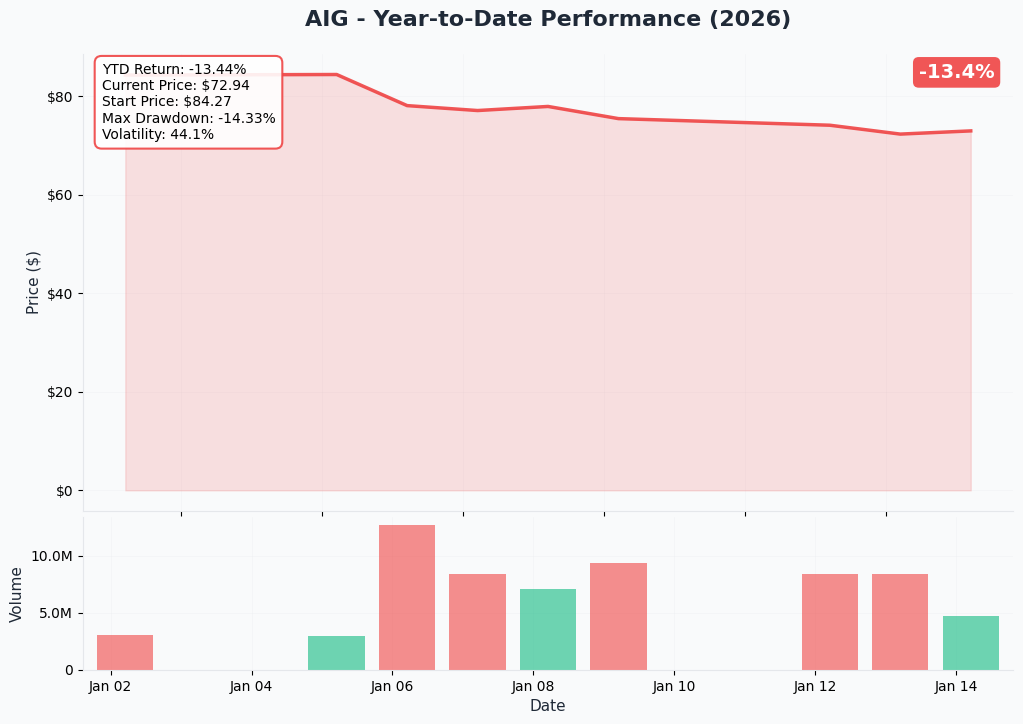
AIG started 2025 around $70 and rallied to $88+ by late December before pulling back sharply. The stock is now testing support near its 52-week low, down roughly 17% from highs.
Gamma-Based Support & Resistance
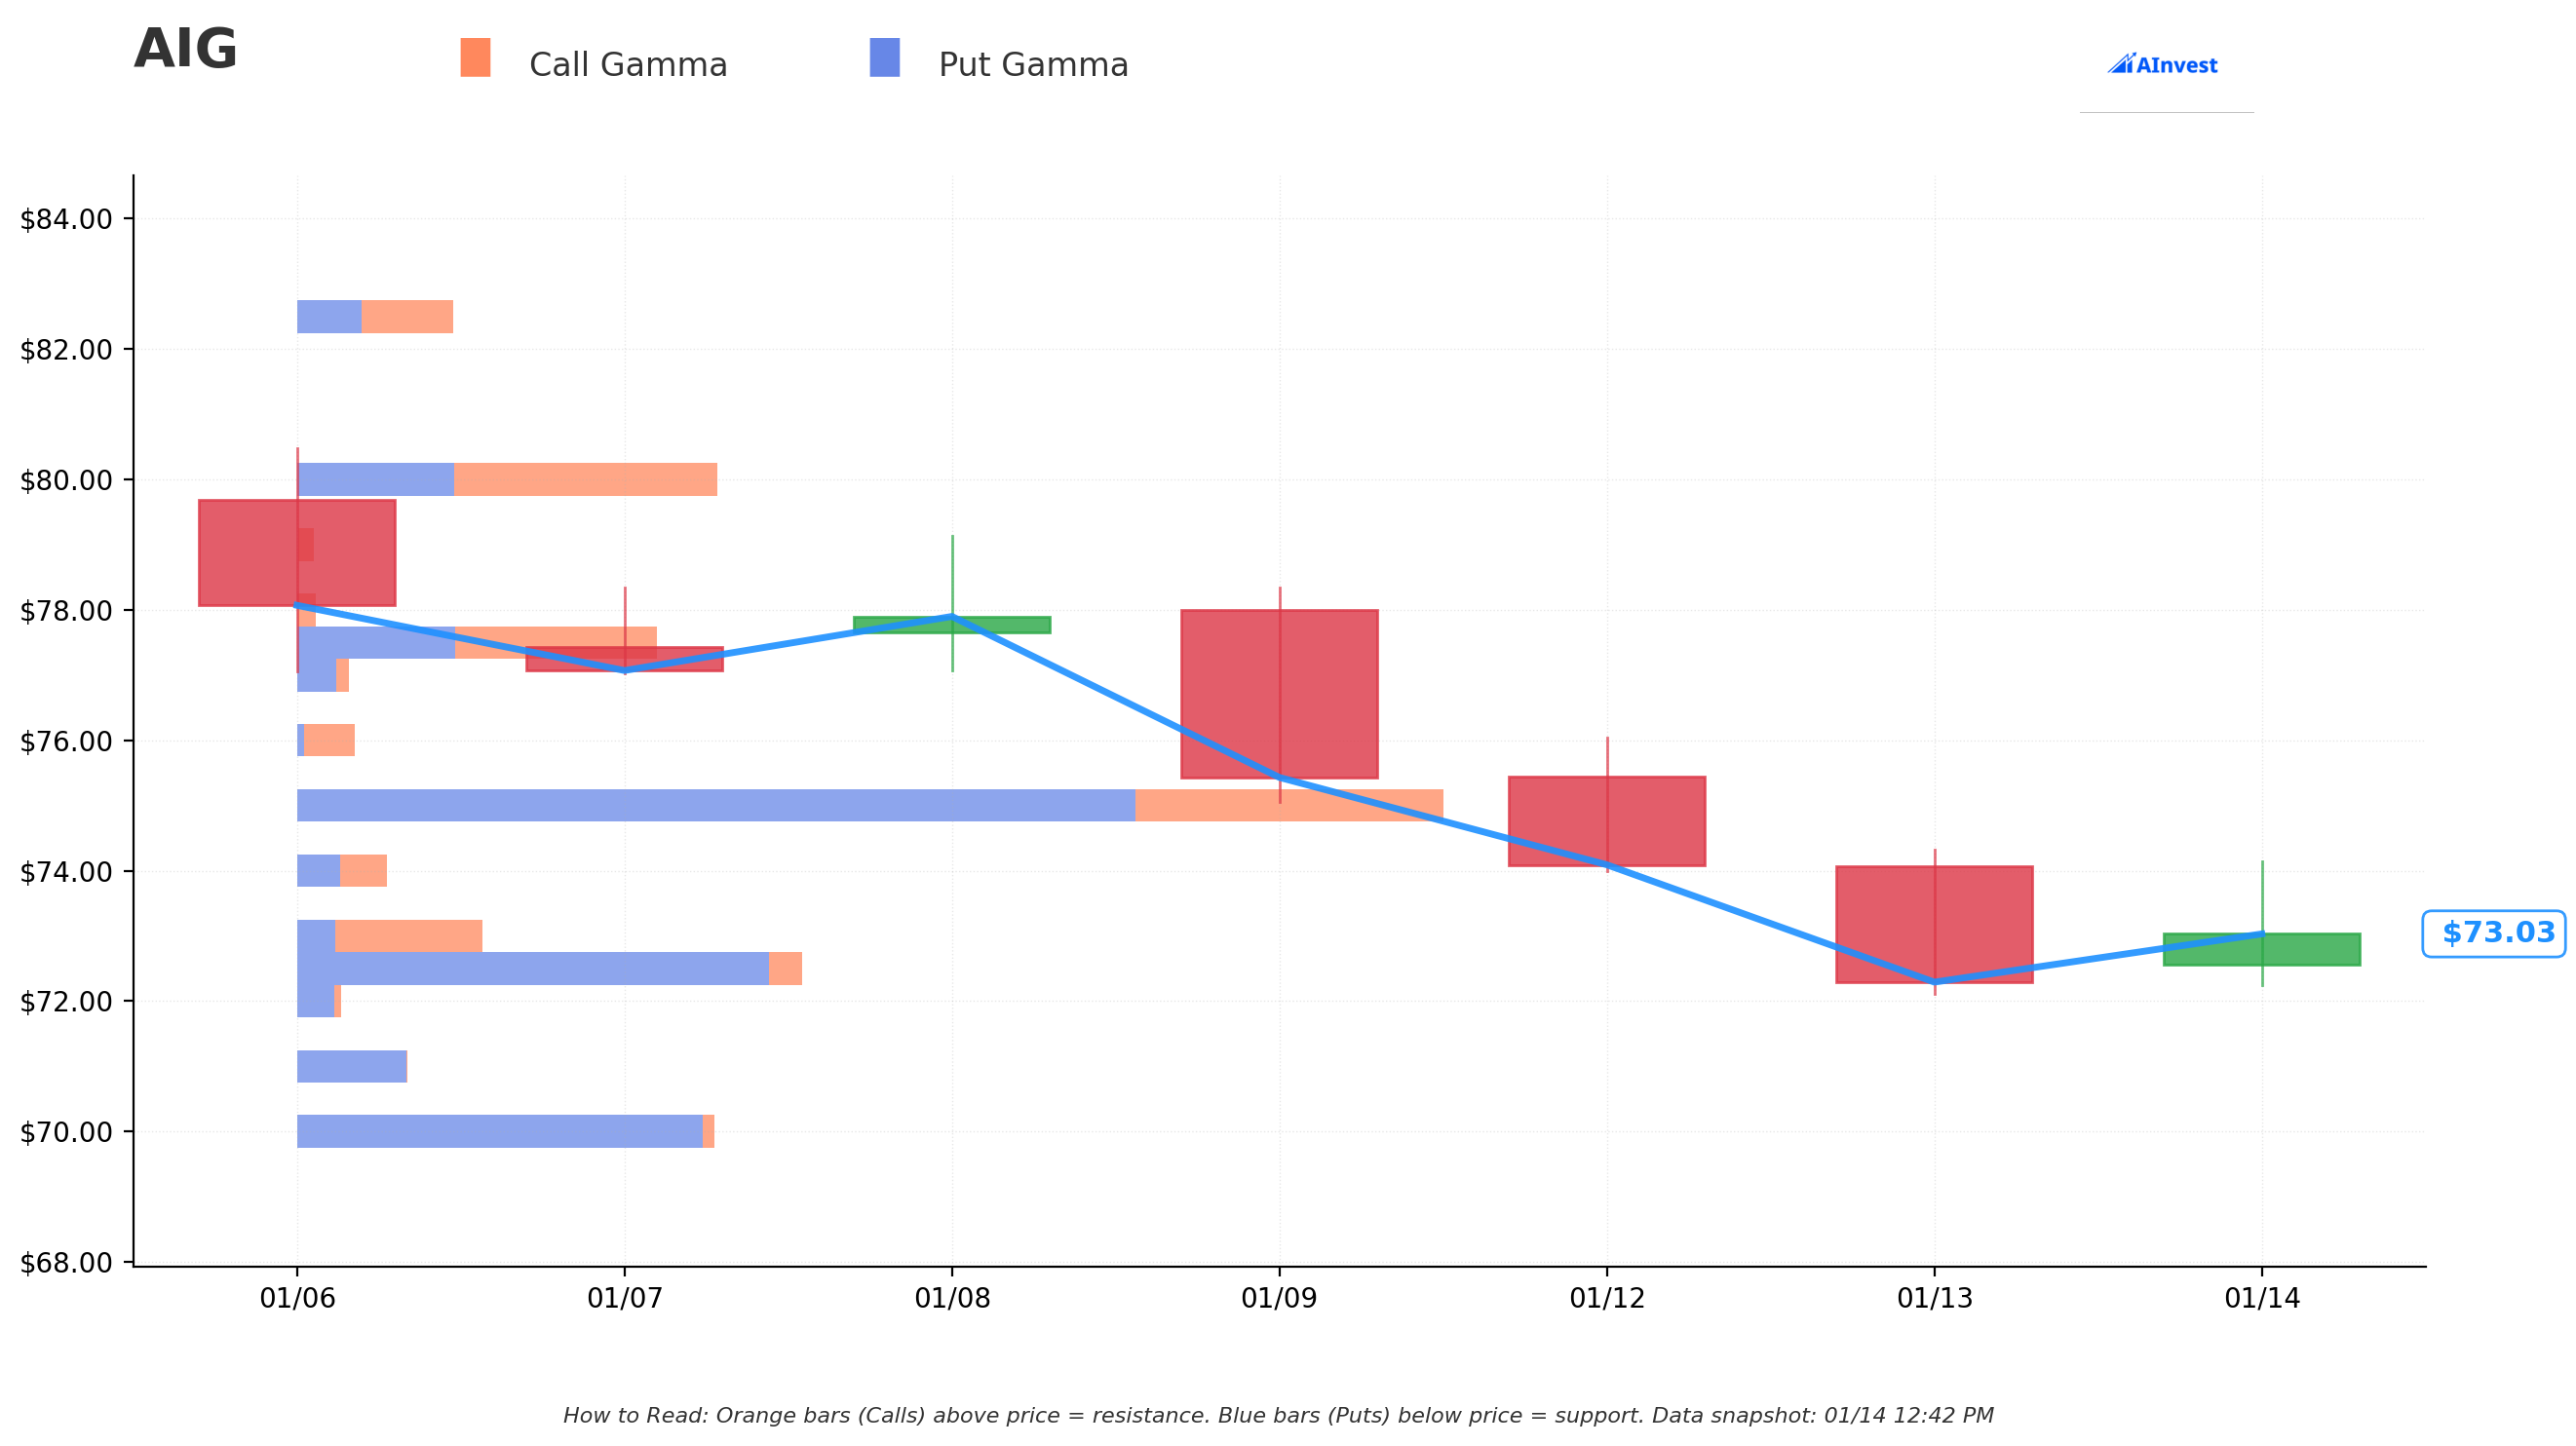
The gamma exposure (GEX) chart reveals where market makers are likely to create price magnetism:
Implied Move Analysis
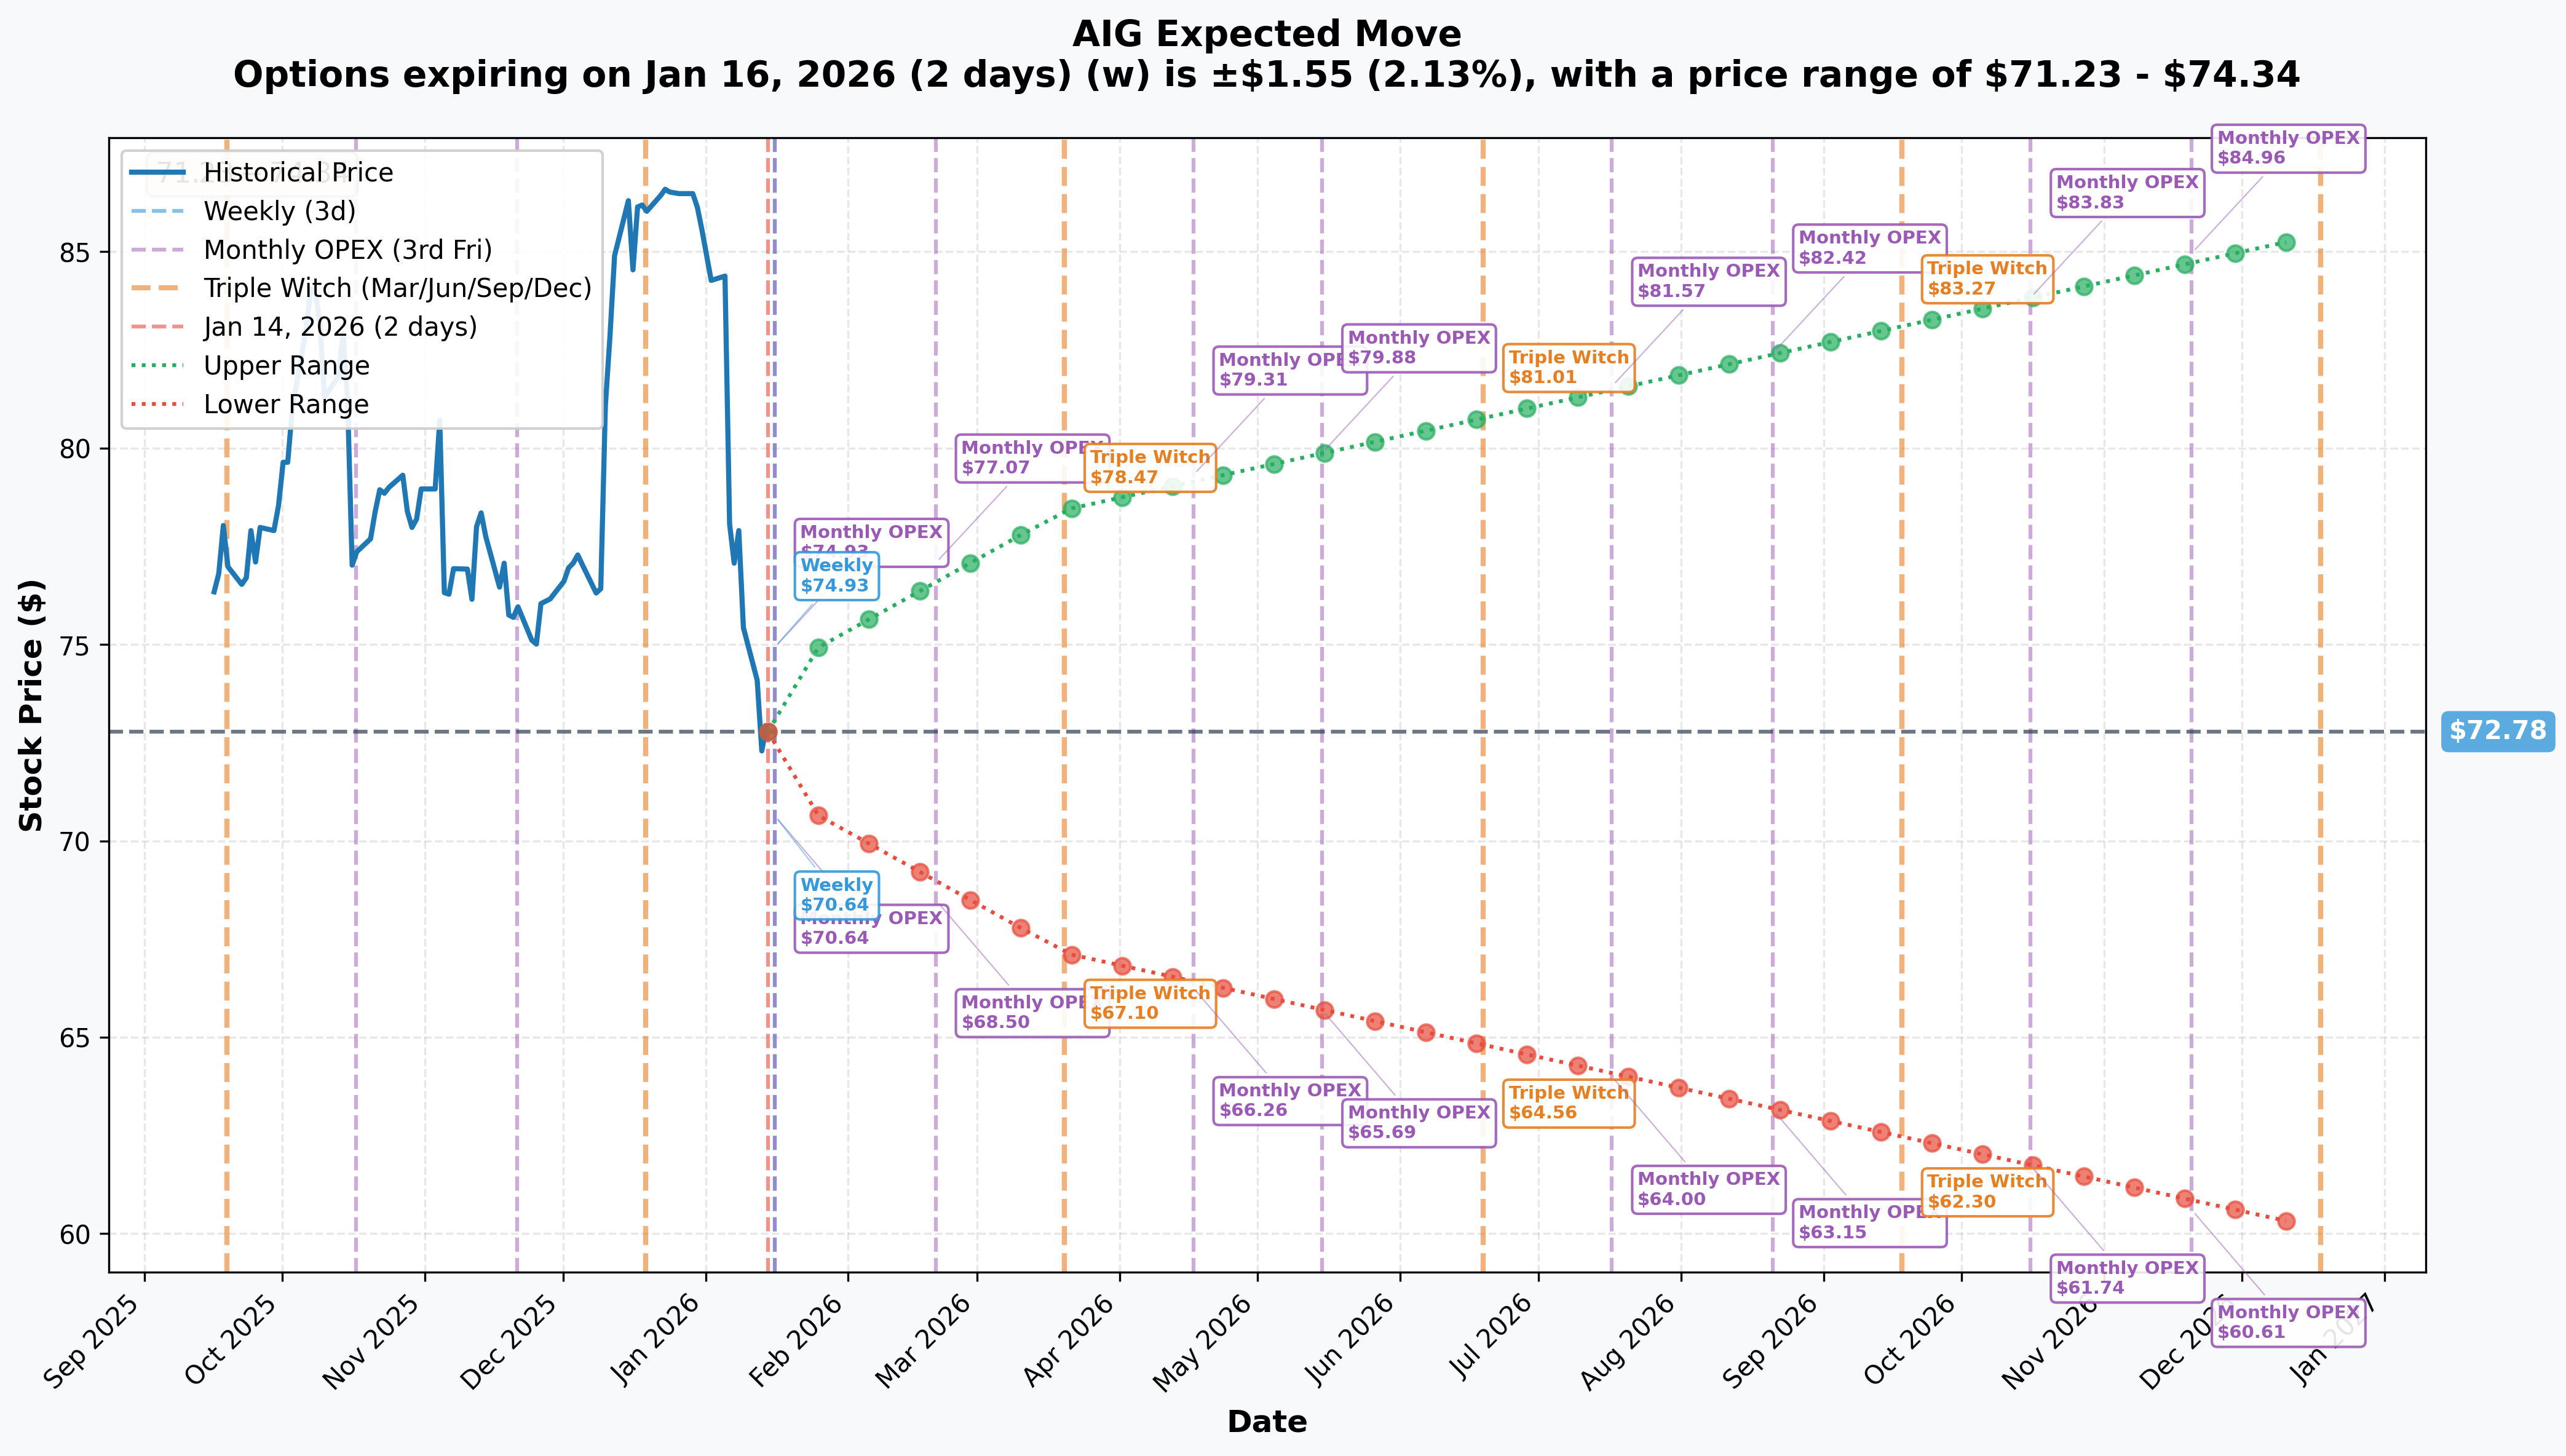
The options market is pricing in the following expected moves:
| Timeframe | Expiry | Implied Move | Range |
|---|---|---|---|
| Weekly | Jan 16 | +/- 2.13% | $71.23 - $74.34 |
| Monthly OPEX | Feb 20 | +/- 5.9% | $68.50 - $77.07 |
| Quarterly | Mar 20 | +/- 7.77% | $67.13 - $78.44 |
| LEAPS | Dec 18 | +/- 17.4% | $60.12 - $85.45 |
Gamma-Based Support & Resistance Analysis
Based on current gamma positioning:
Support Levels (Where Puts Dominate)
| Strike | Net GEX | Distance from Current |
|---|---|---|
| $72.50 (Strongest) | -3.54 | 0.58% below |
| $71.00 | -0.85 | 2.64% below |
| $70.00 | -3.10 | 4.01% below |
Resistance Levels (Where Calls Dominate)
| Strike | Net GEX | Distance from Current |
|---|---|---|
| $73.00 (Nearest) | +0.78 | 0.10% above |
| $75.00 | -4.21 | 2.85% above |
| $77.50 (Trade Strike) | +0.31 | 6.27% above |
| $80.00 | +1.33 | 9.70% above |
| $85.00 | +1.02 | 16.56% above |
Key Gamma Takeaways
- Net GEX Bias: Bearish - Puts slightly outweigh calls overall
- Pinning Zone: $72.50-$73.00 range has heavy gamma positioning
- Support Cliff: Break below $72.50 could accelerate selling to $70
- Trade Strike Context: The $77.50 strike sits in minor resistance territory, explaining why the short put seller is exiting - the stock needs to rally ~6% just to reach breakeven
Implied Move Analysis
The options market expects AIG to stay relatively contained in the near term:
Weekly OPEX (January 16)
- Expected Range: $71.23 - $74.34
- Implied Move: +/- 2.13% (~$1.55)
- Key Event: None before expiry
February OPEX (February 20)
- Expected Range: $68.50 - $77.07
- Implied Move: +/- 5.9%
- Key Event: Q4 Earnings on February 17 - expect elevated IV
March Quarterly (Triple Witch - March 20)
- Expected Range: $67.13 - $78.44
- Implied Move: +/- 7.77%
- Key Events: Post-earnings, CEO transition progress updates
Real talk: The LEAPS out to December 2026 price in a whopping 17.4% move range ($60.12 - $85.45). That's the market saying "a lot can happen with a new CEO."
Catalysts
Upcoming Events (Next 6 Months)
| Date | Event | Potential Impact |
|---|---|---|
| Feb 16, 2026 | Eric Andersen joins as President/CEO-elect | Leadership clarity |
| Feb 17, 2026 | Q4 2025 Earnings | High volatility expected |
| H1 2026 | Convex/Onex deal close (~$2.7B) | Balance sheet impact |
| Q1 2026 | EU Everest renewal rights completion | Premium growth |
| After June 1 | Andersen assumes CEO role | Full transition |
| Mid-2026 | Zaffino to Executive Chair | Era officially ends |
Sources: Business Wire, Insurance Journal, Market Chameleon
Recent Catalysts (Last 3 Months)
| Date | Event | Impact |
|---|---|---|
| Jan 6, 2026 | CEO transition announced | Stock volatile |
| Nov 20, 2025 | AM Best outlook to positive | Credit tailwind |
| Nov 18, 2025 | Fitch upgrade | Rating momentum |
| Nov 4, 2025 | Q3 earnings beat (EPS $2.20 vs $1.68 est) | +77% YoY EPS |
| Oct 30, 2025 | Convex/Onex investment announced | $2.7B+ commitment |
| Oct 27, 2025 | Everest renewal rights ($2B) | Growth catalyst |
Sources: CNBC, AM Best, Fortune
Price Targets & Probabilities
Analyst Consensus
| Metric | Value |
|---|---|
| Average Price Target | $88.53 |
| Median Price Target | $89.00 |
| High Target | $101.00 |
| Low Target | $79.00 |
| Implied Upside | +21.4% from current |
| Rating Distribution | 7 Buy / 15 Hold / 0 Sell |
Sources: MarketBeat, Stock Analysis
Probability Analysis (Based on Options Pricing)
| Scenario | Target | Probability | Timeframe |
|---|---|---|---|
| Holds above $70 | $70+ | ~75% | 3 months |
| Returns to $77.50 (trade strike) | $77.50 | ~45% | 3 months |
| Reaches $80 | $80 | ~35% | 6 months |
| Hits analyst avg ($88.53) | $88.53 | ~25% | 12 months |
| New 52-week high ($90+) | $90+ | ~20% | 12 months |
Trading Ideas
Conservative: Cash-Secured Put Sale
Rationale: Collect premium while targeting entry near strong support
| Parameter | Details |
|---|---|
| Strategy | Sell $70 Put |
| Expiration | February 21, 2026 |
| Premium Target | ~$1.20-$1.50/contract |
| Max Profit | Premium collected |
| Breakeven | ~$68.50-$68.80 |
| Max Risk | Assignment at $70 (own shares at ~$68.50 effective cost) |
| Capital Required | $7,000/contract (cash-secured) |
Why it works: You're getting paid to potentially buy AIG at a 6% discount to current prices, near its 52-week low, and below where the institutional trader was positioned.
Balanced: Bull Put Spread
Rationale: Defined risk bullish play with good risk/reward ahead of earnings
| Parameter | Details |
|---|---|
| Strategy | Sell $72.50/$67.50 Put Spread |
| Expiration | February 21, 2026 |
| Premium Target | ~$1.30-$1.50 credit |
| Max Profit | $130-$150/spread |
| Max Risk | $350-$370/spread |
| Breakeven | ~$71.00-$71.20 |
Why it works: The $72.50 strike sits at strong gamma support, and you're collecting ~30% of the spread width. Stock can fall 2% and you still profit.
Aggressive: Call Calendar Spread
Rationale: Play for post-earnings rally with defined risk
| Parameter | Details |
|---|---|
| Strategy | Sell Feb $77.50 Call / Buy Mar $77.50 Call |
| Expiration | Feb 21 / Mar 20, 2026 |
| Debit Target | ~$0.80-$1.00 |
| Max Profit | $2.00-$3.00+ at expiry if stock near $77.50 |
| Max Risk | Debit paid |
| Breakeven | Stock between ~$74-$82 at Feb expiry |
Why it works: You're positioned at the same strike as today's big trade. If AIG rallies after earnings to the $77-$78 zone, this spread explodes in value. The new CEO joining February 16 and earnings February 17 create a potential catalyst one-two punch.
Risk Factors
Company-Specific Risks
- CEO Transition: Peter Zaffino's departure after a successful turnaround creates execution risk. New CEO Eric Andersen needs time to establish credibility.
- Acquisition Integration: $2B+ Everest deal and $2.7B Convex/Onex investments must be integrated successfully
- Leadership Turnover: Multiple senior departures in late 2025 (Don Bailey, Roberto Nard) create management continuity concerns
Industry & Market Risks
- Softening P&C Market: Commercial insurance rates slipping to low single-digit increases. Property rates dipping for first time since 2017. Source: Insurance Business
- California Wildfire Exposure: January 2025 LA wildfires generated $40B+ industry losses. AIG exposure limited but regulatory environment remains challenging.
- Reserve Adequacy: Long-tail casualty reserves face structural risk from litigation trends and social inflation.
Technical Risks
- Bearish Technical Sentiment: Current technical indicators show 10 bullish vs 16 bearish signals. Source: CoinCodex
- Gamma Support Test: Stock sitting right at $72.50 gamma support. Break below opens path to $70 quickly.
- Limited Upside to Targets: Only 21% upside to analyst consensus, with multiple headwinds ahead.
Bottom Line
This $4.8 million short put closure is classic institutional profit-taking. Someone collected premium betting AIG wouldn't crash - they were right - and now they're cashing out before the storm of CEO transition + earnings + market softening hits.
The smart money message: AIG at $73 is probably fair value given the uncertainty ahead. It's not cheap enough to be a screaming buy, but not expensive enough to short. The trade we saw today suggests institutions are de-risking rather than building positions.
Our lean: Neutral to slightly bullish into earnings. The $72.50 support should hold for now, and the February earnings report could provide clarity on 2026 guidance under new leadership. The calendar spread idea lets you play for upside without betting the farm.
Key levels to watch:
- Support: $72.50 (gamma), $70.00 (psychological + gamma)
- Resistance: $77.50 (trade strike), $80.00, $85.00
- Stop-loss trigger: Close below $70
Sources
- AIG Investor Relations
- CNBC - CEO Transition
- Business Wire - Leadership Announcement
- Insurance Journal
- MarketBeat - Analyst Ratings
- Stock Analysis
- AM Best - Rating Outlook
Disclaimer: This analysis is for informational purposes only and does not constitute investment advice. Options trading involves significant risk and is not suitable for all investors. Past performance does not guarantee future results. Always conduct your own research and consider your risk tolerance before making investment decisions. The author may hold positions in securities mentioned.
Analysis generated by OptionLabs | January 14, 2026