🚀 AMZN $49M Bull Call Spread - Massive Bet on 2026 Breakout! 💰
📅 December 17, 2025 | 🔥 Unusual Activity Detected
🎯 The Quick Take
Someone just deployed $49 MILLION on an AMZN bull call spread this morning at 10:13:31! This enormous position bought 25,000 contracts of the $260 calls while simultaneously selling 25,000 of the $310 calls, both expiring August 21, 2026 - that's 8+ months away! With AMZN trading at $221.88 after a challenging year, smart money is betting BIG on a major rebound by late 2026. Translation: Institutional players are positioning for a 40% rally from current levels, targeting the $260-$310 range over the next 8 months!
📊 Company Overview
Amazon.com Inc (AMZN) is the undisputed king of e-commerce and cloud computing:
- Market Cap: $2.38 Trillion (3rd largest company globally)
- Industry: Retail-Catalog & Mail-Order Houses
- Current Price: $221.88 (trading near key support levels)
- Primary Business: Leading online retailer and marketplace (74% of revenue), Amazon Web Services cloud computing (17%), and digital advertising (9%). International markets contribute 22% of total revenue with 1.56M employees worldwide.
💰 The Option Flow Breakdown
The Tape (December 17, 2025 @ 10:13:31):
| Time | Symbol | Buy/Sell | Call/Put | Expiration | Premium | Strike | Volume | OI | Size | Spot | Option Price | Option Symbol |
|---|---|---|---|---|---|---|---|---|---|---|---|---|
| 10:13:31 | AMZN | BUY | CALL $260 | 2026-08-21 | $36M | $260 | 25K | - | 25,000 | $221.88 | $14.40 | AMZN20260821C260 |
| 10:13:31 | AMZN | SELL | CALL $310 | 2026-08-21 | $13M | $310 | 25K | - | 25,000 | $221.88 | $5.20 | AMZN20260821C310 |
🤓 What This Actually Means
This is a massive bullish debit spread betting on a significant AMZN recovery! Here's what went down:
- 💸 Net premium paid: $23M ($9.20 net debit = $14.40 paid - $5.20 collected) × 25,000 contracts
- 🎯 Profit zone: Stock needs to reach $269.20+ to breakeven, max profit at $310+ ($50 spread width - $9.20 cost = $40.80 max profit per spread)
- 📊 Massive position: This represents exposure to 2.5 MILLION shares worth ~$555M at current prices
- ⏰ Strategic timing: 247 days to expiration (8+ months) captures multiple catalysts: Q4 2024 earnings (already reported), Q1-Q2 2025 earnings, AWS growth trajectory, Project Kuiper launches, and Prime Video advertising ramp
- 🏦 Defined risk play: Maximum loss capped at $23M (the net debit paid), maximum gain at $79M if AMZN reaches $310+
What's really happening here: This trader is making a HIGH-CONVICTION bullish bet that AMZN will recover from current levels near $222 to at least $260 (17% gain) and potentially explode to $310 (40% gain) by August 2026. They're willing to risk $23M to potentially make $79M (3.4x return) if AMZN hits the $310+ target. The spread structure limits upside above $310 but reduces the cost compared to buying calls outright - smart capital allocation for a long-term bullish thesis.
Unusual Score: 🔥🔥 EXTREMELY UNUSUAL (269.76x average for the $260 call leg, 951.67x for the $310 call leg!) - This is institutional-scale positioning that happens only a few times per year. The Z-scores are off the charts, indicating this is NOT retail flow. Someone with SERIOUS capital is betting on a major AMZN recovery story.
📈 Technical Setup / Chart Check-Up
YTD Performance Chart
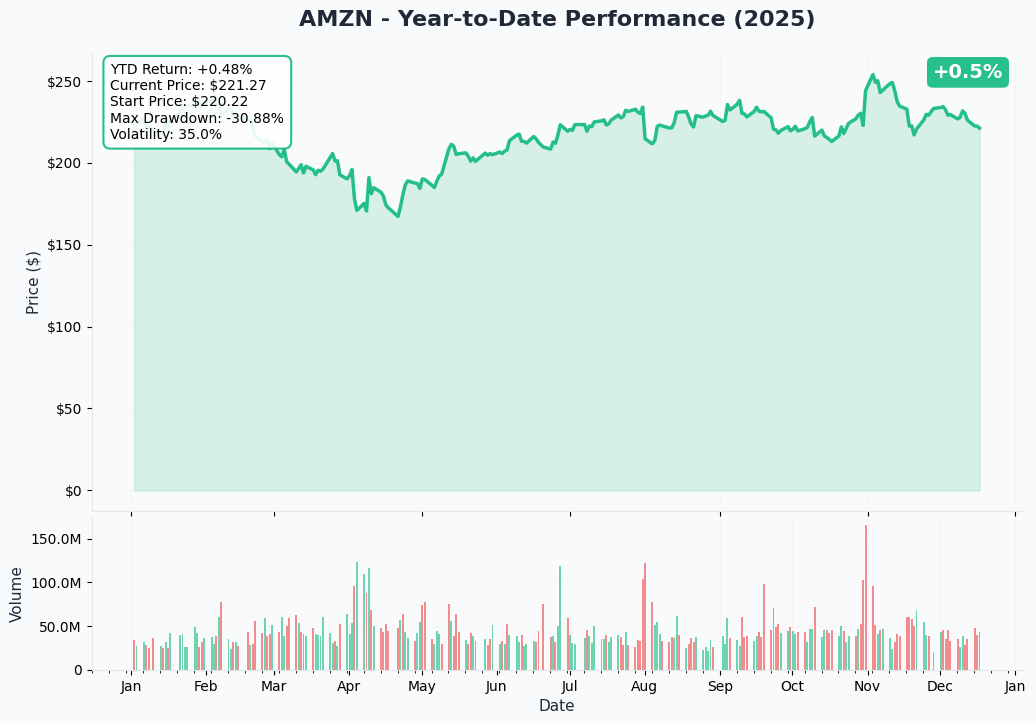
Current Price: $221.88 (as of market close December 17, 2025)
AMZN has had a challenging year but shows signs of building a base. After Amazon's Q4 2024 earnings on February 6, 2025, showed strong results with $187.8B revenue (+10% YoY) and record $21.2B operating income (+61% YoY), the stock initially sold off on Q1 2025 guidance below consensus ($151-155.5B vs $158.5B expected). This created weakness through the first half of 2025.
However, Q1 2025 actual results on May 1, 2025 beat expectations with $155.7B revenue and EPS of $1.59 (beating $1.37 consensus by 16.7%), showing the business fundamentals remain solid despite guidance conservatism. The current price near $222 represents a consolidation zone where smart money appears to be accumulating for the next leg higher.
Key observations:
- 📊 Base building: Stock forming higher lows since March 2025, suggesting accumulation phase
- 🎯 Support holding: Multiple tests of the $215-220 zone without breaking down = strong demand
- 💪 Earnings resilience: Despite conservative guidance, actual results continue beating expectations
- 🚀 Catalyst pipeline: Multiple growth drivers (AWS, advertising, Kuiper) not fully reflected in current valuation
- ⚠️ Overhead resistance: Need to break through $230-235 zone to confirm uptrend resumption
Gamma-Based Support & Resistance Analysis
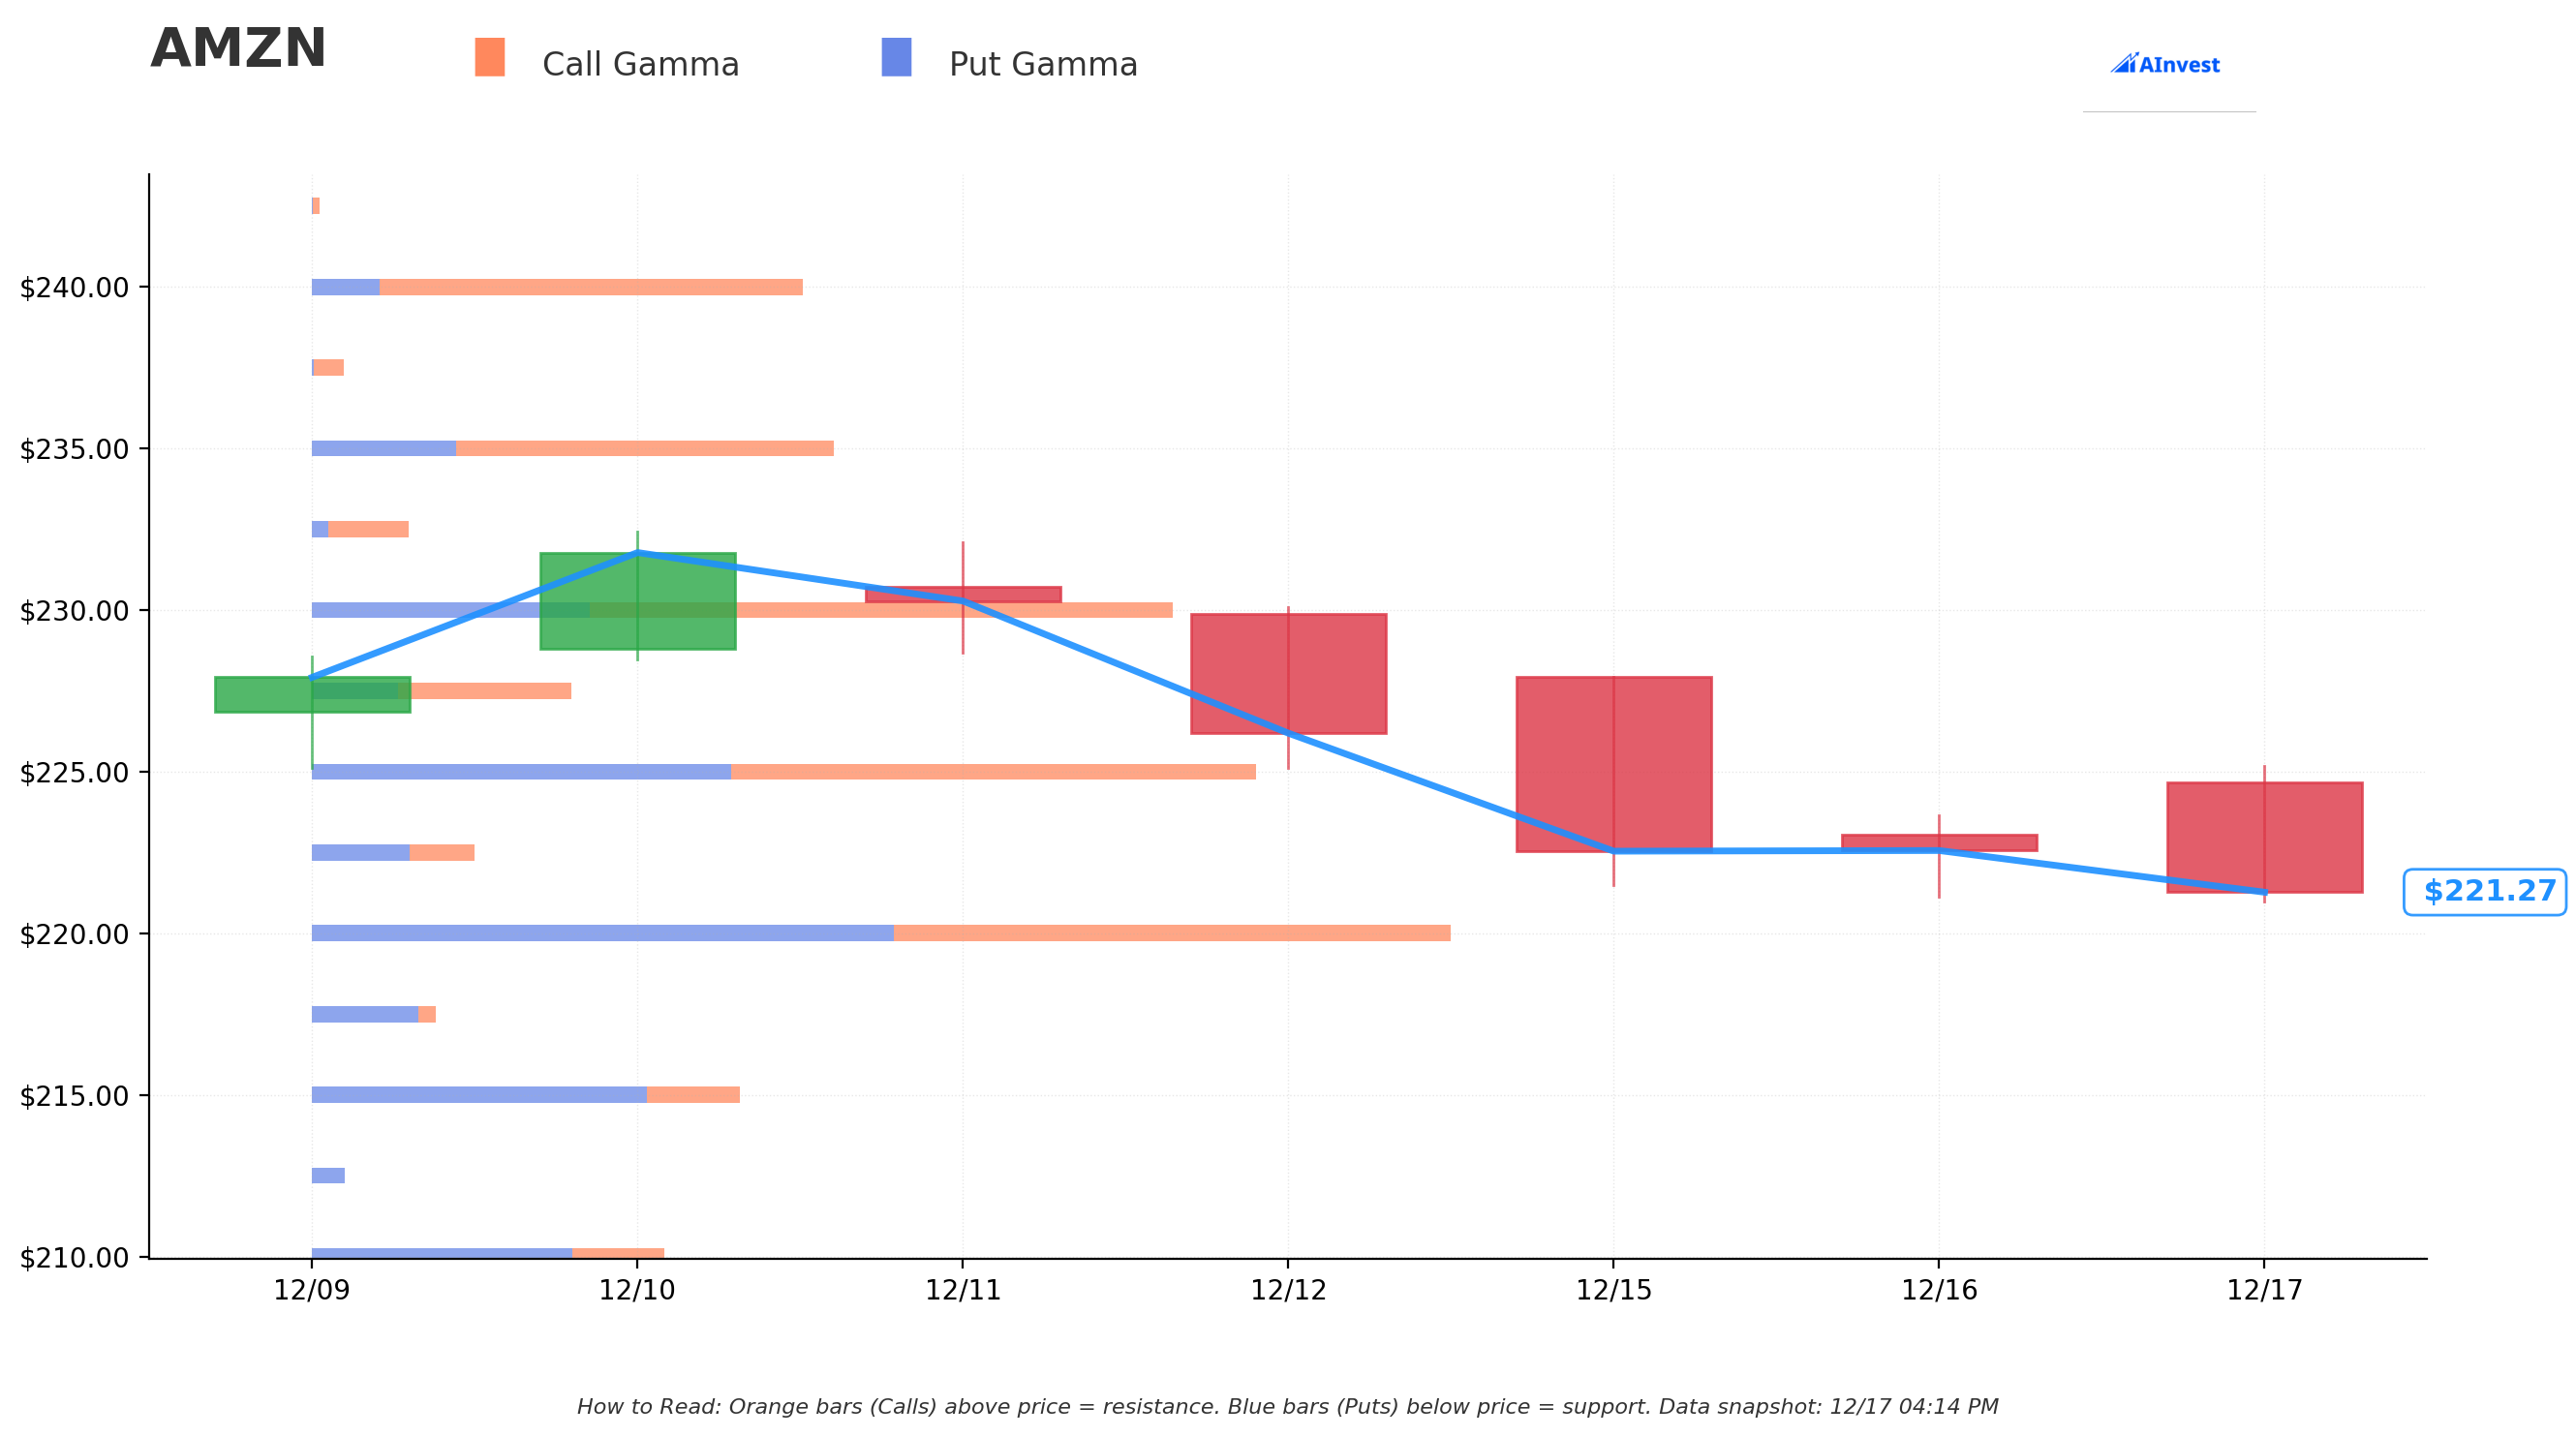
Current Price: $221.88
The gamma exposure map reveals critical price magnets where market makers have massive hedging obligations:
🔵 Support Levels (Put Gamma Below Price):
- $220 - STRONGEST IMMEDIATE SUPPORT with 115.1B total gamma exposure (4.66B net put gamma) at just 0.85% below current price - This is where institutions are defending!
- $215 - Secondary support zone with 47.5B gamma (21.0B net put gamma) at 3.1% below - significant floor if $220 breaks
- $210 - Deep support level with 35.8B gamma (17.3B net put gamma) at 5.4% below - major structural floor
- $200 - Extended support at 27.2B gamma (12.8B net put gamma) at 9.9% below - disaster scenario floor
🟠 Resistance Levels (Call Gamma Above Price):
- $225 - IMMEDIATE CEILING with 94.9B gamma (9.1B net call gamma) at just 1.4% above - first hurdle to clear
- $227.50 - Secondary resistance at 25.8B gamma (8.6B net call gamma) at 2.5% above
- $230 - MAJOR RESISTANCE ZONE with 86.2B gamma (30.3B net call gamma) at 3.7% above - critical breakout level!
- $235 - Strong resistance at 52.3B gamma (23.5B net call gamma) at 5.9% above
- $240 - Extended resistance at 49.2B gamma (35.7B net call gamma) at 8.2% above
- $250 - Major target zone with 37.6B gamma (28.8B net call gamma) at 12.7% above
What this means for traders: AMZN is coiling between rock-solid $220 support (115.1B gamma - the STRONGEST level on the entire chain!) and formidable $225-230 resistance. The gamma data shows dealers have ENORMOUS positions at $220, creating a natural bid - this is why the stock keeps bouncing here. However, overhead resistance at $230 with 86.2B gamma and 30.3B net call gamma will require sustained buying pressure to overcome.
Notice the bull call spread strikes? The buyer positioned at $260/$310 - targeting breakouts through ALL major resistance zones. To reach $260 (the long call strike), AMZN must break through $225, $230, $235, $240, and $250 resistance levels. This is a bet that by August 2026, these resistance levels become irrelevant as fundamental catalysts drive the stock materially higher.
Net GEX Bias: Bullish (455.2B call gamma vs 347.1B put gamma = 108.1B net call gamma) - Overall positioning remains constructive, suggesting market makers are short calls and will need to buy stock if AMZN rallies (positive gamma squeeze potential).
Implied Move Analysis
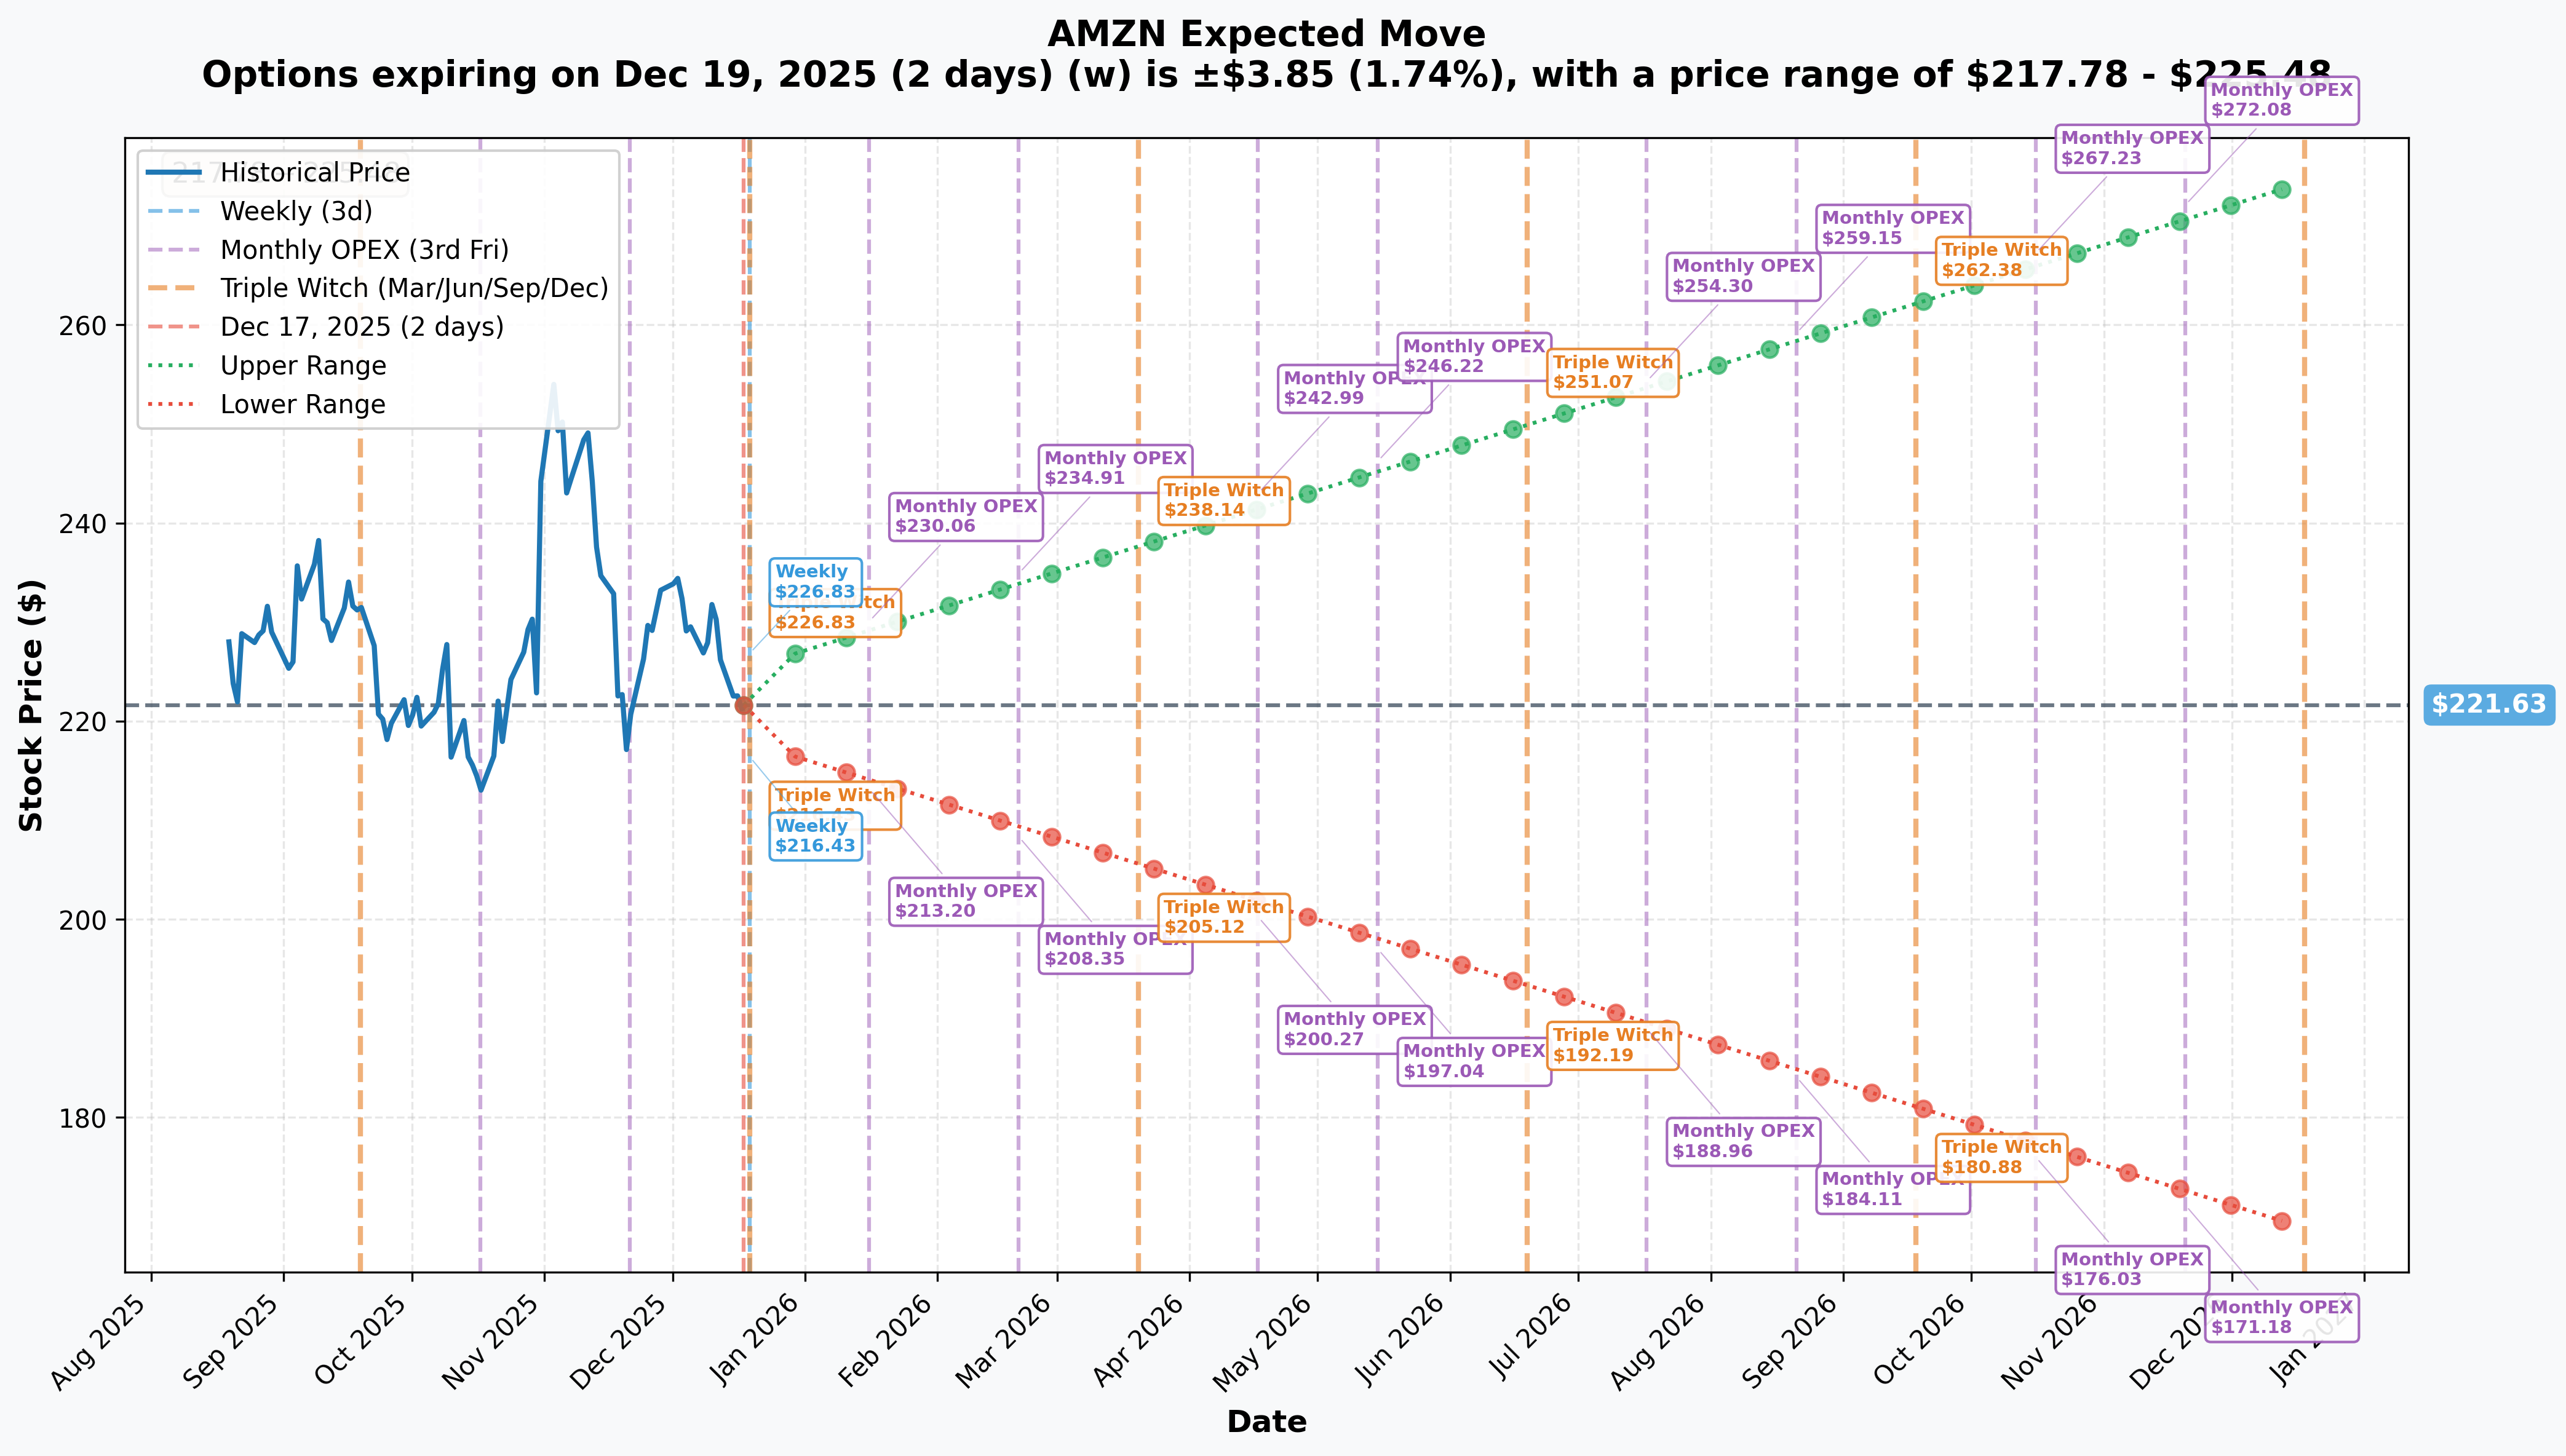
Options market pricing for upcoming expirations:
- 📅 Weekly (Dec 19 - 2 days - TRIPLE WITCH): ±$3.85 (±1.74%) → Range: $217.78 - $225.48
- 📅 Monthly OPEX (Jan 16 - 30 days): ±$8.43 (±3.80%) → Range: $213.20 - $230.06
- 📅 February OPEX (Feb 20 - 65 days): ±$13.28 (±6.00%) → Range: $208.35 - $234.91
- 📅 March Triple Witch (Mar 20 - 93 days): ±$16.51 (±7.45%) → Range: $205.12 - $238.14
- 📅 August OPEX (Aug 21 - 247 days - THIS TRADE!): ±$52.87 (±23.85%) → Range: $168.76 - $274.50
Translation for regular folks: Options traders are pricing in a modest 1.74% move ($3.85) by Friday for triple witch expiration - this is a low-volatility, directionless expectation. But looking out to the August 2026 expiration (when this bull call spread expires), the market expects a MASSIVE ±23.85% move ($52.87) with an upper range of $274.50!
Here's what's CRITICAL: The bull call spread buyer positioned with strikes at $260-$310. The implied move upper range is $274.50, meaning the market thinks there's a realistic probability AMZN trades between $260-$274 by August 2026 - RIGHT IN THE MONEY for this trade's long leg! The $310 target is above the implied range but not unreasonable if catalysts materialize.
Key insight: The relatively low near-term implied volatility (1.74% weekly) versus high long-term volatility (23.85% yearly) reflects market uncertainty about long-term catalysts (Kuiper launches, AI infrastructure buildout, advertising growth) while near-term action remains range-bound. The spread buyer is exploiting this time arbitrage - paying relatively less for longer-dated options while positioning for multi-quarter catalysts to unfold.
🎪 Catalysts
🔥 Already Happened (Foundation for the Trade)
Q4 2024 Earnings - February 6, 2025 ✅
Amazon reported Q4 2024 earnings that showed strong operational execution:
- 📊 Revenue: $187.8B (+10% YoY, in line with consensus)
- 💰 Operating Income: $21.2B (+61% YoY, QUARTERLY RECORD!)
- 💸 Net Income: $20B vs $10.6B year ago
- ✨ EPS: $1.9 vs $1.0 in Q4 2023 (+24.5% beat vs expectations)
- ☁️ AWS Revenue: $28.79B (+19% YoY, operating margin expanded to 36.9% from 29.6%)
- 🚀 2025 Capex: $100B planned (up from $83B in 2024) for AI infrastructure
Q1 2025 Earnings - May 1, 2025 ✅
Amazon beat expectations handily in Q1 2025:
- 📊 Revenue: $155.7B (+9% YoY, in line with consensus)
- 💰 EPS: $1.59 (beat consensus $1.37 by 16.7%, up 62.2% YoY!)
- ☁️ AWS Revenue: $29.3B (+17% YoY, slightly below $29.36B estimate)
- 📺 Prime Video Momentum: Advertising revenue continuing strong growth trajectory
Anthropic AI Investment - November 22, 2024 🤖
Amazon doubled its investment in Anthropic to $8B total:
- 🔗 AWS designated as Anthropic's primary training partner
- 🖥️ Anthropic will use AWS Trainium and Inferentia chips for future models
- 📈 Anthropic's enterprise market share grew from 12% in 2023 to 24% in 2024
- 🎯 Positions Amazon-Anthropic as direct competitor to Microsoft-OpenAI partnership
AWS re:Invent 2024 - December 2024 ☁️
Amazon unveiled major AI innovations:
- 🤖 Amazon Nova Foundation Models: New multimodal AI models (Micro, Lite, Pro, Canvas, Reel)
- 🖥️ Trainium3 Chips: Next-gen AI chip expected late 2025, offering 4x performance improvement
- 🛠️ Amazon Bedrock Enhancements: Model Distillation, Intelligent Prompt Routing reducing costs
🚀 Upcoming Catalysts (Next 8 Months Through August 2026)
Q1 2025 & Q2 2025 Earnings (Already In Books for Analysis)
The Q1 2025 beat proved management's conservative guidance was just that - conservative. Looking ahead through the August 2026 timeframe, traders will watch:
- Q2 2025 earnings (late July/early August 2025)
- Q3 2025 earnings (October/November 2025)
- Q4 2025 earnings (February 2026)
- Q1 2026 earnings (May 2026)
Key metrics to watch:
- ☁️ AWS revenue growth reacceleration (target 20%+ YoY)
- 📺 Prime Video advertising revenue trajectory (targeting $70B+ annual run rate)
- 🤖 AI infrastructure ROI beginning to show in margins
- 📦 Fulfillment network efficiency gains (robotics paying off)
Project Kuiper Satellite Internet Launch - 2025-2026 🛰️
Amazon's $10B Project Kuiper (rebranded "Amazon Leo") is progressing toward commercial service:
- 🚀 First Launch: 27 satellites launched April 28, 2025, second batch of 27 on June 23, 2025
- 📡 Current Constellation: 150+ satellites in orbit as of August 2025
- 📅 FCC Deadline: Must deploy 1,618 satellites (50% of total 3,236) by July 2026
- 🎯 Beta Testing: Limited beta with select customers in late 2025, full commercial rollout in 2026
- 💰 Revenue Potential: Satellite internet market projected at tens of billions annually
Why this matters: If Kuiper launches proceed on schedule and service launches by late 2025/early 2026, this represents a MASSIVE new revenue stream NOT fully valued in current stock price. Direct competition with Starlink in a market with structural demand. By August 2026 (when the bull call spread expires), market will have clear visibility into Kuiper adoption and revenue trajectory.
Prime Video & Advertising Expansion - 2025-2026 📺
Amazon's advertising business reached $56.2B in full-year 2024, nearly double from three years prior:
- 📊 Q4 2024 Ad Revenue: $17.29B (+18% YoY)
- 📺 Prime Video Reach: 315 million monthly viewers globally (up from 200M in April 2024)
- 🏈 NFL Thursday Night Football: 2024 season averaged 14.23M viewers (+13% YoY)
- 🎯 2024-25 Upfront: Exceeded internal $1.8B target
2025-2026 Catalyst: Continued advertising revenue acceleration as Prime Video enters second/third full years with ads. This is becoming a $70-80B+ annual business with MASSIVE margins (90%+ incremental margins on ad revenue). By August 2026, this segment could be contributing $20-25B per quarter - justifying materially higher valuation.
Grocery & Retail Expansion - 2025-2026 🛒
Amazon achieved over $100B in grocery and household essentials sales in 2024:
- 🏪 Amazon Fresh: Exceeded 50 stores by September 2024, now 60+ locations
- 📈 Customer Metrics: 90%+ satisfaction with refreshed layouts; average monthly spend increased 20%
- 🏭 Fulfillment Integration: Modifying 26 Amazon Fresh fulfillment centers to include Whole Foods and Amazon.com products
- 🤖 Micro-Fulfillment: First automated micro-fulfillment center being built in Pennsylvania Whole Foods
Electric Vehicle Fleet Expansion - 2025-2026 🚗
Amazon's Rivian partnership is scaling rapidly:
- 🚚 Current Fleet: 20,000+ Rivian electric delivery vans in US (as of January 2025)
- 📦 Milestone: Delivered 1 billion packages using Rivian vans in 2024
- 🎯 2030 Target: 100,000 vehicles
- ⚡ Infrastructure: 24,000+ chargers at 150+ delivery stations (largest private EV charging operator in US)
AWS Market Position & AI Infrastructure 2025-2026 ☁️
AWS maintains dominant position despite competition:
- 📊 Market Share: 31-33% (Q3-Q4 2024) vs Microsoft Azure 20%, Google Cloud 11%
- 🤖 AI Impact: Generative AI drove half of market growth over past two years
- 💰 Operating Leverage: AWS operating margin at 36.9% in Q4 2024, expanding from 29.6% year ago
- 🚀 Revenue Scale: AWS at $115B+ annualized run rate
By August 2026, AWS should be approaching $140-150B annual run rate if growth sustains at 17-19% YoY. This alone could justify higher AMZN valuation as market re-rates for margin expansion.
⚠️ Risk Catalysts (What Could Go Wrong)
Capital Expenditure Intensity 💸
$100B planned capex for 2025 raises concerns:
- Diminishing returns on AI infrastructure investments
- Margin pressure if revenue growth doesn't match spending
- Competitive pressures requiring sustained high capex through 2026
FTC Antitrust Lawsuit ⚖️
Major ongoing legal challenge:
- 📅 Trial Date: October 2026 (AFTER this option expiration!)
- ⚠️ September 30, 2024 ruling denied Amazon's motion to dismiss
- 💰 Potential Impact: Could force structural changes to marketplace, FBA, pricing policies
AWS Growth Deceleration ☁️
Q4 2024 AWS revenue growth of 19% YoY slightly missed estimates:
- Cloud market potential saturation
- Competition from Azure and Google Cloud gaining share
- Chip shortage constraints expected until H2 2025
Macroeconomic Headwinds 🌍
- Consumer spending sensitivity (retail segment vulnerable)
- Foreign exchange headwinds ($2.1B Q1 2025 FX impact)
- High interest rates impacting capex financing
🎲 Price Targets & Probabilities
Using gamma levels, implied move data, and catalyst analysis through August 2026 expiration:
📈 Bull Case (35% probability)
Target: $290-$320 (SPREAD PRINTS MAXIMUM PROFIT)
How we get there:
- 🚀 AWS reaccelerates: Growth returns to 22-25% YoY by Q2 2025 as AI infrastructure spending pays off
- 📺 Advertising explodes: Prime Video advertising hits $22-25B quarterly run rate (vs $17B in Q4 2024)
- 🛰️ Kuiper launches successfully: Beta service launches Q4 2025, commercial rollout early 2026, early adoption strong
- 🤖 Anthropic partnership wins: Claude gains market share from OpenAI/ChatGPT, validates $8B investment
- 📦 Retail margins expand: Robotics and automation drive 200-300bps margin improvement
- 💰 Operating leverage kicks in: $100B capex begins showing ROI in 2026 earnings
- 🌍 International growth: Amazon fresh expansion internationally drives new revenue streams
- 📊 Multiple expansion: Market re-rates AMZN from ~15x EBITDA to 18-20x on margin expansion and diversification
Path to $310: Break through $225-230 resistance (Q1 2025 earnings beat) → Rally to $250-260 by Q3 2025 (Kuiper launch success) → Push to $280-290 by Q1 2026 (AWS margin expansion) → Final push to $310+ by August 2026 (advertising business at $80B+ run rate)
Key metrics needed:
- AWS revenue >$145B annually (20%+ growth sustained)
- Advertising revenue >$70B annually (25%+ growth)
- Operating margins expanding toward 15% (vs 11.3% in Q4 2024)
- Free cash flow >$80B annually
Why 35% probability: Requires multiple catalysts to align perfectly, but Amazon has history of surprising to upside once market counts them out. The diversification (retail + AWS + advertising + Kuiper) provides multiple paths to $310. Current valuation at $222 offers 40% upside to $310 - achievable with strong execution over 8 months.
🎯 Base Case (45% probability)
Target: $240-$280 (SPREAD PARTIALLY PROFITS)
Most likely scenario:
- ✅ Steady AWS growth: 17-19% YoY sustained, margins slowly expanding to 38-40%
- 📺 Advertising solid: Continues 18-20% growth, reaches $65-70B annual run rate
- 🛰️ Kuiper progressing: Launches proceed but commercial adoption slower than hoped (competing with Starlink)
- 🤖 AI investments mixed: Some wins, some misses - overall positive but not spectacular
- 📦 Retail steady: Growth modest (8-10%), margins inch higher
- 💰 Capex concerns persist: Market skeptical of $100B+ spending, wants to see ROI proof
- ⚖️ Regulatory overhang: FTC lawsuit proceeding but no major developments before August 2026
- 🔄 Multiple sideways: Stock trades 12-16x EBITDA, typical for mega-cap tech with mature growth
Trading pattern: Base around $220-240 through Q1 2025 → Rally to $250-270 on Q2 earnings → Consolidate $260-280 by Q4 2025 → Grind higher to $270-285 by August 2026
Spread P&L in Base Case:
- Stock at $270 on Aug 21, 2026: Long $260 calls worth $10, short $310 calls worth ~$0.50, net value = $9.50 vs $9.20 paid = small profit
- Stock at $280 on Aug 21, 2026: Long calls worth $20, short calls worth ~$2, net value = $18 vs $9.20 paid = ~$8.80 profit per spread = $22M total profit (96% ROI!)
Why 45% probability: This reflects Amazon's strong competitive position and multiple growth drivers, but acknowledges execution risks and capital intensity concerns. Stock gradually appreciates as fundamentals improve but doesn't achieve explosive $310+ target. Spread buyer still makes money but not maximum profit.
📉 Bear Case (20% probability)
Target: $180-$220 (SPREAD EXPIRES WORTHLESS)
What could go wrong:
- 😰 AWS decelerates further: Growth drops to 12-15% as cloud market saturates
- 💸 Capex disaster: $100B+ spending through 2026 shows minimal ROI, margins compress
- 🛰️ Kuiper delays: FCC deadline pressure, technical issues, or Starlink competition crushes adoption
- 📺 Advertising slowdown: Competition from TikTok, YouTube, traditional TV intensifies; growth slows to 10-12%
- ⚖️ FTC lawsuit escalates: Preliminary injunctions or restrictions impact marketplace business
- 🌍 Macro recession: Consumer spending collapses, retail segment tanks 10-15%
- 🇨🇳 International headwinds: China weakness, foreign exchange losses mount
- 💰 Free cash flow disappoints: High capex + lower margins = FCF flat or declining
- 🔨 Break below $220 support: Cascade to $200, then $180 gamma floor
Critical support levels:
- 🛡️ $220: Current major gamma floor (115.1B) - MUST HOLD
- 🛡️ $215: Secondary support (47.5B gamma)
- 🛡️ $210: Deep support (35.8B gamma)
- 🛡️ $200: Disaster floor (27.2B gamma)
Spread P&L in Bear Case:
- Stock below $260 on Aug 21, 2026: Both calls expire worthless, lose entire $23M premium (100% loss)
Why 20% probability: Amazon's diversification and scale provide downside protection. Even if one segment disappoints, others can compensate. AWS alone generates massive cash flow. However, combination of high capex + margin pressure + recession could create perfect storm. The spread buyer clearly thinks this scenario is unlikely (<20% probability) or they wouldn't risk $23M.
💡 Trading Ideas
🛡️ Conservative: Stock Accumulation Below $220
Play: Build position in AMZN stock on dips toward $215-220 support
Why this works:
- 📊 Strong gamma support at $220 (115.1B total gamma) provides technical floor
- 💰 Valuation reasonable at ~25x forward earnings for diversified business
- ☁️ AWS cash cow generating $115B+ annual revenue at 37% operating margins
- 🛡️ Downside protected by multiple support levels ($220, $215, $210)
- 📈 Multiple growth drivers (AWS, advertising, Kuiper) provide upside optionality
- 🤝 Aligning with institutional bull call spread positioning but with stock (no time decay)
Entry strategy:
- 🎯 Scale in: 25% at $220, 25% at $217, 25% at $215, 25% at $212
- 💸 Target average cost basis: $216-218
- ⏰ Time horizon: 12-18 months (longer than the option trade but similar thesis)
- 🚨 Stop loss: Hard stop at $205 (below all major gamma support levels)
Position sizing: 5-10% of portfolio (this is a core tech holding)
Expected outcome:
- 📈 Base case: $240-260 by Q3 2025, $260-280 by mid-2026 (20-30% gain)
- 🚀 Bull case: $280-310 by mid-2026 (35-50% gain)
- 😰 Bear case: Protected by $220-215 support, stop at $205 limits loss to 6-8%
Risk level: Low-Medium (stock ownership, no leverage) | Skill level: Beginner-friendly
⚖️ Balanced: Mini Bull Call Spread (Copy the Pros at Smaller Size)
Play: Replicate the institutional bull call spread at retail scale
Structure: Buy 5-10 AMZN $240 calls, Sell 5-10 AMZN $290 calls (August 21, 2026 expiration - SAME date as the $49M trade)
Why this works:
- 🤝 Copying institutional positioning at affordable retail size
- 📊 Defined risk spread ($50 wide = $5,000 max risk per spread)
- 💰 Lower strikes ($240/$290) vs institutional $260/$310 gives better probability
- ⏰ 247 days to expiration captures multiple catalysts
- 🎯 Targets gamma breakout zone at $240+ with realistic $290 upside
- 💸 Reduced cost vs buying calls outright (selling $290 call funds purchase)
Estimated P&L:
- 💰 Pay ~$18-22 net debit per spread (depending on current volatility)
- 📈 Max profit: $28-32 per spread if AMZN above $290 at expiration (140-180% ROI)
- 📉 Max loss: $18-22 per spread if AMZN below $240 (100% of premium)
- 🎯 Breakeven: ~$258-262 (above current $221.88)
Position sizing examples:
- Aggressive: 10 spreads = $18k-22k at risk, $28k-32k max profit
- Moderate: 5 spreads = $9k-11k at risk, $14k-16k max profit
- Conservative: 2-3 spreads = $3.6k-6.6k at risk, $5.6k-9.6k max profit
Risk management:
- ⏰ Monitor quarterly: Evaluate after each earnings report (May, August, November 2025, February 2026)
- 📊 Adjust if needed: If stock rallies to $260+ by Q2 2025, consider taking profits or rolling up strikes
- 🚨 Cut losses: If stock breaks below $210 and stays there for 2+ weeks, consider closing for salvage value
Risk level: Moderate (defined risk, bullish directional) | Skill level: Intermediate
🚀 Aggressive: Long-Dated ATM Calls (Maximum Leverage)
Play: Buy at-the-money call options for explosive upside leverage
Structure: Buy AMZN $220 or $225 calls (August 21, 2026 expiration)
Why this could work:
- 🚀 Maximum gamma leverage: Every $10 move in stock = ~$10 move in call value above breakeven
- 💥 Explosive returns: Stock at $280 = $55-60 profit on $30-35 investment (160-180% ROI)
- 🎰 Home run potential: Stock at $310 = $85-90 profit (240-270% ROI!)
- ⏰ Time to be right: 8+ months gives multiple catalysts time to play out
- 📊 Cheaper than spread: Single leg requires less capital upfront ($3k-3.5k per contract vs $1.8k-2.2k for spread)
Why this could blow up (SERIOUS RISKS):
- 💸 EXPENSIVE: Calls cost $30-35 each ($3,000-3,500 per contract)
- ⏰ TIME DECAY KILLER: Theta burns -$15-25/day, accelerating as expiration approaches
- 😱 100% loss potential: If stock doesn't reach $255-260 by August 2026, lose entire premium
- 📉 No downside protection: Stock at $215 = losing money daily from theta despite small rally from current $221
- 🎢 Volatility risk: IV crush after earnings could cause losses even if stock moves favorably
- ⚠️ Need BIG move: Stock must reach $255+ (15% gain) just to breakeven
Estimated P&L:
- 💰 Cost: ~$30-35 per call (using Aug 21, 2026 $225 strike)
- 📈 Breakeven: ~$255-260 (need 15-17% rally)
- 🚀 Good profit: Stock at $280 = $55 value, $20-25 profit (60-80% ROI)
- 💥 Home run: Stock at $310 = $85 value, $50-55 profit (160-180% ROI)
- 📉 Loss scenario: Stock below $255 = lose premium (could be 50-100% loss)
CRITICAL WARNING - DO NOT attempt unless you:
- ✅ Understand options decay (theta) and can watch position monthly
- ✅ Can afford to lose ENTIRE premium (real possibility if stock stays flat)
- ✅ Have experience with long-dated call options
- ✅ Accept that you need 15%+ rally just to breakeven
- ✅ Can handle 30-50% drawdowns if stock consolidates in Q1-Q2 2025
- ⏰ Plan to evaluate quarterly and potentially roll or close if thesis changes
Position sizing: Risk only 3-5% of portfolio (this is aggressive speculation)
Risk level: HIGH (can lose 100% of premium) | Skill level: Advanced
Probability of profit: ~35-40% (need sustained rally to $255+)
⚠️ Risk Factors
Don't get caught by these potential landmines:
-
💸 Capital intensity crushing margins: Amazon's $100B planned capex for 2025 (up from $83B in 2024) is UNPRECEDENTED. This level of spending must generate returns or margins will compress significantly. If AWS growth stays at 17-19% instead of accelerating to 22-25%, market will view capex as wasteful. Free cash flow could disappoint in 2025-2026 as investments peak before returns materialize.
-
☁️ AWS deceleration continues: Q4 2024 AWS revenue growth of 19% YoY slightly missed estimates, and Q1 2025 came in at 17%. If this trend continues toward 15% or lower, it signals cloud market saturation. AWS is 17% of revenue but drives majority of operating income - deceleration here kills the bull thesis. Competition from Azure and Google Cloud intensifying, and chip shortages expected until H2 2025 constrain capacity.
-
🛰️ Project Kuiper execution risk: Amazon must deploy 1,618 satellites (50% of 3,236 total constellation) by July 2026 FCC deadline. This is AGGRESSIVE - only 150+ satellites in orbit as of August 2025 means they need to launch 1,400+ satellites in 11 months! Any delays jeopardize entire $10B investment. Starlink's 8,000+ satellites give them massive head start - customer acquisition will be HARD.
-
⚖️ FTC antitrust trial in October 2026: While this falls AFTER the August 2026 option expiration, the trial proceeding creates uncertainty throughout 2025-2026. September 30, 2024 ruling denying Amazon's motion to dismiss signals strong FTC case. Potential structural changes to marketplace, FBA, pricing policies could impact high-margin seller services revenue. Market may discount stock ahead of trial.
-
💰 Valuation offers no cushion: At 25x forward earnings and 2.5x sales, AMZN isn't cheap. The stock needs GROWTH to justify current valuation - any disappointments get punished harshly. Compare to 2022 when stock fell from $180 to $80 on growth slowdown. Current $222 could easily become $180-200 if multiple catalysts disappoint simultaneously.
-
📺 Advertising growth could slow: Q4 2024 advertising revenue grew 18% YoY to $17.29B but decelerated from prior quarters. Competition from TikTok, YouTube Shorts, and traditional TV intensifying. Netflix cutting ad prices puts pressure on Amazon's Prime Video pricing power. If growth slows to 10-12%, this high-margin business can't drive multiple expansion.
-
🌍 Macro recession destroys retail: Amazon's retail segment (74% of revenue) is HIGHLY sensitive to consumer spending. Recession in 2025-2026 would crush e-commerce growth. High interest rates already impacting discretionary purchases. International markets (22% of revenue) facing foreign exchange headwinds ($2.1B FX impact in Q1 2025).
-
🎯 Gamma ceiling at $230 creates resistance: Massive 86.2B call gamma at $230 (30.3B net call gamma) means market makers will systematically SELL into rallies above $225-230 to hedge exposure. This creates mechanical selling pressure making breakouts difficult. Stock has tried breaking $230 multiple times in 2025 and failed - this isn't coincidence, it's gamma physics.
-
💸 Bull call spread is HUGE bet: The $49M institutional position represents someone's HIGH-CONVICTION bet, but institutions aren't always right. They may have access to different information, longer time horizons, or portfolio hedging needs not applicable to retail. The Z-score of 269x (long leg) and 951x (short leg) shows this is EXTREMELY unusual - but unusual doesn't guarantee profitable.
-
🔗 Time decay is ENEMY: Both the institutional spread and any retail copycat trades face relentless theta decay. Even if thesis is correct but timing is off, options can lose significant value. Stock sitting at $235-240 in June 2026 (up 6-8% but below $260 long strike) = spreads underwater despite stock appreciation.
-
📉 Break below $220 could cascade: If major $220 support (115.1B gamma) breaks on bad news, momentum could accelerate lower through $215 → $210 → $200 support levels quickly. Technical breakdown often precedes fundamental deterioration. Watch for volume spike below $218.
🎯 The Bottom Line
Real talk: Someone just bet $49 MILLION that Amazon rebounds significantly over the next 8 months, targeting a move from ~$222 to $260-$310. This isn't a short-term trade or earnings speculation - this is a LONG-TERM strategic bet on Amazon's multiple growth drivers converging by late 2026.
What this trade tells us:
- 🎯 Sophisticated institution sees Amazon as UNDERVALUED at current $222 level given AWS scale, advertising growth, Kuiper opportunity, and retail fundamentals
- 💰 They're confident enough to risk $23M (net debit) to potentially make $79M (3.4x return) if stock reaches $310+
- ⏰ The 8-month timeframe captures multiple major catalysts: Q2/Q3 2025 earnings, Kuiper commercial launch, Prime Video advertising scaling, AWS margin expansion
- 📊 They structured at $260/$310 strikes (17% to 40% upside from current levels) - realistic targets not moonshot speculation
- 🛡️ Using spread instead of outright calls shows disciplined risk management (capping upside at $310 to reduce cost)
This is NOT a "YOLO into AMZN calls" signal - it's a "smart money sees value here for patient investors" signal.
If you own AMZN:
- ✅ Strong hands! You're aligned with this institutional positioning
- 🎯 Consider adding on dips toward $215-220 (strong gamma support zone)
- ⏰ Set calendar reminders for catalyst dates: Kuiper launches (2025), Q2 earnings (July/Aug 2025), advertising upfronts results
- 🚨 Mental stop below $205 (if all major support levels fail, thesis is broken)
- 📊 Target: $260-280 by Q4 2025, $280-310 by mid-2026
If you're considering entering:
- ⏰ Best entry: Scale into stock on dips to $218-215 range (near current levels is reasonable)
- 🎯 Option strategy: Consider mini bull call spreads at lower strikes ($240/$290) for defined-risk leverage
- 📈 Long-term hold: This thesis requires 6-12 months to play out - not a day trade
- ⚠️ Risk management: Position size 5-10% of portfolio max; use stops below $205
- 🚀 Confirmation signals: AWS growth reaccelerating above 20%, advertising revenue beating expectations, Kuiper beta launch announced
If you're bearish:
- ⏰ Don't fight this institutional positioning without strong catalyst
- 📊 Watch for breaks below $220 (major gamma support) as potential short entry
- 🎯 Bearish case requires AWS slowing to <15% growth + capex concerns mounting + Kuiper delays
- ⚠️ Consider put spreads below $220 only AFTER support breaks (don't be early)
Mark your calendar - Key dates:
- 📅 December 19, 2025 (This Friday) - Triple witch OPEX (near-term volatility)
- 📅 January 16, 2026 - Monthly OPEX
- 📅 February 2026 - Q4 2025 earnings report
- 📅 April-June 2026 - Kuiper satellite launches ramping toward FCC deadline
- 📅 May 2026 - Q1 2026 earnings report
- 📅 July 2026 - FCC deadline for 1,618 satellites (50% of constellation)
- 📅 August 21, 2026 - Option expiration date for this $49M trade!
Final verdict: Amazon's business remains one of the most diversified and competitively advantaged in all of tech - AWS at $115B+ run rate with 37% margins, advertising approaching $70B annually with 90%+ incremental margins, $10B Project Kuiper launching, 1.56M employees operating the world's largest logistics network, and $8B Anthropic partnership positioning them in AI. But at $222, the stock is stuck between massive gamma support at $220 and resistance at $230-235.
The $49M bull call spread says: "The breakout is coming. By August 2026, AMZN will be trading materially higher as these catalysts converge."
Are they right? The next 8 months will tell. But when institutions put THIS much capital to work with THIS much conviction, retail traders should pay attention.
Be patient. Be disciplined. Manage risk. The opportunity may be real, but timing and position sizing are everything. 💪
Disclaimer: Options trading involves substantial risk of loss and is not suitable for all investors. This analysis is for educational purposes only and not financial advice. Past performance doesn't guarantee future results. The unusual size of this trade (269x to 951x average) reflects institutional scale - it does not imply the trade will be profitable or that you should follow it. Always do your own research and consider consulting a licensed financial advisor before trading. Bull call spreads have defined maximum profit and loss, but can still result in total loss of premium paid. Amazon faces significant execution risks around capital expenditure returns, AWS growth sustainability, Project Kuiper deployment, and regulatory challenges.
About Amazon.com Inc (AMZN): Amazon is the leading online retailer and marketplace for third party sellers, generating approximately 74% of revenue from retail operations, with Amazon Web Services contributing 17% and advertising services making up 9%. The company has a market cap of $2.38 trillion in the Retail-Catalog & Mail-Order Houses industry.