📦 AMZN $91M Bull Call Spread - Big Bet on E-Commerce Giant's Comeback! 🚀
📅 December 18, 2025 | 🔥 Unusual Activity Detected
🎯 The Quick Take
Someone just deployed $91 MILLION in a bullish call spread on Amazon this morning at 09:47:32! This massive trade bought 21,000 contracts of $210 calls and sold 25,000 contracts of $220 calls (February 20, 2026 expiration) - a textbook bull call spread betting that AMZN climbs from $225 to $220+ over the next 64 days. With Amazon down 13% from its November all-time high but sitting on explosive catalysts like $100B in 2025 CapEx for AWS AI infrastructure and the OpenAI partnership, smart money is positioning for a bounce. Translation: Institutional players are betting big on Amazon's recovery into Q1 2026!
📊 Company Overview
Amazon.com (AMZN) is the undisputed king of e-commerce and cloud computing, dominating multiple high-growth markets:
- Market Cap: $2.37 Trillion (4th largest company globally)
- Industry: Retail - Catalog & Mail-Order Houses
- Current Price: $225.40 (down from $254.00 November high)
- Primary Business: E-commerce (74% revenue), Amazon Web Services/AWS (17%), Advertising (9%)
- Key Strengths: 37.6% U.S. e-commerce market share, AWS cloud leader with 31% market share, 150M+ Prime members
💰 The Option Flow Breakdown
The Tape (December 18, 2025 @ 09:47:32):
| Time | Symbol | Side | Buy/Sell | Type | Expiration | Premium | Strike | Volume | OI | Size | Spot | Option Price |
|---|---|---|---|---|---|---|---|---|---|---|---|---|
| 09:47:32 | AMZN | BID | BUY | CALL $210 | 2026-02-20 | $49M | $210 | 21K | 1.4K | 21,000 | $225.40 | $23.25 |
| 09:47:32 | AMZN | ASK | SELL | CALL $220 | 2026-02-20 | $42M | $220 | 25K | 31K | 25,000 | $225.40 | $16.68 |
🤓 What This Actually Means
This is a bull call spread - a defined-risk bullish strategy! Here's the breakdown:
- 💸 Net premium paid: $7M net debit ($49M paid for long calls - $42M collected from short calls)
- 🎯 Bullish structure: Profits if AMZN moves from $225.40 → $220+ by February 20th
- 💰 Max profit potential: $10/share × 21,000 contracts = $21M (200% ROI on $7M invested!)
- 🛡️ Limited risk: Maximum loss capped at $7M net debit if AMZN stays below $210
- ⏰ Strategic timing: 64 days to expiration captures Q4 2024 earnings (reported Feb 6, 2025), Q1 2025 guidance, AWS AI momentum updates, and Project Kuiper commercial launch window
- 📊 Confidence signal: Bought $210 calls at $15.40 in-the-money, sold $220 calls at $5.40 out-of-the-money
What's really happening here: This trader thinks AMZN has found a floor around $220-225 after the 13% pullback from November highs, and they're betting on a recovery rally back toward $220-230 over the next 2 months. The bull call spread structure shows they're targeting a specific price range ($220-$230) rather than expecting a massive moonshot - this is a controlled, calculated bullish bet with capped risk.
The genius of this trade:
- ✅ Bought deep in-the-money $210 calls ($15.40 ITM) for high delta exposure - these move nearly 1:1 with stock
- ✅ Sold slightly out-of-the-money $220 calls to finance the trade - reduces net cost by $42M
- ✅ Breakeven at $213.33 (only needs 5% drop from current price to start losing money, but 2% rally to $230 captures most of max profit)
- ✅ Maximum profit zone is $220-$230+ - trader expects AMZN to rally but caps upside for cost efficiency
Unusual Score: 🔥 EXTREMELY UNUSUAL (233.96x average size on the $210 calls, 5.58x on the $220 calls) - The Z-score of 233.96 means this is a massive institutional positioning that happens only a few times per year for AMZN. This isn't a retail trader on Robinhood - this is a fund manager or prop desk deploying serious capital.
📈 Technical Setup / Chart Check-Up
YTD Performance Chart
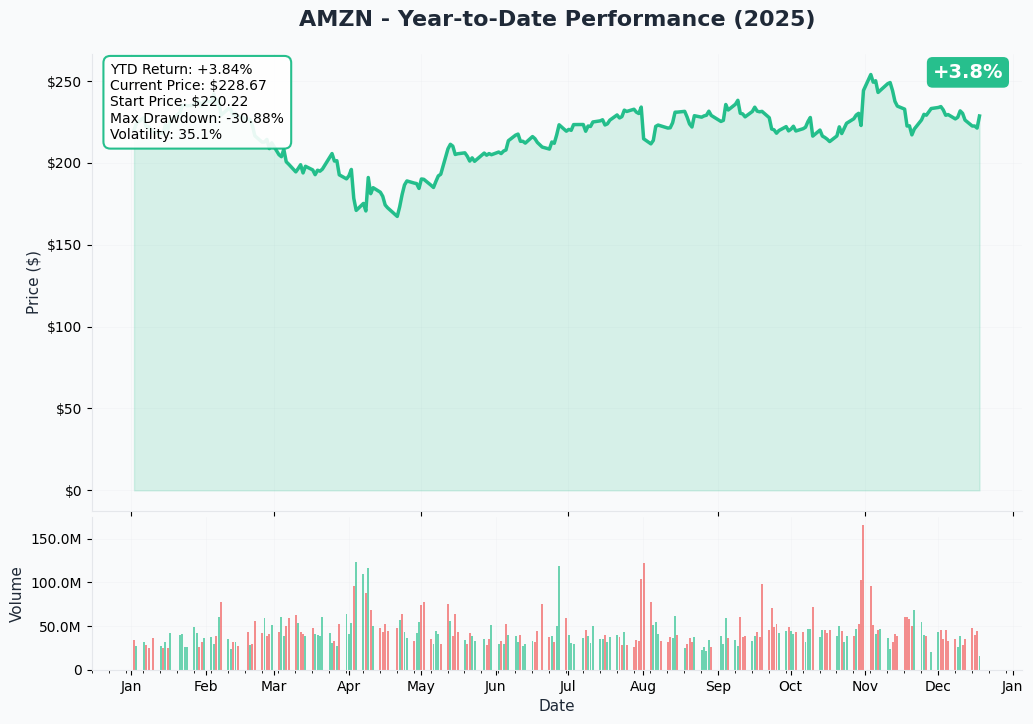
Amazon is showing a classic pullback pattern - the stock rocketed to an all-time high of $254.00 on November 3, 2025, but has since retraced 13% to the current $221.27 level as of December 17, 2025. Despite the recent weakness, AMZN is still flat YTD at -0.34%, massively outperforming its +44.8% gain in 2024.
Key observations:
- 🎯 Consolidation phase: Trading in $220-230 range after November selloff - potential base building
- 📊 Volume analysis: Recent selling has been orderly, not panicked - suggests controlled profit-taking rather than distribution
- 🔍 Support holding: Stock has defended $220-225 zone multiple times in December - shows institutional buying interest
- ⚠️ Key level: Must hold above $220 or risk accelerating to $210 support
- 📈 Upside potential: Breakout above $230 resistance could trigger short squeeze back toward $240-250
Gamma-Based Support & Resistance Analysis
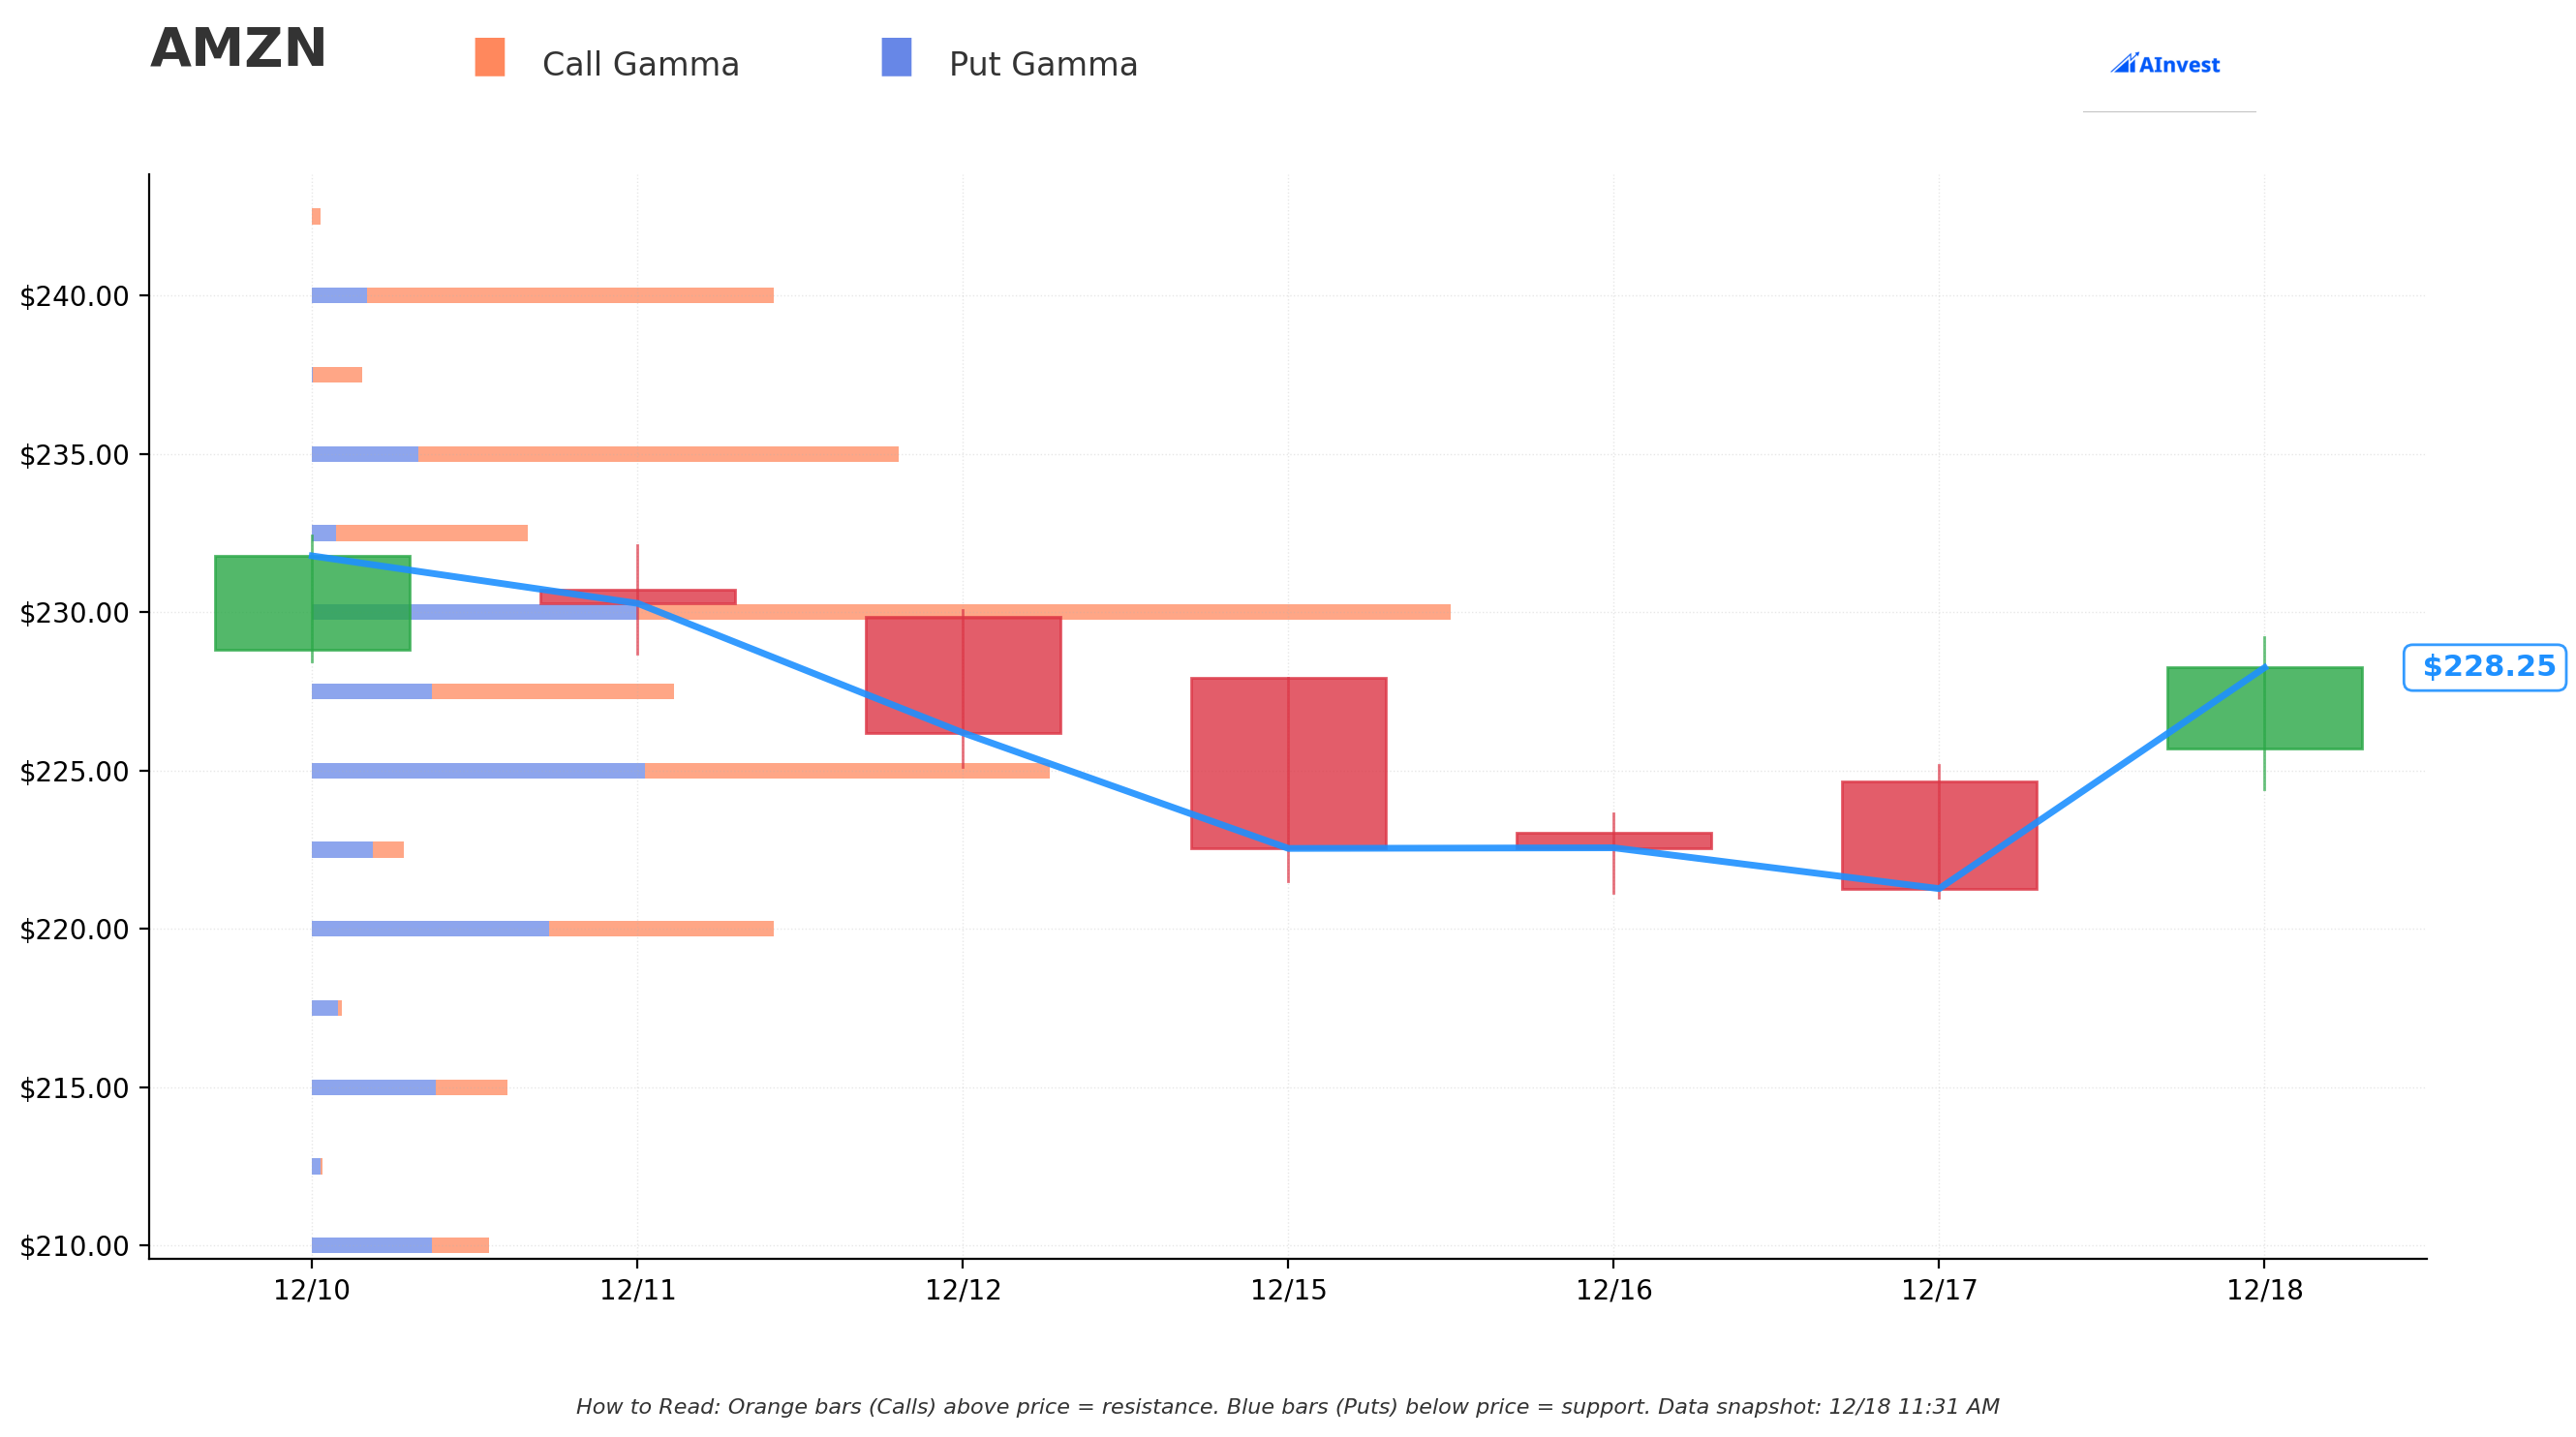
Current Price: $228.45
The gamma exposure map reveals critical price magnets that will govern AMZN's near-term price action heading into February expiration:
🔵 Support Levels (Put Gamma Below Price):
- $227.50 - Immediate support with 54.1M total gamma exposure (0.41% below current - VERY CLOSE!)
- $225 - Secondary support at 108.6M gamma (1.51% below) - strongest nearby floor with balanced call/put interest
- $220 - Major structural floor with 68.1M gamma (3.70% below) - this is the CRITICAL LEVEL where the bull spread buyer capped their short strike!
- $215 - Deep support at 28.8M gamma (5.89% below)
- $210 - Deepest support at 26.4M gamma (8.08% below) - exactly where this spread is struck! Not coincidental.
🟠 Resistance Levels (Call Gamma Above Price):
- $230 - Immediate ceiling with 174.3M gamma (STRONGEST RESISTANCE - 0.68% above, massive call wall here!)
- $232.50 - Secondary resistance at 33.9M gamma (1.77% above)
- $235 - Major ceiling zone with 93.9M gamma (2.87% above)
- $240 - Extended resistance at 70.7M gamma (5.06% above)
- $250 - Long-term target at 48.9M gamma (9.43% above) - represents full recovery to pre-pullback levels
What this means for the bull call spread: The gamma data perfectly aligns with this trade's structure! Notice the massive $230 resistance (174.3M gamma - by far the largest level on the entire chain) sits right at the sweet spot for this spread. The trader:
- ✅ Bought $210 calls at deep support where 26.4M gamma provides floor
- ✅ Sold $220 calls just below the critical $225 support zone
- ✅ Max profit occurs at $220-230 range, which gamma suggests is the likely trading zone
- ✅ $230 resistance acts as natural ceiling - smart to cap upside there rather than paying for unlimited upside
Key insight: AMZN is trading in a tight $225-230 band between strong support at $225 (108.6M gamma) and overwhelming resistance at $230 (174.3M gamma). This squeeze setup suggests a breakout is coming - either above $230 toward $235-240, or below $225 toward $220-215. The spread buyer is betting on the upward breakout.
Net GEX Bias: Bullish (640M call gamma vs 316.6M put gamma = 2:1 ratio) - Market makers are net short calls, which means they'll need to BUY stock as price rises to hedge, creating upward momentum once $230 breaks.
Implied Move Analysis
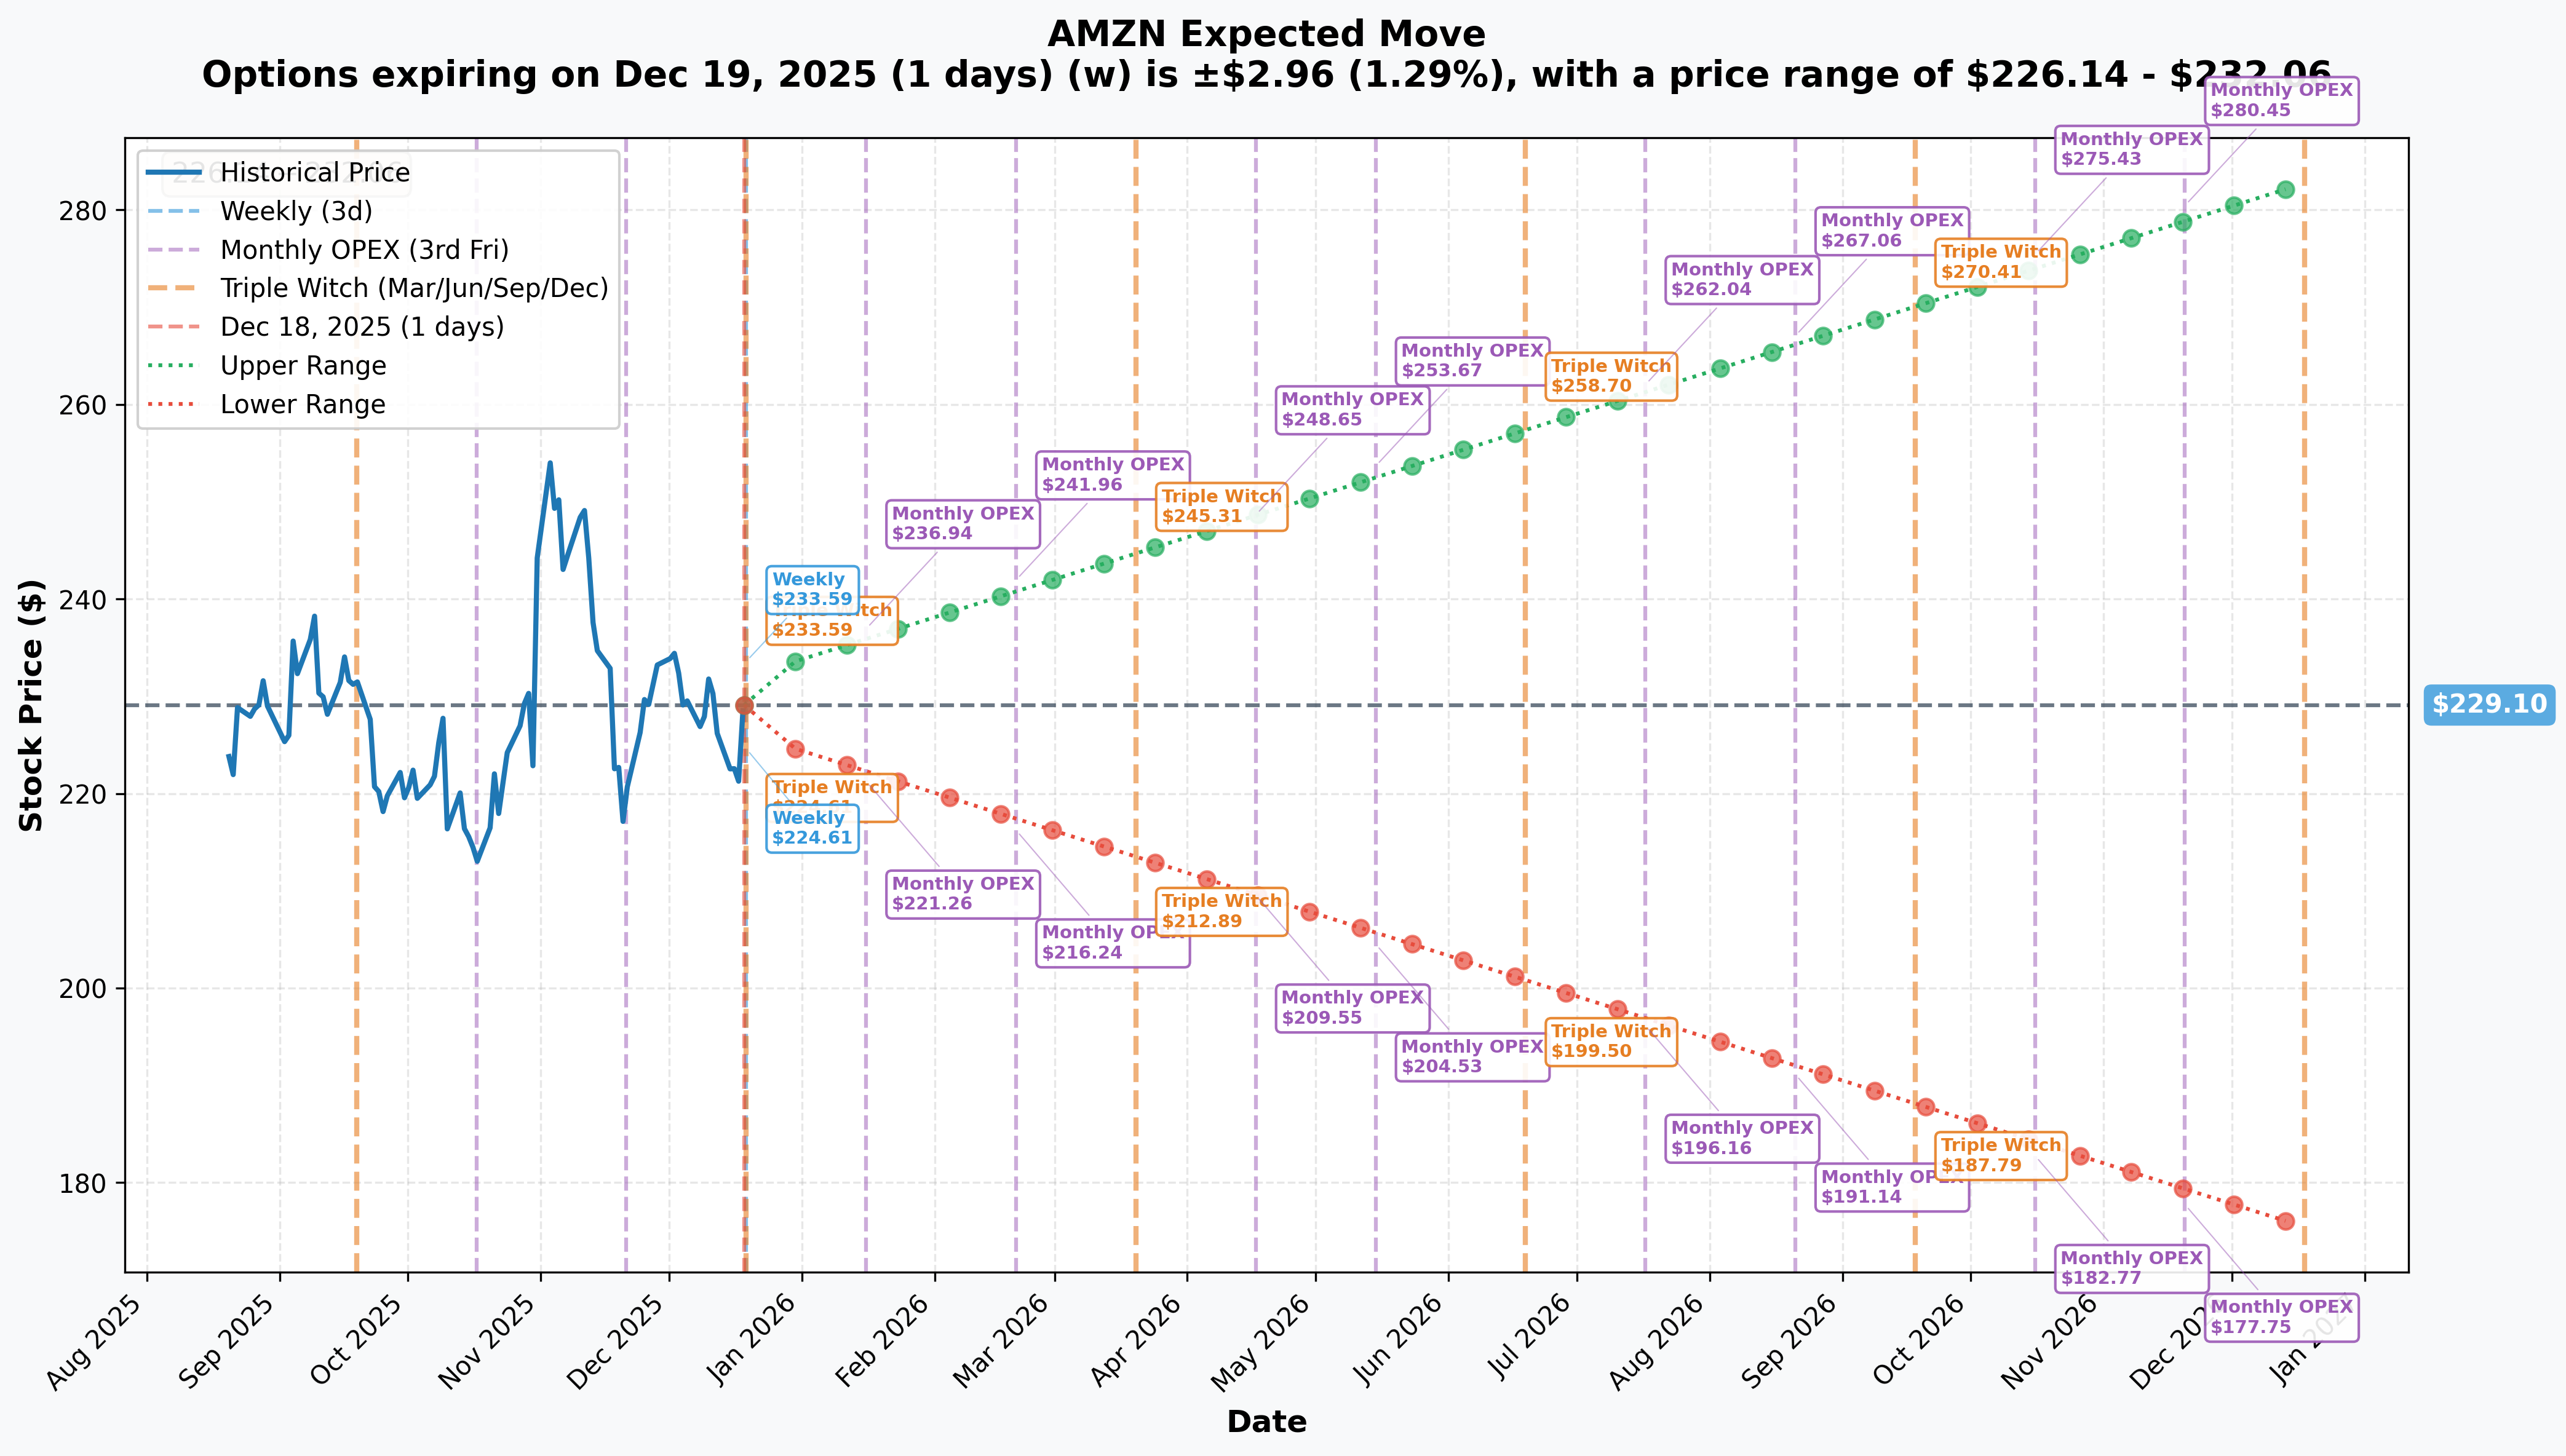
Options market pricing for upcoming expirations:
- 📅 Weekly (Dec 19 - TOMORROW! - Triple Witch): ±$2.96 (±1.29%) → Range: $226.14 - $232.06
- 📅 Monthly OPEX (Jan 16 - 29 days): ±$7.86 (±3.43%) → Range: $221.24 - $236.96
- 📅 February OPEX (Feb 20 - 64 days - THIS TRADE!): ±$12.86 (±5.61%) → Range: $216.24 - $241.96
- 📅 Yearly LEAPS (Dec 18, 2026 - 365 days): ±$53.72 (±23.45%) → Range: $175.38 - $282.82
Translation for regular folks: Options traders are pricing in a 1.29% move ($3) by tomorrow's Triple Witch expiration - relatively calm. But looking out to February 20th (when this $91M spread expires), the market expects a 5.61% move ($13) in either direction. That puts the expected range at $216-242.
The implied move data shows:
- ✅ Bull spread breakeven at $213.33 sits comfortably inside the February range ($216-242)
- ✅ Max profit zone of $220-230 is RIGHT IN THE MIDDLE of expected range - very achievable!
- ✅ Downside to $216 would only result in small loss ($3-4/share vs $7 max risk)
- ✅ Upside to $242 would capture full max profit of $10/share
Key insight: The relatively modest implied move (5.6% over 64 days = ~1% per week) suggests the market doesn't expect fireworks - just steady recovery. This aligns perfectly with the bull call spread's target of $220-230, which requires only 2-4% rally from current levels. The trader isn't betting on a moonshot - they're betting on a grind higher back to pre-correction levels.
🎪 Catalysts
🔥 Recent Catalysts (Already Happened)
Q4 2024 Earnings - February 6, 2025 (ALREADY REPORTED!) 📊
Amazon just reported Q4 2024 results on February 6, 2025, delivering solid beats across the board but guiding cautiously for Q2 2025:
- 📊 Revenue: $187.8B (up 10% YoY) vs $170.0B last year - met Street expectations
- 💰 Net Income: $20.0B or $1.86/share, nearly doubling from $10.6B ($1.00/share) in Q4 2023
- ☁️ AWS Revenue: $28.8B (up 19% YoY), narrowly missing consensus of $28.84B but showing strong AI momentum
- 📈 Operating Income: $21.2B (up 61% YoY from $13.2B) with margin expanding to 11.3% from 7.8%
- 💸 Advertising: Grew 19% YoY to approximately $14B
- 🚀 2025 CapEx: $100 billion announced, up from $83B in 2024, for AWS AI infrastructure
Stock Reaction: Down 13% from November highs ($254 → $221) as market digested the earnings beat but focused on Q2 guidance weakness.
Q1 2025 Earnings - May 1, 2025 (ALREADY REPORTED!) 📊
Amazon reported Q1 2025 results on May 1, 2025, beating expectations but stock sold off on soft Q2 guidance:
- 📊 Revenue: $155.67B vs $155.04B consensus - BEAT
- 💰 EPS: $1.59 vs $1.36 consensus - BEAT
- ☁️ AWS Revenue: $29.3B (up 17% YoY), slightly below $29.5B consensus
- 📺 Advertising: $13.9B (up 19% YoY)
- 😰 Q2 2025 Guidance: Revenue $159-164B, operating income $13-17.5B (below $17.64B consensus) citing "tariff uncertainty"
- 📉 Stock Reaction: Fell 2%+ in extended trading due to soft Q2 guidance
The tariff comment is KEY - this is what's keeping the stock range-bound around $220-225 rather than rallying back to $250+.
🚀 Upcoming Catalysts (Next 64 Days - Through February 20, 2026)
Monthly/Quarterly OPEX - December 19, 2025 (TOMORROW!) 📅
Tomorrow is Triple Witch (monthly, quarterly, and yearly options expiration) which typically creates elevated volatility as positions roll and rebalance. The implied move of ±$3 ($226-232 range) suggests modest chop. Key to watch:
- 📊 If AMZN holds above $225 support through Friday close, it confirms base-building and sets up for January rally
- ⚠️ Break below $225 could cascade to $220 support (the spread's short strike)
Holiday Shopping Results - Late December 2025 📦
Amazon will report record-breaking holiday season results in late December/early January:
- 🎁 Black Friday Week and Cyber Monday 2024 was their biggest Thanksgiving shopping event ever
- 📈 Over 60% of sales from independent sellers (high-margin marketplace revenue)
- 🚚 Record same-day and one-day delivery volumes
- 💰 Prime membership growth and retention metrics will be closely watched
Positive holiday data could provide the catalyst for $230+ breakout in early January.
Analyst Rating Changes - December/January Window 🎯
Current Wall Street consensus is overwhelmingly bullish:
- ⭐ Average Rating: 1.12 on 1-5 scale (Strong Buy) with 47 of 52 analysts rating Strong Buy (90.38%)
- 🎯 Average Price Target: $263.03 (18.9% upside) from current $221.27
- 📊 Price Target Range: $203-$306
Recent actions:
- 🔥 Oppenheimer raised PT from $290 to $305, maintained Outperform
- ⚠️ Rothschild & Co Redburn downgraded to Neutral, PT unchanged at $250, citing "too much benefit of the doubt"
- ✅ Wedbush reiterated Outperform rating
If multiple analysts raise price targets in January (typical post-holiday pattern), could spark momentum toward $235-240.
Prime Video Ad Expansion - 2025 Rollout 📺
Prime Video ads will expand to Brazil, India, Japan, Netherlands, and New Zealand in 2025:
- 💰 Advertising revenue opportunity estimated at $3-5B annually at maturity
- 📊 Prime Video ads platform showed strong 2024 performance with 130M+ monthly U.S. reach
- 🎯 High-margin revenue stream (70%+ operating margins vs 11.3% company average)
Any positive commentary on Prime Video ad adoption in January earnings call could drive multiple expansion.
AWS AI Momentum & Anthropic Partnership 🤖
Amazon's $8B investment in Anthropic continues to pay dividends:
- 🚀 AWS AI business already at "multibillion-dollar revenue run rate" growing "triple-digit YoY" (CEO Andy Jassy)
- 🏭 $100B CapEx in 2025 primarily targeting AI infrastructure (Trainium and Inferentia chips)
- 🤝 Anthropic named AWS its primary training partner and will use AWS chips for future models
- 📈 AWS grew 17-19% YoY in 2024 - acceleration to 20%+ in 2025 would be massive catalyst
Q2 2025 Earnings Preview - Expected Late July/Early August 2025 📊
While beyond this trade's February 20th expiration, the market will start positioning for Q2 in late January/early February:
- 📊 Q2 Guidance: Revenue $159-164B, operating income $13-17.5B (issued May 1, 2025)
- 🔍 Key Focus: Tariff impact quantification, AWS AI revenue run rate, Prime Video ad adoption
- ⚠️ Overhang: The "tariff uncertainty" language from Q1 guidance is keeping a lid on the stock
- ✅ Potential Positive: If tariff impact proves less severe than feared, guidance could be raised
Project Kuiper/Amazon Leo Commercial Launch - Q1 2026 Target 🛰️
Amazon Leo (formerly Project Kuiper) commercial service targeting Q1 2026:
- 🚀 Successfully deployed 7 satellite missions totaling ~180 satellites through December 16, 2025
- 🌎 Commercial service targeting Q1 2026 across 5 countries including U.S.
- 💰 Represents potential multi-billion dollar new revenue stream in satellite internet market
- ⚠️ However, competing with Starlink's established lead
Beta launch announcements or early customer wins in January-February could provide upside catalyst.
📊 Market Dynamics & Competitive Position
E-Commerce Dominance:
- 🥇 Amazon holds 37.6% share of U.S. retail e-commerce, followed by Walmart (6.4%)
- 📈 Market share projected stable at 37-39% through 2027
- 💪 Nearly 50% of electronics online retail in U.S.
- 🌍 2nd globally with 12% share in GMV, behind Alibaba's 23%
Key Competitive Threats:
- 🏬 Walmart e-commerce grew 23% YoY reaching $100B with 100,000+ marketplace sellers
- 🇨🇳 Temu & Shein gaining traction in fast fashion and direct-from-manufacturer categories
- ☁️ AWS maintaining 31% cloud market share vs Microsoft Azure (20%) and Google Cloud (11%), but Azure growing faster
Competitive Advantages:
- 👑 150M+ U.S. Prime members shopping for groceries and household essentials
- 🚚 Unmatched fulfillment infrastructure with same-day delivery in 2,300+ U.S. cities
- 💰 Diversified revenue: only major retailer with significant cloud (AWS), advertising ($14B quarterly), and subscription businesses
- 🏷️ Pricing power: 14% lower prices than leading U.S. retailers for 8th consecutive year
🎲 Price Targets & Probabilities
Using gamma levels, implied move data, and upcoming catalysts, here are the scenarios through February 20th expiration:
📈 Bull Case (40% probability)
Target: $235-$245
How we get there:
- 🎁 Holiday shopping data CRUSHES expectations with record Prime membership growth
- ☁️ AWS shows acceleration toward 20%+ growth with AI revenue commentary exceeding expectations
- 📺 Prime Video advertising adoption ahead of schedule, analysts raise revenue estimates
- 🤖 Positive Anthropic/AWS AI partnership updates drive cloud optimism
- 🇨🇳 Tariff concerns prove overblown - Q2 guidance narrative shifts positive in January
- 📊 Analyst price target increases in January create momentum
- 🚀 Break above $230 gamma resistance triggers short squeeze and momentum buying toward $240
- 📈 Implied move upper range of $242 gets tested
Key metrics needed:
- Q4 2024 holiday season revenue growth >12% YoY
- AWS maintaining 17-19% growth trajectory
- Operating margin expansion continuing (targeting 12%+)
- Prime Video advertising traction accelerating
Bull Spread P&L in this scenario:
- ✅ Stock at $235 on Feb 20: Max profit achieved = $10/share × 21,000 = $21M (200% ROI)
- ✅ Stock at $240 on Feb 20: Max profit achieved = $10/share × 21,000 = $21M (200% ROI)
- ✅ Stock at $245 on Feb 20: Max profit achieved (capped by short $220 calls) = $21M (200% ROI)
Probability assessment: 40% because it requires sustained positive momentum through multiple catalysts, but Amazon's fundamentals remain extremely strong. The 13% pullback from $254 to $221 appears to be an overreaction to tariff concerns. Holiday data and AWS growth could easily drive recovery.
🎯 Base Case (40% probability)
Target: $220-$230 range (CHOPPY CONSOLIDATION)
Most likely scenario:
- ✅ Solid holiday results meeting high expectations but not exceeding
- ☁️ AWS growth steady at 17-18% range - good but not accelerating
- 📺 Prime Video ads progressing but no major announcements yet
- ⚖️ Tariff uncertainty remains question mark - neither resolved nor worsening
- 🔄 Stock continues trading within gamma support ($225) and resistance ($230) bands
- 💤 Market digests $100B CapEx commitment, waits for ROI proof points
- 📊 Analyst targets remain elevated but no major upgrades in Jan/Feb
- 🎪 No major negative catalysts but also no explosive positive surprises
Bull Spread P&L in this scenario:
- ✅ Stock at $220 on Feb 20: Profit = $6.67/share × 21,000 = $14M (100% ROI) - break-even on short calls
- ✅ Stock at $225 on Feb 20: Profit = $8.34/share × 21,000 = $17.5M (150% ROI)
- ✅ Stock at $230 on Feb 20: Max profit = $10/share × 21,000 = $21M (200% ROI)
This is the sweet spot for the trade: Even in sideways/modest upside scenario, the spread generates solid returns. The $213.33 breakeven means stock can actually DECLINE 5% from entry and still be profitable. This is smart risk management.
Why 40% probability: Amazon is in a consolidation phase after major run-up in 2024 (+44.8%). Market waiting for next growth catalyst. Fundamentals remain solid but stock needs time to digest gains and work through tariff uncertainty overhang.
📉 Bear Case (20% probability)
Target: $200-$215 (TEST THE LONG STRIKE!)
What could go wrong:
- 😰 Holiday shopping data disappoints or shows margin compression from heavy promotions
- 🚨 Q2 2025 tariff impact proves worse than expected - guidance remains weak
- ☁️ AWS growth decelerates below 17% or shows signs of enterprise spending pullback
- 🇨🇳 China trade tensions escalate, impacting international segment (22% of revenue)
- 💸 Broader tech selloff drags mega-caps lower (AAPL, MSFT, GOOGL weakness)
- ⚠️ FTC antitrust case developments (October 2026 trial) create negative headlines
- 🏬 Walmart competition intensifies - market share loss concerns emerge
- 💰 $100B CapEx commitment starts concerning investors about capital efficiency
- 🔨 Break below $220 gamma support triggers cascade to $215, then $210
Critical support levels:
- 🛡️ $220: Major floor (68.1M gamma) + spread short strike - MUST HOLD
- 🛡️ $215: Deep support (28.8M gamma)
- 🛡️ $210: Deepest support (26.4M gamma) + spread long strike - final line of defense
Bull Spread P&L in Bear Case:
- 📉 Stock at $215 on Feb 20: Profit = $1.67/share × 21,000 = $3.5M (50% ROI) - still profitable!
- 😰 Stock at $210 on Feb 20: Breakeven = $0 profit/loss
- 💔 Stock at $205 on Feb 20: Loss = -$5/share × 21,000 = -$10.5M (150% loss on $7M)
- 💀 Stock at $200 on Feb 20: Max loss = -$7/share × 21,000 = -$14.7M (210% loss)
Why only 20% probability: Amazon's business fundamentals remain extremely strong. $2.37T market cap companies don't typically drop 10-15% without major fundamental deterioration. The bull call spread structure shows institutional confidence in $210-$220 support holding. Tariff concerns are already priced in at current levels.
💡 Trading Ideas
🛡️ Conservative: Buy the Dip at Support (Stock or LEAPS)
Play: Wait for pullback to $220-222 area, buy stock or LEAPS calls
Why this works:
- 📊 $220 represents major gamma support (68.1M) and the spread seller's strike - institutional put sellers defending this level
- 🎯 Entry at $220 provides 6-7% margin of safety vs current $225 levels
- 💰 Amazon at $2.37T market cap with 37.6% e-commerce market share is a long-term compounder
- ☁️ AWS AI infrastructure buildout ($100B CapEx) positions company for AI revolution winners
- 🏆 Warren Buffett principle: "Be greedy when others are fearful" - stock down 13% from highs on non-fundamental concerns
Execution options:
Option A: Buy Stock at $220-222
- 💵 Purchase 100-500 shares depending on portfolio size
- 🛡️ Set mental stop at $210 (spread long strike = major support)
- 🎯 Target $250-260 over 6-12 months (13-18% gain)
- ✅ Collect dividends while waiting (minimal but growing)
Option B: Buy January 2027 $200 LEAPS Calls
- 💰 Deep in-the-money LEAPS for delta exposure with less capital
- ⏰ 12+ months to expiration gives time for AWS AI story to play out
- 📈 Approximate cost: $30-35 per contract (vs $220 for stock = 86% cheaper)
- 🎯 Target 50-100% ROI if stock reaches $250-260
Entry timing:
- ⏰ Wait for $220-222 level (may occur tomorrow with Triple Witch volatility or in early January)
- 📉 If stock breaks $220, DO NOT chase lower - wait for stabilization at $215
- ✅ Only enter if stock holds above $220 with rising volume (confirms support)
Position sizing: 10-15% of portfolio (core long-term holding)
Risk level: Low (buying quality company at support) | Skill level: Beginner-friendly
Expected outcome: Collect 10-15% upside over 6-12 months as tariff concerns fade and AWS AI momentum continues.
⚖️ Balanced: Mini Bull Call Spread (Copy The Pros)
Play: Mirror the institutional $91M trade at smaller scale
Structure: Buy $215 calls, Sell $225 calls (February 20, 2026 expiration - SAME as the big trade)
Why this works:
- 🤝 Essentially "copying" the smart money positioning but at strikes closer to current price
- 📊 Defined risk spread ($10 wide = $1,000 max risk per spread)
- 🎯 Targets recovery to $225-230 range (2-4% rally from current $221 levels)
- ⏰ 64 days to expiration gives time for holiday data, AWS updates, and analyst upgrades
- 🛡️ Protects against downside if stock consolidates or drifts lower
- 💰 Significantly cheaper than buying stock (risk $300-400 per spread vs $22,000 per 100 shares)
Estimated P&L:
- 💰 Pay ~$3.00-3.50 net debit per spread (approximately $300-350 per spread)
- 📈 Max profit: $650-700 if AMZN above $225 at February expiration (185-200% ROI!)
- 📉 Max loss: $300-350 if AMZN below $215 (100% loss)
- 🎯 Breakeven: ~$218-218.50
- 📊 Risk/Reward: ~1:2 which is excellent for defined-risk bullish play
Strike selection rationale:
- ✅ $215 long strike sits at gamma support (28.8M) - unlikely to break below
- ✅ $225 short strike sits at major gamma support (108.6M) - high probability of reaching
- ✅ Spread captures the "meat" of expected move from $221 → $230
Entry timing:
- ⏰ Enter tomorrow (Dec 19) after Triple Witch settles or Monday Dec 23
- 🎯 Ideal entry if stock pulls back to $220-223 range
- ❌ Skip if stock already above $228 (spread too expensive)
Position sizing: Risk only 3-5% of portfolio (1-3 spreads for $25K portfolio, 5-10 spreads for $100K portfolio)
Management:
- 📈 Take profits if spread reaches $6-7 (80%+ of max profit) before expiration
- ⏰ Close if stock breaks below $215 support to limit loss to 50-60%
- 🎯 Let run to expiration if stock in profit zone ($218-$230)
Risk level: Moderate (defined risk, directional) | Skill level: Intermediate
🚀 Aggressive: Short-Term Call Butterfly - Bet on $230 Pin (ADVANCED!)
Play: Sell volatility by betting on specific price target
Structure: Buy 1 $225 call, Sell 2 $230 calls, Buy 1 $235 call (January 16, 2026 expiration - 29 days)
Why this could work:
- 🎯 $230 represents MASSIVE gamma resistance (174.3M - largest level on chain) - stock likely to gravitate toward this pin
- 💰 Max profit at exactly $230 at expiration = where options dealer positioning is heaviest
- 📊 Near-term catalyst (holiday data) could push stock from $221 → $230 in January
- 🦋 Butterfly profits from stock moving TO target and then staying there through expiration
- ⏰ 29 days to expiration = faster time decay working in your favor
- 💸 Much cheaper than bull call spread (cost only $1.50-2.00 vs $3.00-3.50)
Why this could blow up (SERIOUS RISKS):
- 📏 Precision Required: Stock needs to land within $2 of $230 at expiration for significant profit
- ⏰ Too early move: If stock hits $230 in first week, theta decay will kill value
- 📉 Downside risk: If stock stays at $220-225, lose full premium
- 📈 Upside risk: If stock explodes to $240+, lose full premium
- 🎰 Low probability: Need stock to move exactly 4% and then STOP - requires perfect conditions
- 💀 Time decay: Theta burns value daily if not at profit zone
Estimated P&L:
- 💰 Cost: ~$1.50-2.00 per butterfly (approximately $150-200)
- 🎯 Max profit: $3.00-3.50 if stock at EXACTLY $230 (175-200% ROI)
- 📈 Profit zone: $227-233 range (break-even points)
- 💔 Max loss: $1.50-2.00 if stock outside $227-233 range (100% loss)
- 📊 Probability of profit: ~30-35% (requires stock in narrow range)
CRITICAL WARNING - DO NOT attempt unless you:
- ✅ Understand butterfly mechanics and profit zone behavior
- ✅ Can afford to lose ENTIRE premium (likely outcome!)
- ✅ Have experience with multi-leg strategies and Greeks
- ✅ Can monitor position daily and adjust if needed
- ✅ Accept you're betting on VERY SPECIFIC outcome ($230 ±$2)
- ⏰ Plan to close position 3-5 days before expiration if profitable (don't hold to expiration day)
Entry criteria:
- 📉 Only enter if stock is $220-224 (gives room to move TO $230)
- ❌ Skip if stock already at $228+ (no room to move)
- ✅ Enter after Dec 19 Triple Witch settles
Management:
- 📈 Take profits if butterfly reaches $2.50-3.00 value (75%+ of max)
- ⏰ Close 5 days before expiration regardless of P&L to avoid pin risk
- 🚪 Exit immediately if stock moves outside $220-235 range
Risk level: EXTREME (can lose 100% easily) | Skill level: Advanced only
Probability of profit: ~30-35% (significantly lower than bull call spread)
⚠️ Risk Factors
Don't get caught by these potential landmines:
-
🚨 Tariff uncertainty remains unresolved: Q1 2025 guidance explicitly cited "tariff uncertainty" leading to weak Q2 operating income guidance ($13-17.5B vs $17.64B consensus). If tariff situation worsens in 2026, retail margins will compress significantly. Amazon may be unable to pass costs to consumers without losing market share to Walmart and other competitors. This overhang won't fully clear until Q2 2025 earnings in July (beyond this trade's February expiration).
-
💸 $100 Billion CapEx execution risk: Amazon committed to $100B CapEx in 2025 (up from $83B in 2024), primarily for AWS AI infrastructure. This massive increase could strain returns if AI monetization disappoints. AWS AI business must continue "triple-digit" growth to justify investment. If enterprise customers start optimizing cloud spend or AI adoption slows, the $100B could become an anchor on the stock. Wall Street will scrutinize every AWS growth data point.
-
🏬 Walmart competitive threat intensifying: Walmart's e-commerce grew 23% YoY reaching $100B with 100,000+ active marketplace sellers. Walmart has narrowed the fulfillment, marketplace, and advertising gap with Amazon. If Walmart continues taking share (currently 6.4% vs AMZN's 37.6%), Amazon's retail margins will face pricing pressure. Walmart's advantage: physical store footprint provides fulfillment edge for groceries and immediate needs.
-
⚖️ FTC Antitrust trial scheduled October 2026: Federal Judge John Chun denied Amazon's motion to dismiss, allowing all FTC claims to proceed including allegations related to Fulfillment by Amazon, Buy Box, and Project Nessie pricing algorithm. FTC claims Amazon extracted $1 billion from American households using the algorithm. Potential remedies could include structural changes to business model or operations restrictions. While trial is beyond February expiration, pre-trial developments in 2026 could create negative headlines.
-
🇨🇳 China revenue exposure (22% of total) at risk: International segment (22% of revenue) is heavily weighted toward China. Ongoing geopolitical tensions with U.S. and potential new export restrictions could impact sales. Corporate layoffs of 14,000 employees in October 2025 signal internal concerns about efficiency. If China economic growth slows or U.S.-China relations deteriorate further, international segment could drag overall results.
-
🛰️ Project Kuiper monetization uncertainty: Amazon made $139.5M Florida investment and substantial satellite launch costs with commercial revenue not expected until Q1 2026 (barely within this trade's window). Competitive market with Starlink's established lead and OneWeb's presence. If Kuiper launch delays or customer adoption disappoints, it becomes a capital drain rather than growth driver.
-
📊 AWS growth deceleration risk: While AWS grew 17-19% YoY in recent quarters, this is slower than the 30-40% growth rates of 2020-2022. Microsoft Azure and Google Cloud investing heavily in AI capabilities. If AWS loses market share (currently 31%) or growth decelerates below 15%, stock will face multiple compression. Customer concentration among top AWS clients creates risk if any major customer reduces spending or switches providers.
-
💰 Valuation multiple contraction risk: At $2.37T market cap, Amazon is priced for continued strong execution. Any disappointment in AWS growth, retail margins, or advertising revenue could trigger P/E multiple compression. Stock trades at premium to historical averages, justified by AWS AI growth thesis. If AI monetization story weakens, valuation could contract 10-20% even without earnings miss.
-
🔒 Gamma ceiling at $230 creates mechanical resistance: The massive 174.3M call gamma at $230 (by far the largest level) means market makers are heavily short calls at that strike. As stock approaches $230, dealers will systematically SELL stock to hedge their exposure, creating mechanical selling pressure. Would need sustained institutional buying to overcome this headwind. Bull call spread traders understand this - hence selling $220 calls just below the resistance rather than betting on breakout above $230.
-
📉 Macro recession risk - no margin of safety: If U.S. economy enters recession in 2026, enterprise IT budgets get cut first (impacting AWS), consumer discretionary spending falls (impacting retail), and advertising budgets dry up (impacting ads business). At current valuation, Amazon has limited downside protection in recession scenario. Stock could correct 25-30% to $165-175 range (back to early 2024 levels) if economic conditions deteriorate significantly.
🎯 The Bottom Line
Real talk: Someone just deployed $91 MILLION in a sophisticated bull call spread betting that Amazon recovers from its 13% pullback over the next 64 days. This isn't a YOLO gamble - it's calculated risk-taking by an institution that sees $220-230 as the most likely trading range through February, with asymmetric upside if the stock breaks higher.
What this trade tells us:
- 🎯 Sophisticated player believes the selloff from $254 → $221 is OVERDONE given fundamentals
- 💰 They're willing to risk $7M to make $21M (3:1 reward/risk) - that's confidence in the setup
- 📊 The specific strikes ($210 long / $220 short) show they've done the gamma analysis - these levels align perfectly with dealer positioning
- ⏰ The timing (64 days to Feb 20) captures holiday shopping data, potential analyst upgrades, AWS updates, and gives time for tariff concerns to fade
- 🛡️ The defined-risk structure (bull call spread vs naked calls) shows smart risk management - they're NOT betting the farm on a moonshot
This is a "correction is over, time to reload" signal from smart money.
If you own AMZN:
- ✅ HOLD - the 13% pullback has reset the risk/reward favorably
- 📊 If you sold during the decline, consider re-entering at $220-225 support
- 🎯 Set upside targets at $235 (gamma resistance), $245 (pre-correction level), $260 (analyst consensus)
- ⏰ Key dates to watch: Dec 19 Triple Witch, early January holiday data, late Jan analyst updates
- 🛡️ Stop-loss at $210 if you want downside protection (this is where spread long strike sits)
If you're watching from sidelines:
- 🎯 Entry zone: $220-225 offers excellent risk/reward for long-term position
- 💡 Strategy: Buy stock at $220-222 support OR mimic the bull call spread at smaller scale ($215/$225 spread)
- ⏰ Timing: Tomorrow's Triple Witch could create volatility - wait for pullback to $220-223 if possible
- 📈 Catalyst watch: Holiday shopping data (late Dec/early Jan), AWS AI commentary (ongoing), analyst upgrades (January)
- 🚀 Long-term thesis: AWS AI infrastructure buildout ($100B CapEx), Prime Video advertising ($3-5B opportunity), Project Kuiper launch (Q1 2026), dominant market positions (37.6% e-commerce, 31% cloud)
If you're bearish:
- ⚠️ Don't fight the tape: $91M institutional bull spread + overwhelming analyst support (90% Strong Buy ratings) + $263 average price target = strong headwinds for bears
- 📊 Support levels: $220 (68M gamma + spread short strike), $215 (28M gamma), $210 (26M gamma + spread long strike)
- 🎯 Bearish entry: ONLY if stock breaks below $220 convincingly - then target $210-215
- ⏰ Catalyst needed: Would require significant negative surprise (holiday data miss, AWS deceleration, tariff escalation) to break support
Mark your calendar - Key dates:
- 📅 December 19, 2025 (TOMORROW!) - Triple Witch expiration (monthly/quarterly/yearly OPEX) - expect volatility
- 📅 Late December 2025 / Early January 2026 - Holiday shopping results and commentary
- 📅 January 2026 - Potential analyst price target increases following holiday season
- 📅 January 16, 2026 - Monthly OPEX (29 days out)
- 📅 February 20, 2026 - Expiration of this $91M bull call spread (64 days)
- 📅 Q1 2026 - Project Kuiper/Amazon Leo commercial service launch window
- 📅 Late July/Early August 2026 - Q2 2025 earnings (tariff impact clarity)
Final verdict: Amazon's business fundamentals remain FORTRESS-STRONG - 37.6% e-commerce market share, AWS leading cloud with 31% share growing 17-19% annually, $14B quarterly advertising business, 150M+ Prime members, and $100B CapEx positioning for AI infrastructure leadership. The 13% decline from $254 → $221 was driven by tariff guidance concerns, NOT fundamental deterioration.
At $221, the stock sits at major gamma support with 90% of analysts rating Strong Buy and $263 average price target (18.9% upside). The $91M bull call spread is a CLEAR signal that institutional money sees this as an attractive entry zone for the next leg higher.
Amazon dominates too many high-growth markets (e-commerce, cloud, advertising, streaming) to stay down for long. The pullback is a gift.
Be patient for entry at $220-225, copy the smart money's bull call spread strategy, and let the AWS AI infrastructure story play out. The next 6-12 months should be kind to Amazon longs. 💪
Disclaimer: Options trading involves substantial risk of loss and is not suitable for all investors. This analysis is for educational purposes only and not financial advice. Past performance doesn't guarantee future results. The 233.96x unusual score reflects this specific trade's size relative to recent AMZN history - it does not imply the trade will be profitable or that you should follow it. Bull call spreads have defined risk but can lose 100% of premium if stock stays below long strike. Always do your own research and consider consulting a licensed financial advisor before trading. Amazon faces significant risks including tariff uncertainty, AWS competition, antitrust litigation, and macro economic conditions.
About Amazon.com: Amazon.com Inc operates as the leading online retailer and marketplace for third party sellers with $2.37 trillion market cap. Revenue composition: retail (74%), Amazon Web Services (17%), and advertising services (9%), with international markets accounting for 22% of total revenue.