📦 AMZN $17M Call Bet - Smart Money Loading Up on Post-Capex Dip! 🚀
📅 February 17, 2026 | 🔥 Unusual Activity Detected
🎯 The Quick Take
Someone just dropped $17 MILLION on AMZN calls this morning at 11:57:48! This institutional buyer loaded up on 7,500 contracts of $190 strike calls expiring May 15th - betting on a 40%+ rally from current levels with Amazon down 20% from all-time highs following the controversial $200B capex announcement. With a Z-score of 5.05 (EXTREMELY UNUSUAL), this is the kind of trade that happens just a few times per year. Translation: Big money sees the post-earnings selloff as a buying opportunity!
📊 Company Overview
Amazon.com Inc (AMZN) is the world's largest e-commerce and cloud computing company:
- Market Cap: $2.13 Trillion (4th largest U.S. company)
- Industry: Retail - Catalog & Mail-Order Houses (SIC 5961)
- Current Price: $201.10 (down ~20% from ATH of $254)
- Employees: 1,576,000 worldwide
- Revenue Breakdown: ~74% retail, ~17% AWS, ~9% advertising
- Headquarters: Seattle, WA
- Homepage: amazon.com
Amazon dominates online retail with ~40% U.S. e-commerce market share while AWS leads cloud computing with ~31% global market share. The company is aggressively investing $200B in AI infrastructure for 2026.
💰 The Option Flow Breakdown
The Tape (February 17, 2026 @ 11:57:48):
| Time | Symbol | Side | Buy/Sell | Type | Expiration | Premium | Strike | Volume | OI | Size | Spot | Option Price |
|---|---|---|---|---|---|---|---|---|---|---|---|---|
| 11:57:48 | AMZN | ASK | BUY | CALL $190 | 2026-05-15 | $17M | $190 | 7.6K | 16K | 7,500 | $201.10 | $22.45 |
🤓 What This Actually Means
This is a bullish conviction bet on Amazon's recovery! Here's the breakdown:
- 💸 Massive premium paid: $17M ($22.45 per contract x 7,500 contracts)
- 📈 In-the-money strike: $190 is 5.5% below current price ($201.10) - already ITM with intrinsic value
- ⏰ Strategic timing: 87 days to expiration captures Q1 earnings (late April), Zoox commercial launch, and any capex sentiment recovery
- 📊 Size matters: 7,500 contracts = 750,000 shares worth ~$151M in notional exposure
- 🏦 BTO classification: Buy-to-Open means NEW long position, not closing an existing hedge
What's really happening here:
This trader is betting Amazon has bottomed after the brutal 20% selloff following Q4 earnings. The stock dropped from $254 to $198 in just 10 trading days on concerns about the $200B AI capex plan. But this buyer sees value - they're paying $22.45/share for $190 calls that give them upside exposure at a breakeven of ~$212.45. If Amazon recovers to analyst consensus targets around $280, these calls would be worth $90+ each (300%+ return).
Unusual Score: 🔥 EXTREME (Z-score: 5.05) - This is roughly 5 standard deviations above normal activity. We see trades this unusual only a handful of times per quarter. The volume-to-OI ratio of 0.47 (7,600/16,000) suggests this is adding to existing bullish positioning, not standalone speculation.
📈 Technical Setup / Chart Check-Up
YTD Performance Chart
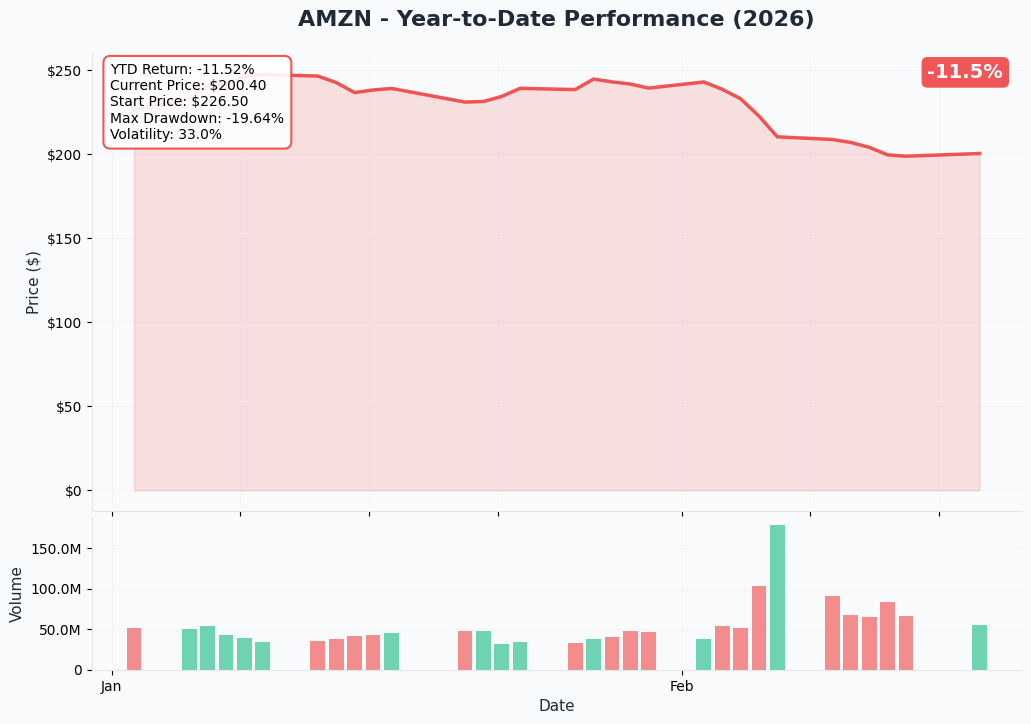
AMZN is having a rough start to 2026 - down ~10% YTD with current price of $201.10. The chart tells a story of a stock reeling from the February 5th earnings capex shock:
Key observations:
- 📉 Sharp selloff: 9 consecutive down days after earnings, dropping from $254 to $198 (22% decline)
- 🎢 Oversold bounce: Recent stabilization around $200 psychological support suggests selling exhaustion
- 📊 Volume surge: Elevated distribution volume during selloff indicating institutional repositioning
- 💔 Below key MAs: Trading under both 50-day and 200-day moving averages - technical weakness
- 📈 Potential bottom: RSI approaching oversold territory after extended decline
Gamma-Based Support & Resistance Analysis
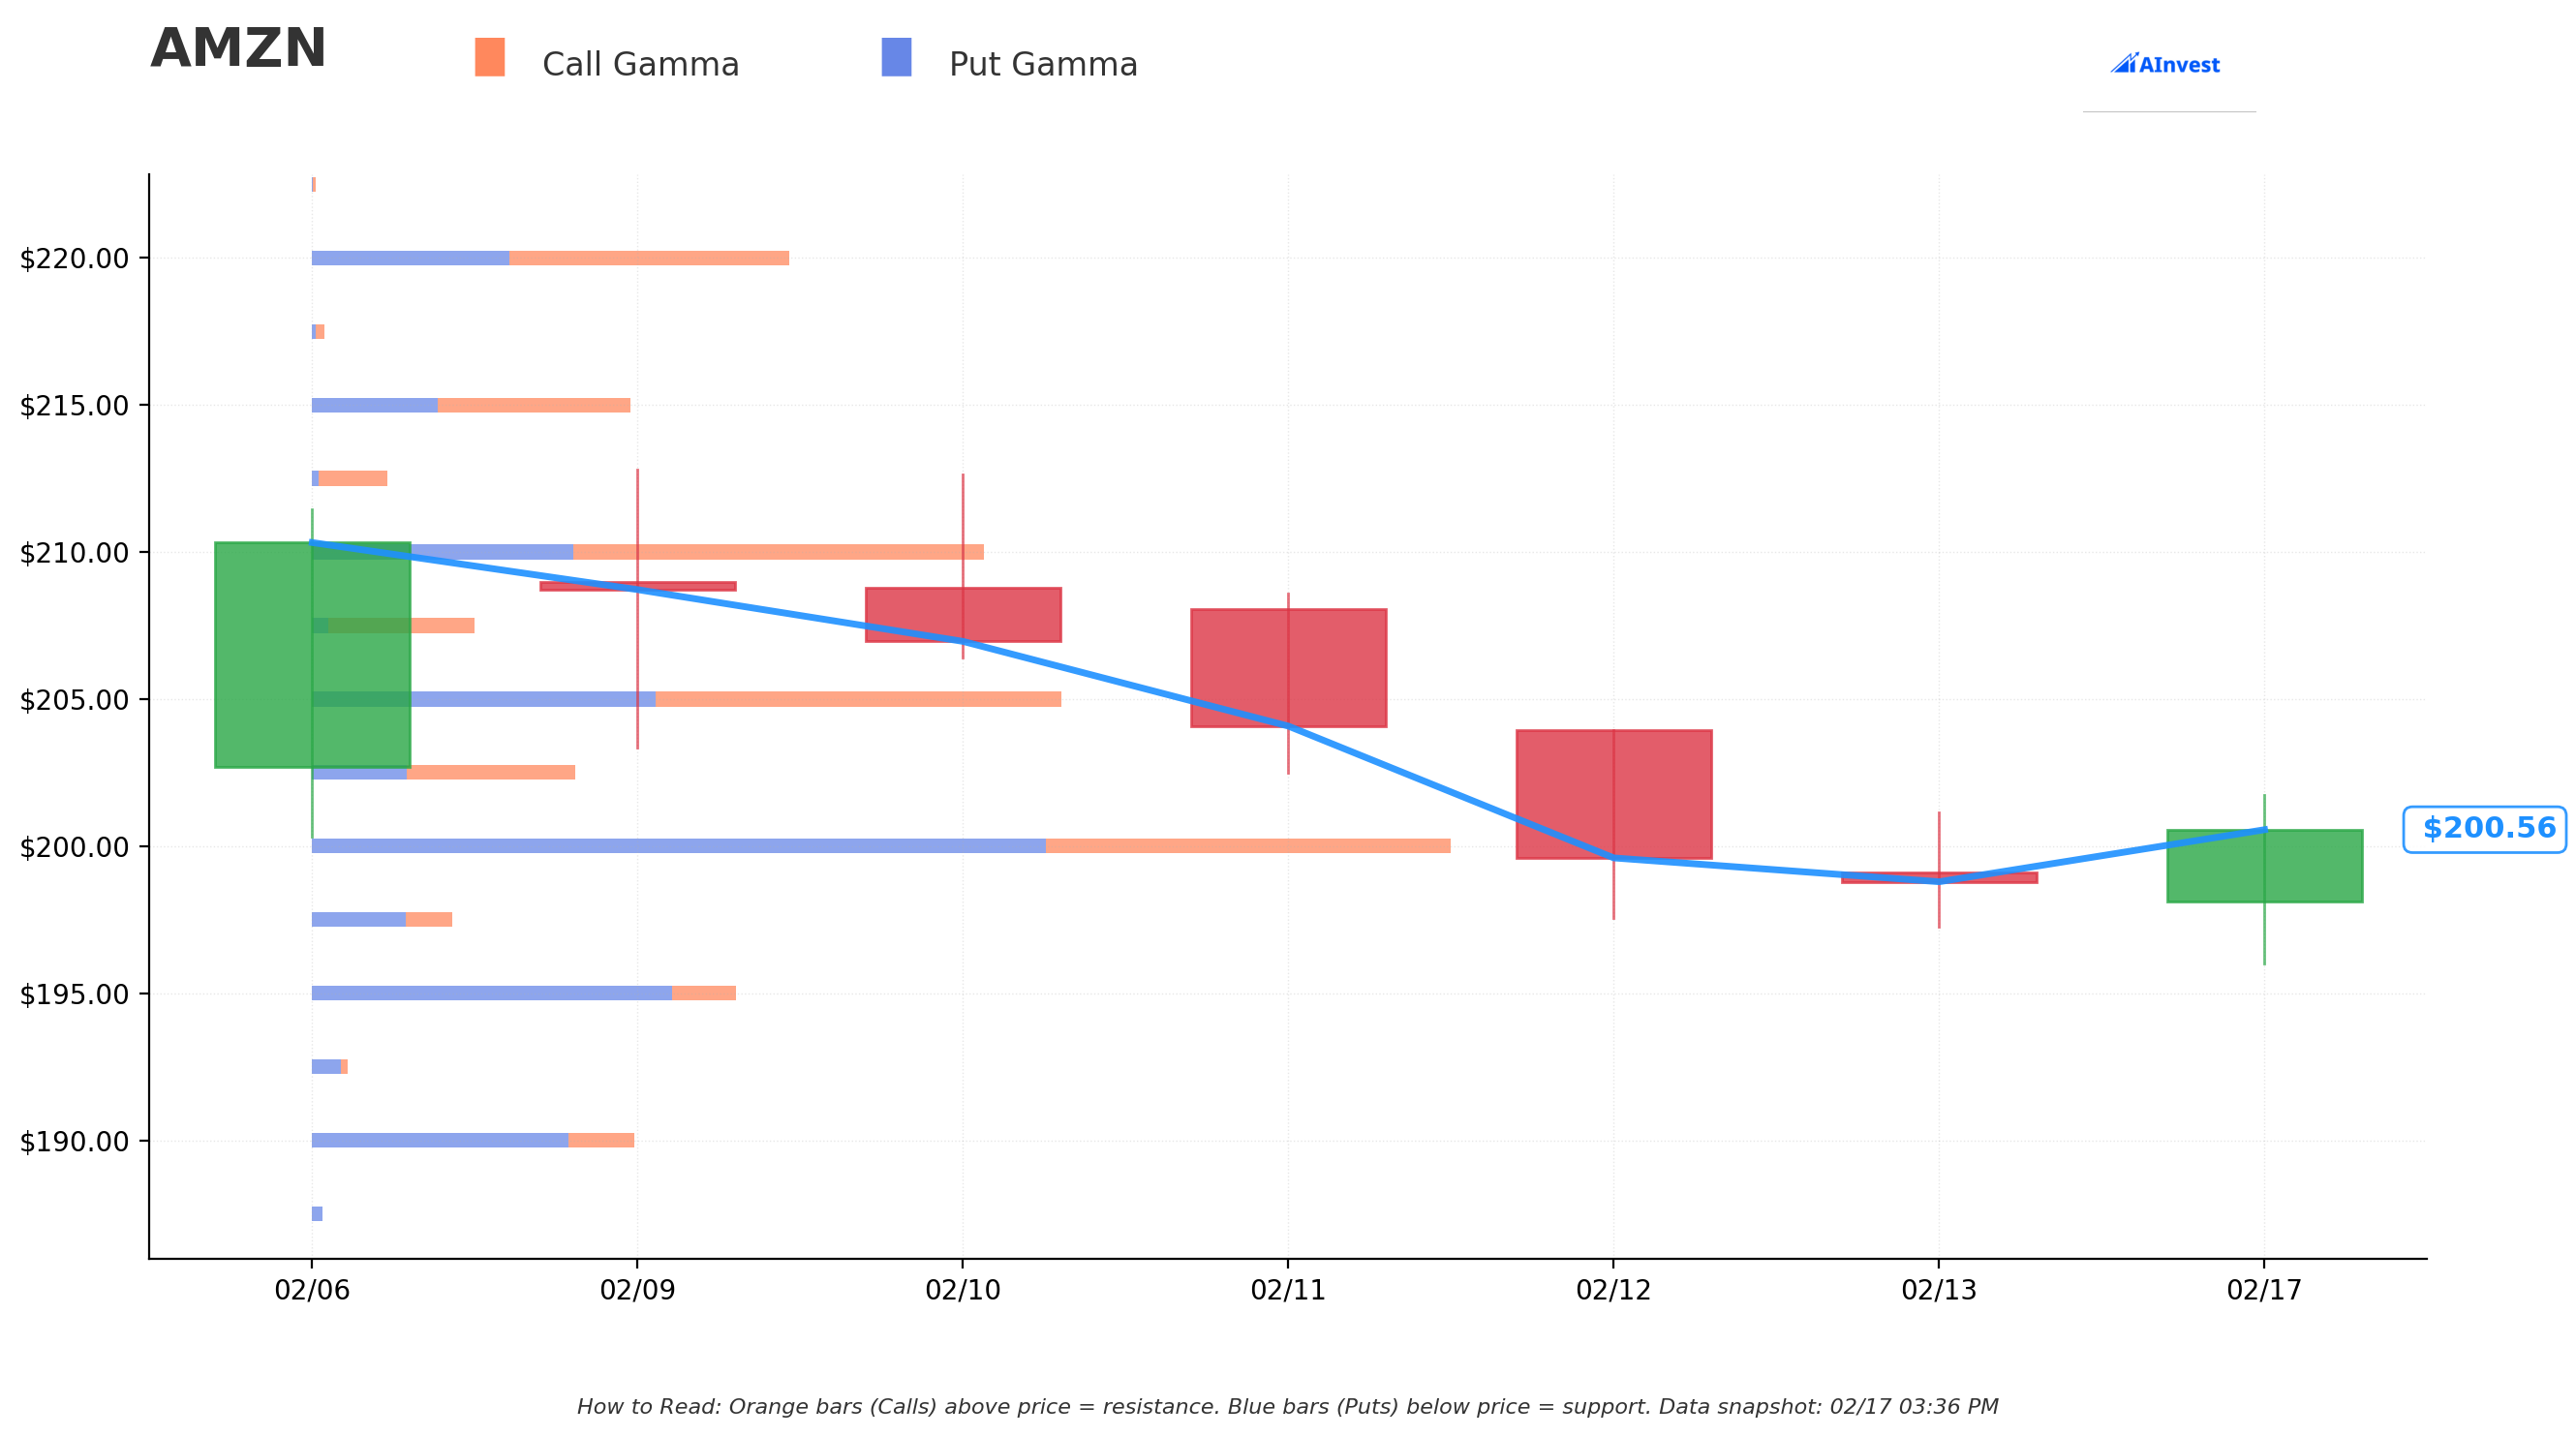
Current Price: $200.60
The gamma exposure map reveals critical price magnets and barriers:
🔵 Support Levels (Put Gamma Below Price):
- $200 - MAJOR floor with 117.5B total gamma (strongest support - we're sitting RIGHT here!)
- $195 - Secondary support with 44B gamma (2.8% below current)
- $190 - Deep support at 33.5B gamma (5.3% below) - THIS IS THE CALL STRIKE!
🟠 Resistance Levels (Call Gamma Above Price):
- $202.50 - Immediate ceiling with 26.9B gamma (0.9% above - first hurdle)
- $205 - Secondary resistance at 76.2B gamma (2.2% above)
- $210 - Major ceiling at 67.7B gamma (4.7% above)
- $215 - Extended resistance at 31.9B gamma (7.2% above)
- $220 - Significant barrier at 47.5B gamma (9.7% above)
- $230 - High gamma zone at 29.5B (14.7% above)
What this means for traders:
AMZN is sitting directly ON major $200 gamma support with 117.5B total gamma exposure - the single largest level on the board. This creates a natural floor where market makers will BUY dips aggressively to hedge their exposure. The call buyer struck at $190, positioned just below this massive support - they're betting the $200 level holds and stock rallies toward $210-$230 resistance zones.
Net GEX Bias: Bullish (394.3B call gamma vs 358.3B put gamma) - Overall positioning leans bullish, supporting the thesis that the selloff may be overdone.
Implied Move Analysis
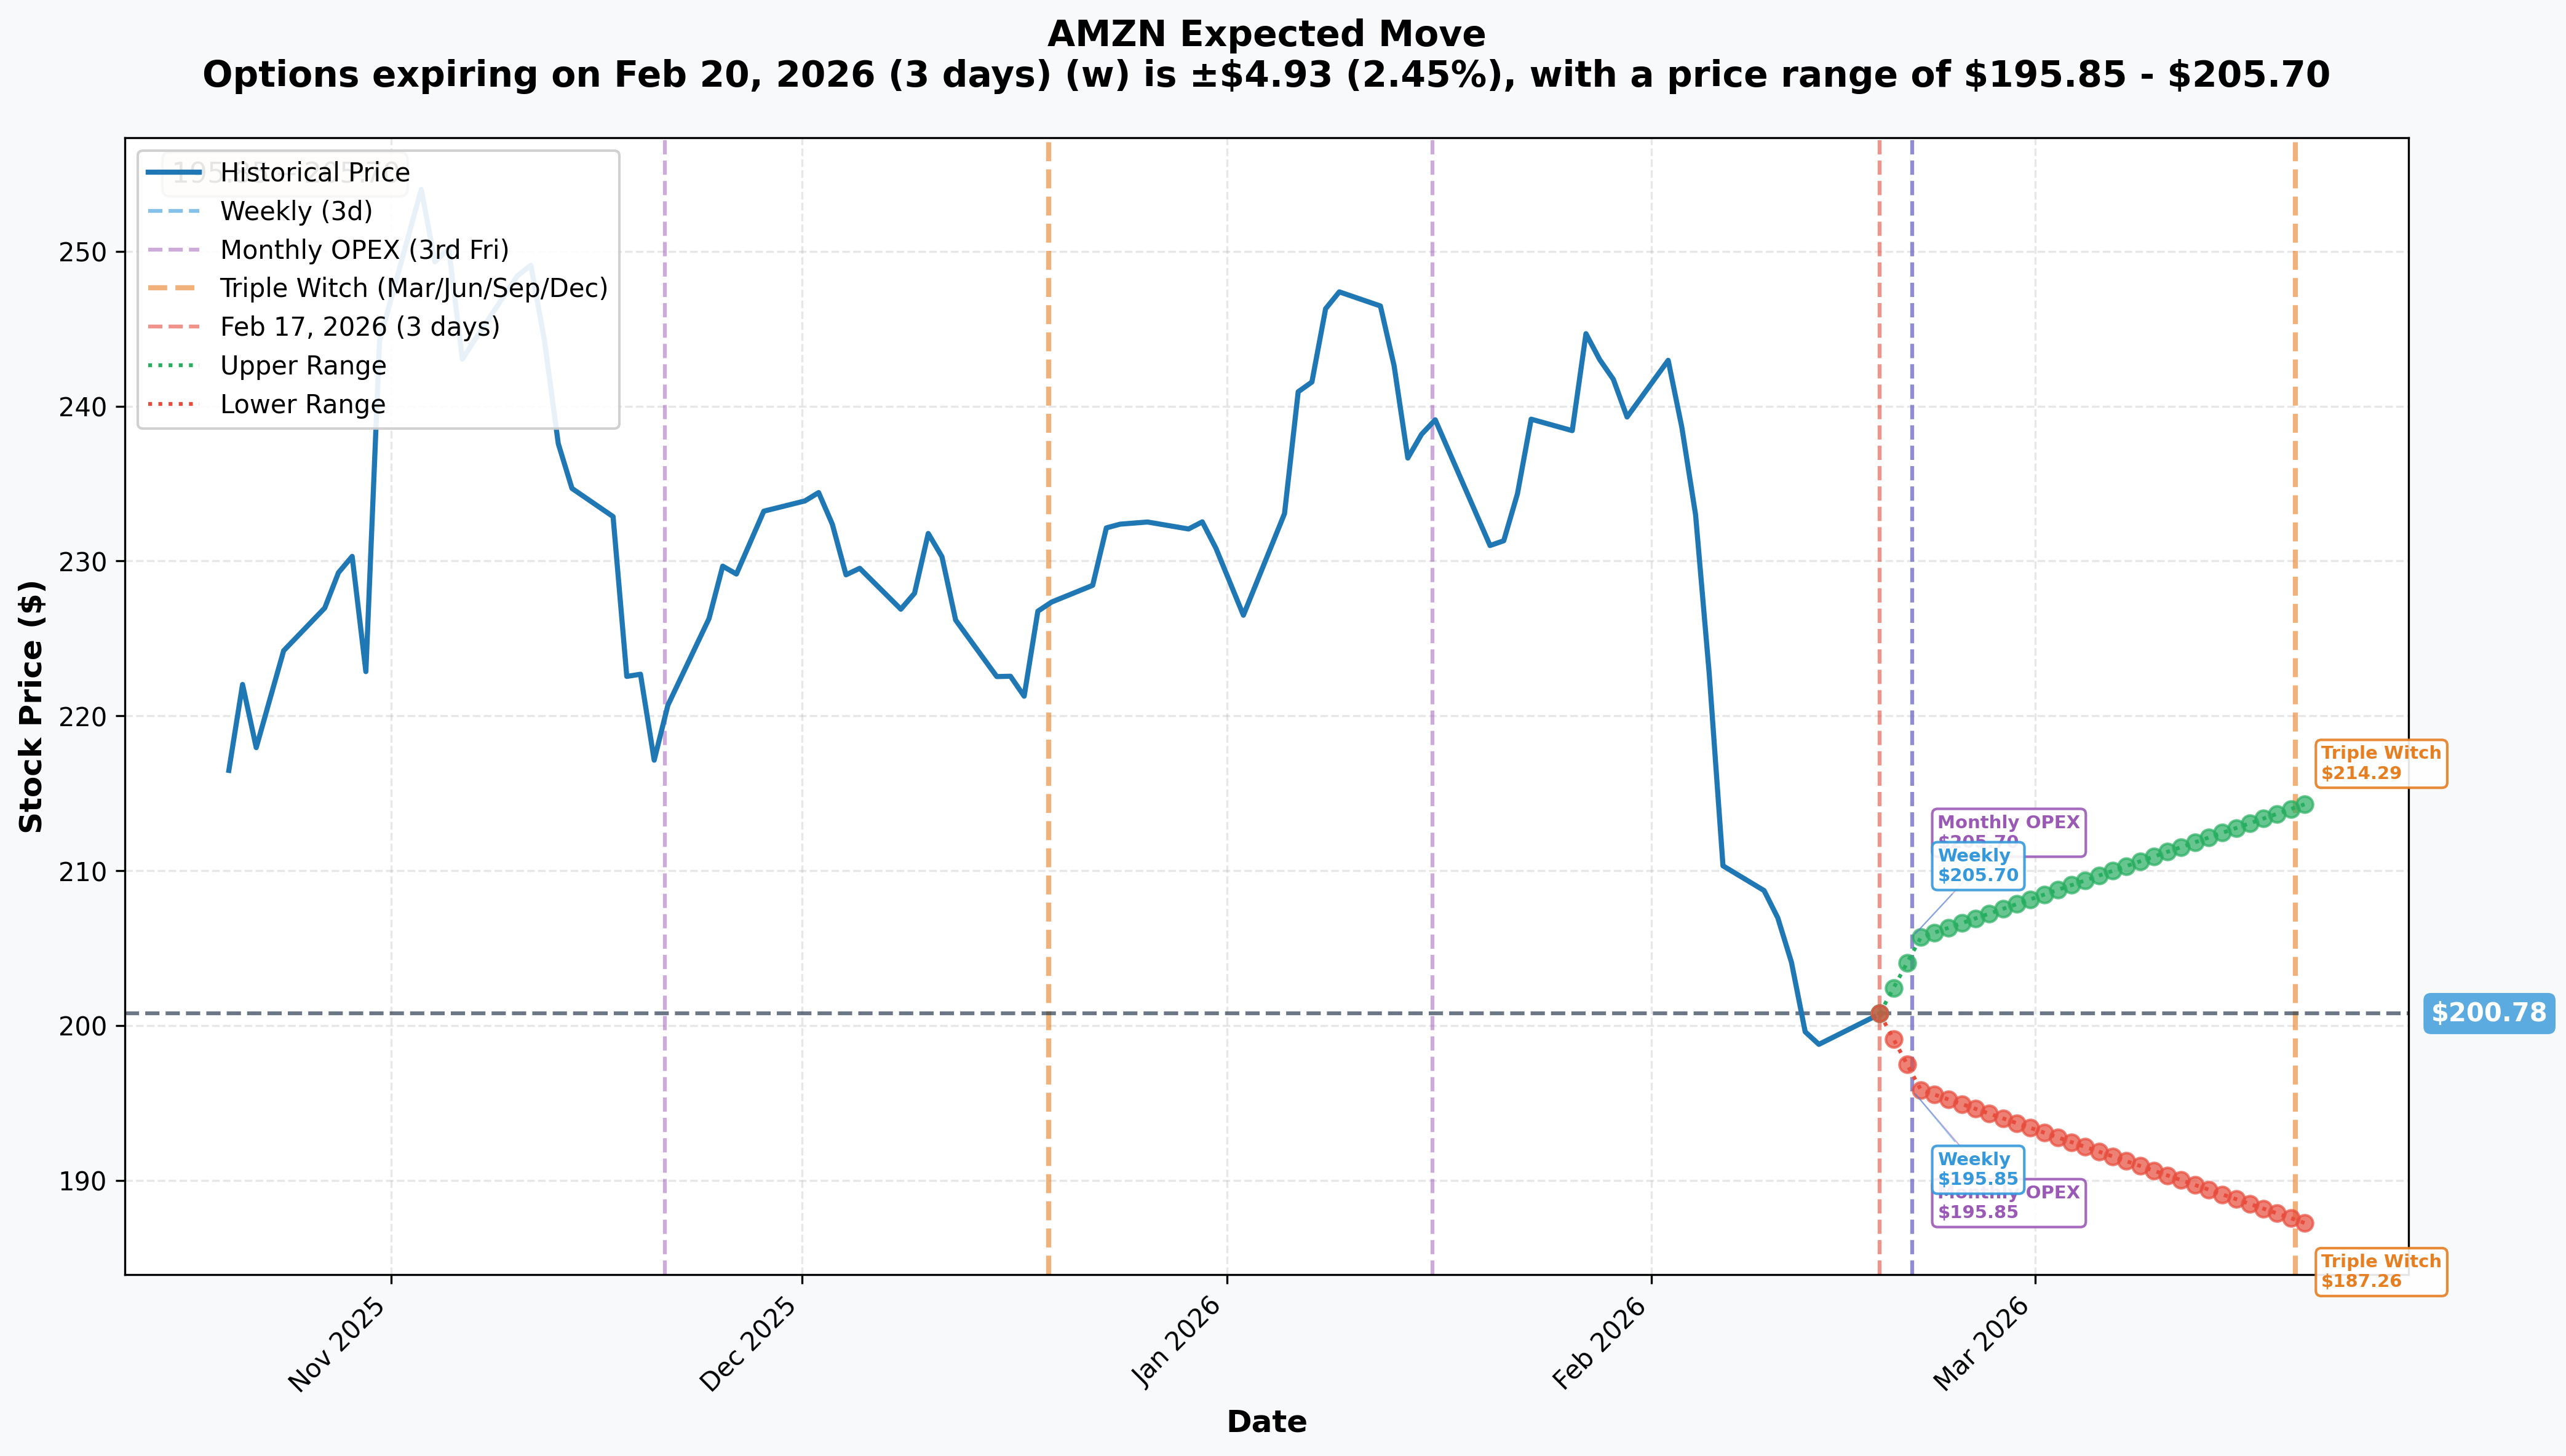
Options market pricing for upcoming expirations:
- 📅 Weekly (Feb 20 - 3 days): ±$4.93 (±2.45%) → Range: $195.85 - $205.70
- 📅 Monthly OPEX (Feb 20 - 3 days): ±$4.93 (±2.45%) → Range: $195.85 - $205.70
- 📅 Quarterly Triple Witch (Mar 20 - 31 days): ±$13.52 (±6.73%) → Range: $187.26 - $214.29
Translation for regular folks:
Options traders are pricing in a 2.45% move ($5) by this Friday's weekly expiration, but a more significant 6.7% move ($13.50) through March's quarterly expiration. The May 15th expiration where this $17M trade lands would see even wider expected ranges.
The current implied volatility reflects elevated uncertainty around Amazon's execution of the $200B capex plan. The call buyer is essentially saying: "I believe the selloff has overshot fundamentals and Amazon will recover toward fair value."
Key insight: The $190 strike being in-the-money with $11 intrinsic value shows this isn't a lottery ticket - it's a leveraged way to express a recovery view with some built-in protection.
🎪 Catalysts
🔥 Recent Catalysts (Already Happened)
Q4 2025 Earnings Results - February 5, 2026 📊
Amazon reported mixed Q4 results that triggered the massive selloff:
- 📊 Revenue: $213.39B vs $211.33B expected (beat) - up 14% YoY
- 💰 EPS: $1.95 vs $1.97 expected (slight miss)
- 🤖 AWS: $35.58B revenue, up 24% YoY - fastest growth in 13 quarters!
- 💸 2026 Capex Guidance: $200B AI infrastructure plan SHOCKED investors
- 📉 Stock Reaction: Shares dropped 10%+ in after-hours
Alexa+ AI Assistant U.S. Launch - February 4, 2026 🤖
- 💰 Pricing: $19.99/month standalone, FREE for Prime members
- 📈 Engagement: Music streams up 25%; recipe engagement up 5x
- 🎯 Competitive Position: Directly competes with ChatGPT Plus at same price point
Project Kuiper Satellite Launch - February 12, 2026 🛰️
- 🚀 LE-01 Mission: 32 satellites deployed via Ariane 64
- 🌐 Progress: Over 200 satellites now in orbit toward 3,236 target
📅 Upcoming Catalysts (Next 6 Months)
Q1 2026 Earnings - Expected April 23-30, 2026 📊
- 📊 Revenue Guidance: $173.5B - $178.5B (11-15% YoY growth)
- 💰 EPS Consensus: $1.66
- 🔑 Key Metrics: AWS growth sustainability, advertising trajectory, capex execution
Zoox Commercial Launch - H1 2026 🚗
- 🎰 Las Vegas: Paid rides expected early 2026
- 🏭 Capacity: Hayward facility targeting 10,000 robotaxis/year
- 🌎 Expansion: Austin and Miami planned for future rollout
Project Kuiper Service Launch - H1-H2 2026 🛰️
- 🌐 Q1 2026: Continuous coverage across US, UK, France, Germany, Canada
- ✈️ JetBlue Partnership: First airline to offer Amazon Leo in-flight Wi-Fi (2027)
- ⚠️ FCC Deadline Risk: Half of 1,618 satellites required by July 30, 2026
FTC Antitrust Trial - October 13, 2026 ⚖️
- 🔍 Allegations: Monopolization via pricing algorithms ("Project Nessie")
- 👥 Plaintiffs: FTC + 19 states/territories
- 💣 Risk: Potential behavioral modifications to structural separation
Prime Day 2026 - Expected July 2026 🛍️
Historically drives significant retail segment revenue spike
🎲 Price Targets & Probabilities
Using gamma levels, implied move data, and catalyst calendar, here are scenarios through May 15th expiration:
📈 Bull Case (30% probability)
Target: $230-$250
How we get there:
- 💪 Q1 earnings beat with AWS growth >25% validates AI infrastructure investment thesis
- 🤖 Zoox commercial launch generates positive headlines and future revenue optionality
- 📊 Analyst upgrades resume as capex concerns fade and revenue growth accelerates
- 🌐 Project Kuiper meets FCC milestones, derisking regulatory concerns
- 📈 Break above $210 gamma resistance triggers momentum toward $230 and analyst consensus ($279)
Call P&L in Bull Case:
- Stock at $230 at May 15: Calls worth $40, profit = $17.55/share (78% ROI)
- Stock at $250 at May 15: Calls worth $60, profit = $37.55/share (167% ROI)
Probability assessment: 30% because it requires sustained recovery sentiment, strong Q1 execution, and no new capex concerns. Analyst targets averaging $279 with 40%+ upside suggest Street sees fundamental value here.
🎯 Base Case (50% probability)
Target: $200-$220 range (GRADUAL RECOVERY)
Most likely scenario:
- ✅ Stock stabilizes at $200 gamma support after capitulation selling exhausts
- 📱 Q1 earnings roughly in-line with guidance ($173.5B-$178.5B)
- ⚖️ Capex concerns persist but don't worsen; stock trades sideways with upward bias
- 🤖 Zoox/Kuiper progress steady but not spectacular
- 🔄 Trading between $200 support and $210-220 resistance through May
- 📊 Volatility compression as uncertainty fades
Call P&L in Base Case:
- Stock at $210 at May 15: Calls worth $20, loss = -$2.45/share (-11% ROI)
- Stock at $220 at May 15: Calls worth $30, profit = $7.55/share (34% ROI)
Why 50% probability: Amazon's fundamentals remain strong (AWS 24% growth, advertising margins, Prime ecosystem). The selloff appears driven by capex sticker shock rather than business deterioration. Analyst consensus of $279 (40%+ upside) suggests significant undervaluation at current levels.
📉 Bear Case (20% probability)
Target: $175-$195 (FURTHER SELLOFF)
What could go wrong:
- 😰 Q1 earnings miss or guidance cut citing macro weakness
- 🚨 FTC trial concerns intensify as October approaches
- ⏰ Kuiper misses FCC July deadline, raising regulatory risk
- 🇨🇳 AWS growth decelerates below 20% on competition from Azure/GCP
- 💸 Broader market correction drags mega-cap tech lower
- 🔨 Break below $195 gamma support triggers cascade to $190, then $180
Call P&L in Bear Case:
- Stock at $190 at May 15: Calls worth $0-$5, loss = -$17.45 to -$22.45/share (78-100% loss)
- Stock at $175 at May 15: Calls expire worthless, total loss of $17M
Probability assessment: 20% because it requires multiple negative catalysts. Amazon's diversified business (retail, AWS, advertising) provides resilience. The $200 gamma support with 117.5B exposure creates strong buying pressure.
💡 Trading Ideas
🛡️ Conservative: Wait for Confirmation
"Sleep Well Strategy"
Play: Stay on sidelines until clear technical breakout above $210
Why this works:
- ⏰ Stock still in downtrend from $254 - fighting momentum is risky
- 💸 Options relatively expensive due to recent volatility - better prices ahead if trend reverses
- 📊 $200 support may hold or may break - let the market decide
- 🎯 Post-Q1 earnings (late April) provides cleaner entry with updated guidance
- 🤔 The $17M institutional call buy is smart money, but they can afford to be early
Action plan:
- 👀 Watch for break above $210 with volume - first sign of trend reversal
- 🎯 Look for May or June calls at $210-$220 strikes AFTER breakout confirmed
- ✅ Need to see: AWS growth >22%, advertising momentum, capex execution updates
- 📊 Monitor gamma levels - shift from put-heavy to call-heavy bias would confirm bottoming
Risk level: Minimal (cash position) | Skill level: Beginner-friendly
⚖️ Balanced: May Call Spread
"Recovery Play with Defined Risk"
Play: Buy May $200 calls, Sell May $230 calls
Structure: $200/$230 call spread - 87 days to expiration
Why this works:
- 🎯 Defines risk while capturing recovery upside
- 📊 Max risk = spread cost (
$12-14), max profit = $30 width minus cost ($16-18) - 🎢 $230 target aligns with upper gamma resistance zone
- ⏰ Captures Q1 earnings catalyst (late April)
- 🛡️ More capital-efficient than outright call purchase
Estimated P&L:
- 💰 Pay ~$12-14 per spread
- 📈 Max profit at $230+: ~$16-18 (115-130% ROI)
- 📉 Max loss: ~$12-14 if stock below $200 at expiration
- 🎯 Breakeven: ~$212-214
Position sizing: Risk 3-5% of portfolio max
Risk level: Moderate (defined risk, directional) | Skill level: Intermediate
🚀 Aggressive: Follow the Whale
"Copy the $17M Bet"
Play: Buy May $190 calls (same trade as institutional flow)
Structure: Outright call purchase at $22-23 per contract
Why this could work:
- 🐋 Following $17M institutional conviction bet
- 📈 In-the-money with $11 intrinsic provides some downside buffer
- 🚀 Unlimited upside if recovery thesis plays out
- 📊 87 days captures multiple catalysts
- 💪 Strong analyst support with $279 average price target (40%+ upside)
Why this could blow up (SERIOUS RISKS):
- 💸 EXPENSIVE: $2,245 per contract is significant capital at risk
- ⏰ TIME DECAY: Theta burns ~$10-15/day per contract
- 📉 Momentum risk: Stock still in technical downtrend
- 😱 Binary earnings: Q1 results could disappoint
- ⚠️ Concentration: Single-stock directional bet
Estimated P&L:
- 💰 Cost: ~$22.45 per contract
- 📈 Stock at $230: Profit ~$17.55 (78% ROI)
- 📈 Stock at $250: Profit ~$37.55 (167% ROI)
- 📉 Stock at $195: Loss ~$17.45 (-78%)
- 💀 Stock below $190: Total loss (100%)
Position sizing: Risk only 2-3% of portfolio - this is high conviction speculation
Risk level: HIGH (unlimited upside, significant downside) | Skill level: Advanced
⚠️ Risk Factors
Don't get caught by these potential landmines:
-
💸 $200B Capex Shock Still Fresh: The February 5th earnings capex announcement triggered a 20% selloff that may not be finished. Investors are concerned about free cash flow compression and years of investment before AI returns materialize. This capex plan represents roughly 40% of Amazon's current market cap committed over one year - unprecedented scale.
-
⚖️ FTC Antitrust Trial Looms (October 2026): The FTC lawsuit alleging monopolistic practices via "Project Nessie" pricing algorithms creates a regulatory overhang. Worst case involves structural separation of business units. This trial falls within months of the call expiration and could impact sentiment significantly. The $2.5B Prime subscription settlement sets precedent for further enforcement.
-
🛰️ Project Kuiper FCC Deadline Risk: Amazon must deploy half of 3,236 satellites by July 30, 2026 or risk losing spectrum licenses. With just 200 satellites currently in orbit, this is an aggressive timeline. Any extension request or missed deadline could generate negative headlines.
-
🤖 AWS Market Share Erosion: While AWS grew 24% YoY, market share has declined from 33% (2021) to 31% (2026). Microsoft Azure (growing faster at 21% YoY) and Google Cloud continue gaining ground. AI-native competitors like CoreWeave are capturing GPU-intensive workloads.
-
🚗 Zoox Execution Risk: The robotaxi subsidiary is significantly behind Waymo which already has 450,000 weekly paid rides. Regulatory approvals for commercial service remain pending. Any safety incidents could set back the entire program.
-
📉 Technical Weakness: Stock trading below both 50-day and 200-day moving averages indicates technical downtrend. While $200 gamma support looks solid, a decisive break below could trigger momentum selling toward $190-$180 levels.
-
🏪 Retail Competition: Walmart is growing e-commerce 27% YoY vs Amazon's 9.6% with physical store advantages for same-day delivery. The retail moat may be narrower than investors assume.
-
💰 Valuation Still Premium: Even after 20% selloff, Amazon trades at ~40x forward earnings with $200B capex commitment. Any further disappointment in AWS growth or retail margins could trigger additional multiple compression.
🎯 The Bottom Line
Real talk: Someone just bet $17 MILLION that Amazon has bottomed after the brutal post-earnings selloff. This isn't a hedge or closing trade - it's a BUY-TO-OPEN new position with conviction that the stock recovers to $212+ by mid-May (breakeven).
What this trade tells us:
- 🎯 Sophisticated player sees the 20% selloff as overdone relative to fundamentals
- 💰 They're willing to pay $22.45/share for upside exposure rather than buy stock outright (leverage)
- ⚖️ The $190 ITM strike provides some cushion - they're not betting on a moonshot, just recovery to fair value
- 📊 87 days captures Q1 earnings, Zoox launch, and potential sentiment recovery
- 🤝 Analyst consensus of $279 (+40% upside) supports the thesis
This IS a bullish signal - but not an "all clear" signal.
If you're bullish on AMZN:
- ✅ Consider call spreads ($200/$230 May) to define risk while capturing upside
- 📊 Watch for technical confirmation: break above $210 with volume signals trend reversal
- ⏰ Q1 earnings (late April) is the next major catalyst - expect volatility around that date
- 🎯 If you're buying calls outright, position size conservatively (2-3% max portfolio risk)
- 🛡️ Set mental stop at $190 gamma support - if that breaks, thesis is challenged
If you're watching from sidelines:
- ⏰ Wait for $210+ breakout confirmation before initiating long positions
- 🎯 Post-Q1 earnings provides cleaner entry with updated capex execution guidance
- 📈 Analyst targets averaging $279 (40% upside) suggest significant value IF execution delivers
- ⚠️ Current 9-day losing streak may have more to run - catching falling knives is dangerous
- 🤔 The $17M institutional buy is compelling, but institutions can afford to be early
If you're bearish:
- 🎯 Don't short into massive $200 gamma support (117.5B) - that's fighting the market makers
- 📊 Wait for break BELOW $195 to confirm downtrend continuation
- ⚠️ Put spreads ($200/$190 May) offer defined-risk bearish expression
- 📉 Target $175-$180 if $190 support breaks
Mark your calendar - Key dates:
- 📅 February 20 - Weekly/Monthly OPEX (±2.45% implied move)
- 📅 March 20 - Quarterly Triple Witch (±6.73% implied move)
- 📅 April 23-30 (Est.) - Q1 2026 earnings report
- 📅 May 15 - Call expiration ($17M trade settles)
- 📅 July 2026 - Prime Day 2026
- 📅 July 30 - Project Kuiper FCC satellite deadline
- 📅 October 13 - FTC antitrust trial begins
Final verdict: Amazon's long-term fundamentals remain compelling - AWS growth reaccelerating to 24%, advertising business printing money ($90B+ projected 2026), and multiple emerging businesses (Zoox, Kuiper, Alexa+) providing optionality. BUT, the $200B capex commitment creates near-term uncertainty that may take quarters to resolve. The $17M institutional call buy signals smart money sees value at $200, but patient investors might get better entries if the technical weakness continues.
The Z-score of 5.05 means this is an unusually large and confident bet - roughly 5 standard deviations above normal activity. We see trades this size only a few times per quarter.
Be patient. Follow the technicals. Don't fight the trend until it confirms reversal. 💪
Disclaimer: Options trading involves substantial risk of loss and is not suitable for all investors. This analysis is for educational purposes only and not financial advice. Past performance doesn't guarantee future results. The Z-score of 5.05 reflects this specific trade's unusual size relative to recent AMZN history - it does not imply the trade will be profitable or that you should follow it. Always do your own research and consider consulting a licensed financial advisor before trading. Amazon faces significant regulatory, competitive, and execution risks that could impact stock performance.
About Amazon.com Inc: Amazon.com Inc operates as the world's largest online retailer and cloud computing provider through Amazon Web Services (AWS), with a market cap of $2.13 trillion in the Retail - Catalog & Mail-Order Houses industry. The company also has significant positions in advertising, streaming (Prime Video), smart devices (Alexa), and emerging businesses including robotaxis (Zoox) and satellite internet (Project Kuiper).