🛒 AMZN $14M Call Sale - Institutional Player Caps Upside on Amazon After 22% Drawdown!
📅 March 2, 2026 | 🔥 Unusual Activity Detected
🎯 The Quick Take
Someone just sold $14 MILLION worth of Amazon $190 calls expiring May 15th, collecting premium while the stock trades at $208.62 - down 22% from its November highs. This is a sell-to-open short call, meaning a sophisticated trader is betting AMZN stays below $217 (strike + premium) through mid-May. With a massive $200B capex plan rattling investors and tariff uncertainty lingering, this institutional player is selling the rip and collecting income on a stock that's been struggling to find its footing.
📊 Company Overview
Amazon.com, Inc. (AMZN) is the world's largest online retailer and cloud computing provider through AWS:
- Market Cap: $2.25 Trillion
- Industry: Internet & Direct Marketing Retail / Cloud Infrastructure
- Exchange: NASDAQ
- Current Price: $208.62 (down ~22% from ATH of $258.60)
- Primary Business: E-Commerce, AWS Cloud, Advertising, Prime Video, Alexa AI
💰 The Option Flow Breakdown
The Tape (March 2, 2026 @ 10:47:04):
| Time | Symbol | Side | Buy/Sell | Call/Put | Expiration | Premium | Strike | Volume | OI | Size | Spot | Option Price | Option Symbol |
|---|---|---|---|---|---|---|---|---|---|---|---|---|---|
| 10:47:04 | AMZN | BID | SELL | CALL | 2026-05-15 | $14M | $190 | 5K | 23K | 5,000 | $208.62 | $27.00 | AMZN20260515C190 |
🤓 What This Actually Means
This is a sell-to-open (STO) short call - a classic income-generating strategy! Here's the breakdown:
- 💸 Premium collected: $14M ($27.00 per contract x 5,000 contracts)
- 🎯 In-the-money by $18.62: $190 strike with AMZN trading at $208.62 means the option has $18.62 of intrinsic value
- ⏰ Time value: $8.38 of extrinsic value remaining with 74 days to expiration
- 📊 Position size: 5,000 contracts = 500,000 shares worth ~$104M notional exposure
- 🏦 Institutional footprint: Vol/OI ratio of 0.217 on 23K open interest - this is a deliberate, measured position
What's really happening here:
This trader is either (a) selling covered calls against an existing AMZN stock position to generate income during this choppy period, or (b) taking a naked short call position betting Amazon stays range-bound through mid-May. The $190 strike is already $18.62 in the money, so the seller needs AMZN to stay below $217 (breakeven = $190 + $27 premium) to keep the full premium. If they own the shares, they're fine with being called away at $190 + $27 = $217 effective sale price.
Unusual Score: 🔥 HIGHLY UNUSUAL (Z-Score: 2.93) - This kind of trade shows up only a few times per quarter. The 5,000-contract clip on the BID side confirms aggressive selling intent, not a passive market-making fill.
📈 Technical Setup / Chart Check-Up
YTD Performance Chart
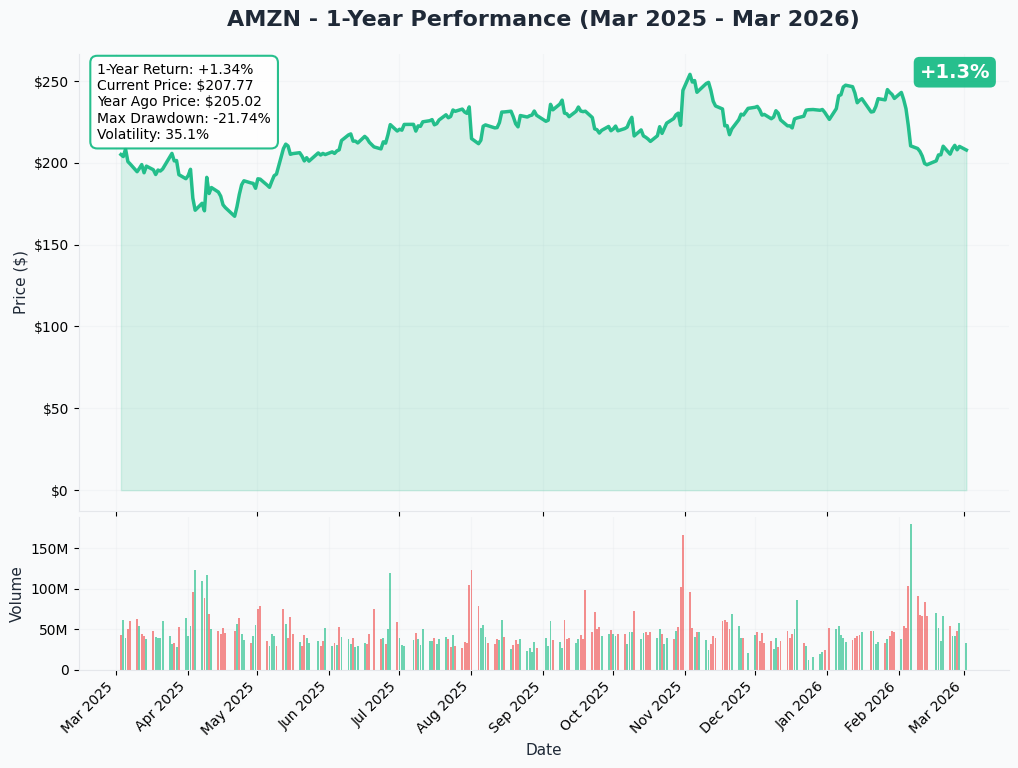
Amazon is down roughly 13% YTD in 2026, falling from ~$231 at the start of the year to $208.62 today. The chart tells a painful story - after reaching an all-time high of $258.60 in November 2025, AMZN has been in a persistent downtrend, including a brutal 9-day losing streak in February that wiped out more than $450 billion in market value.
Key observations:
- 📉 Downtrend intact: Lower highs and lower lows since November 2025
- 💹 $200 psychological support: Stock has bounced around the $200-$210 zone recently
- 🎢 Elevated volatility: The 9-day losing streak was the worst since 2006
- 📊 Bouncing off lows: The SCOTUS tariff ruling on February 20 gave a ~3% relief bounce, but momentum remains fragile
Implied Move Analysis
Options market pricing for upcoming expirations:
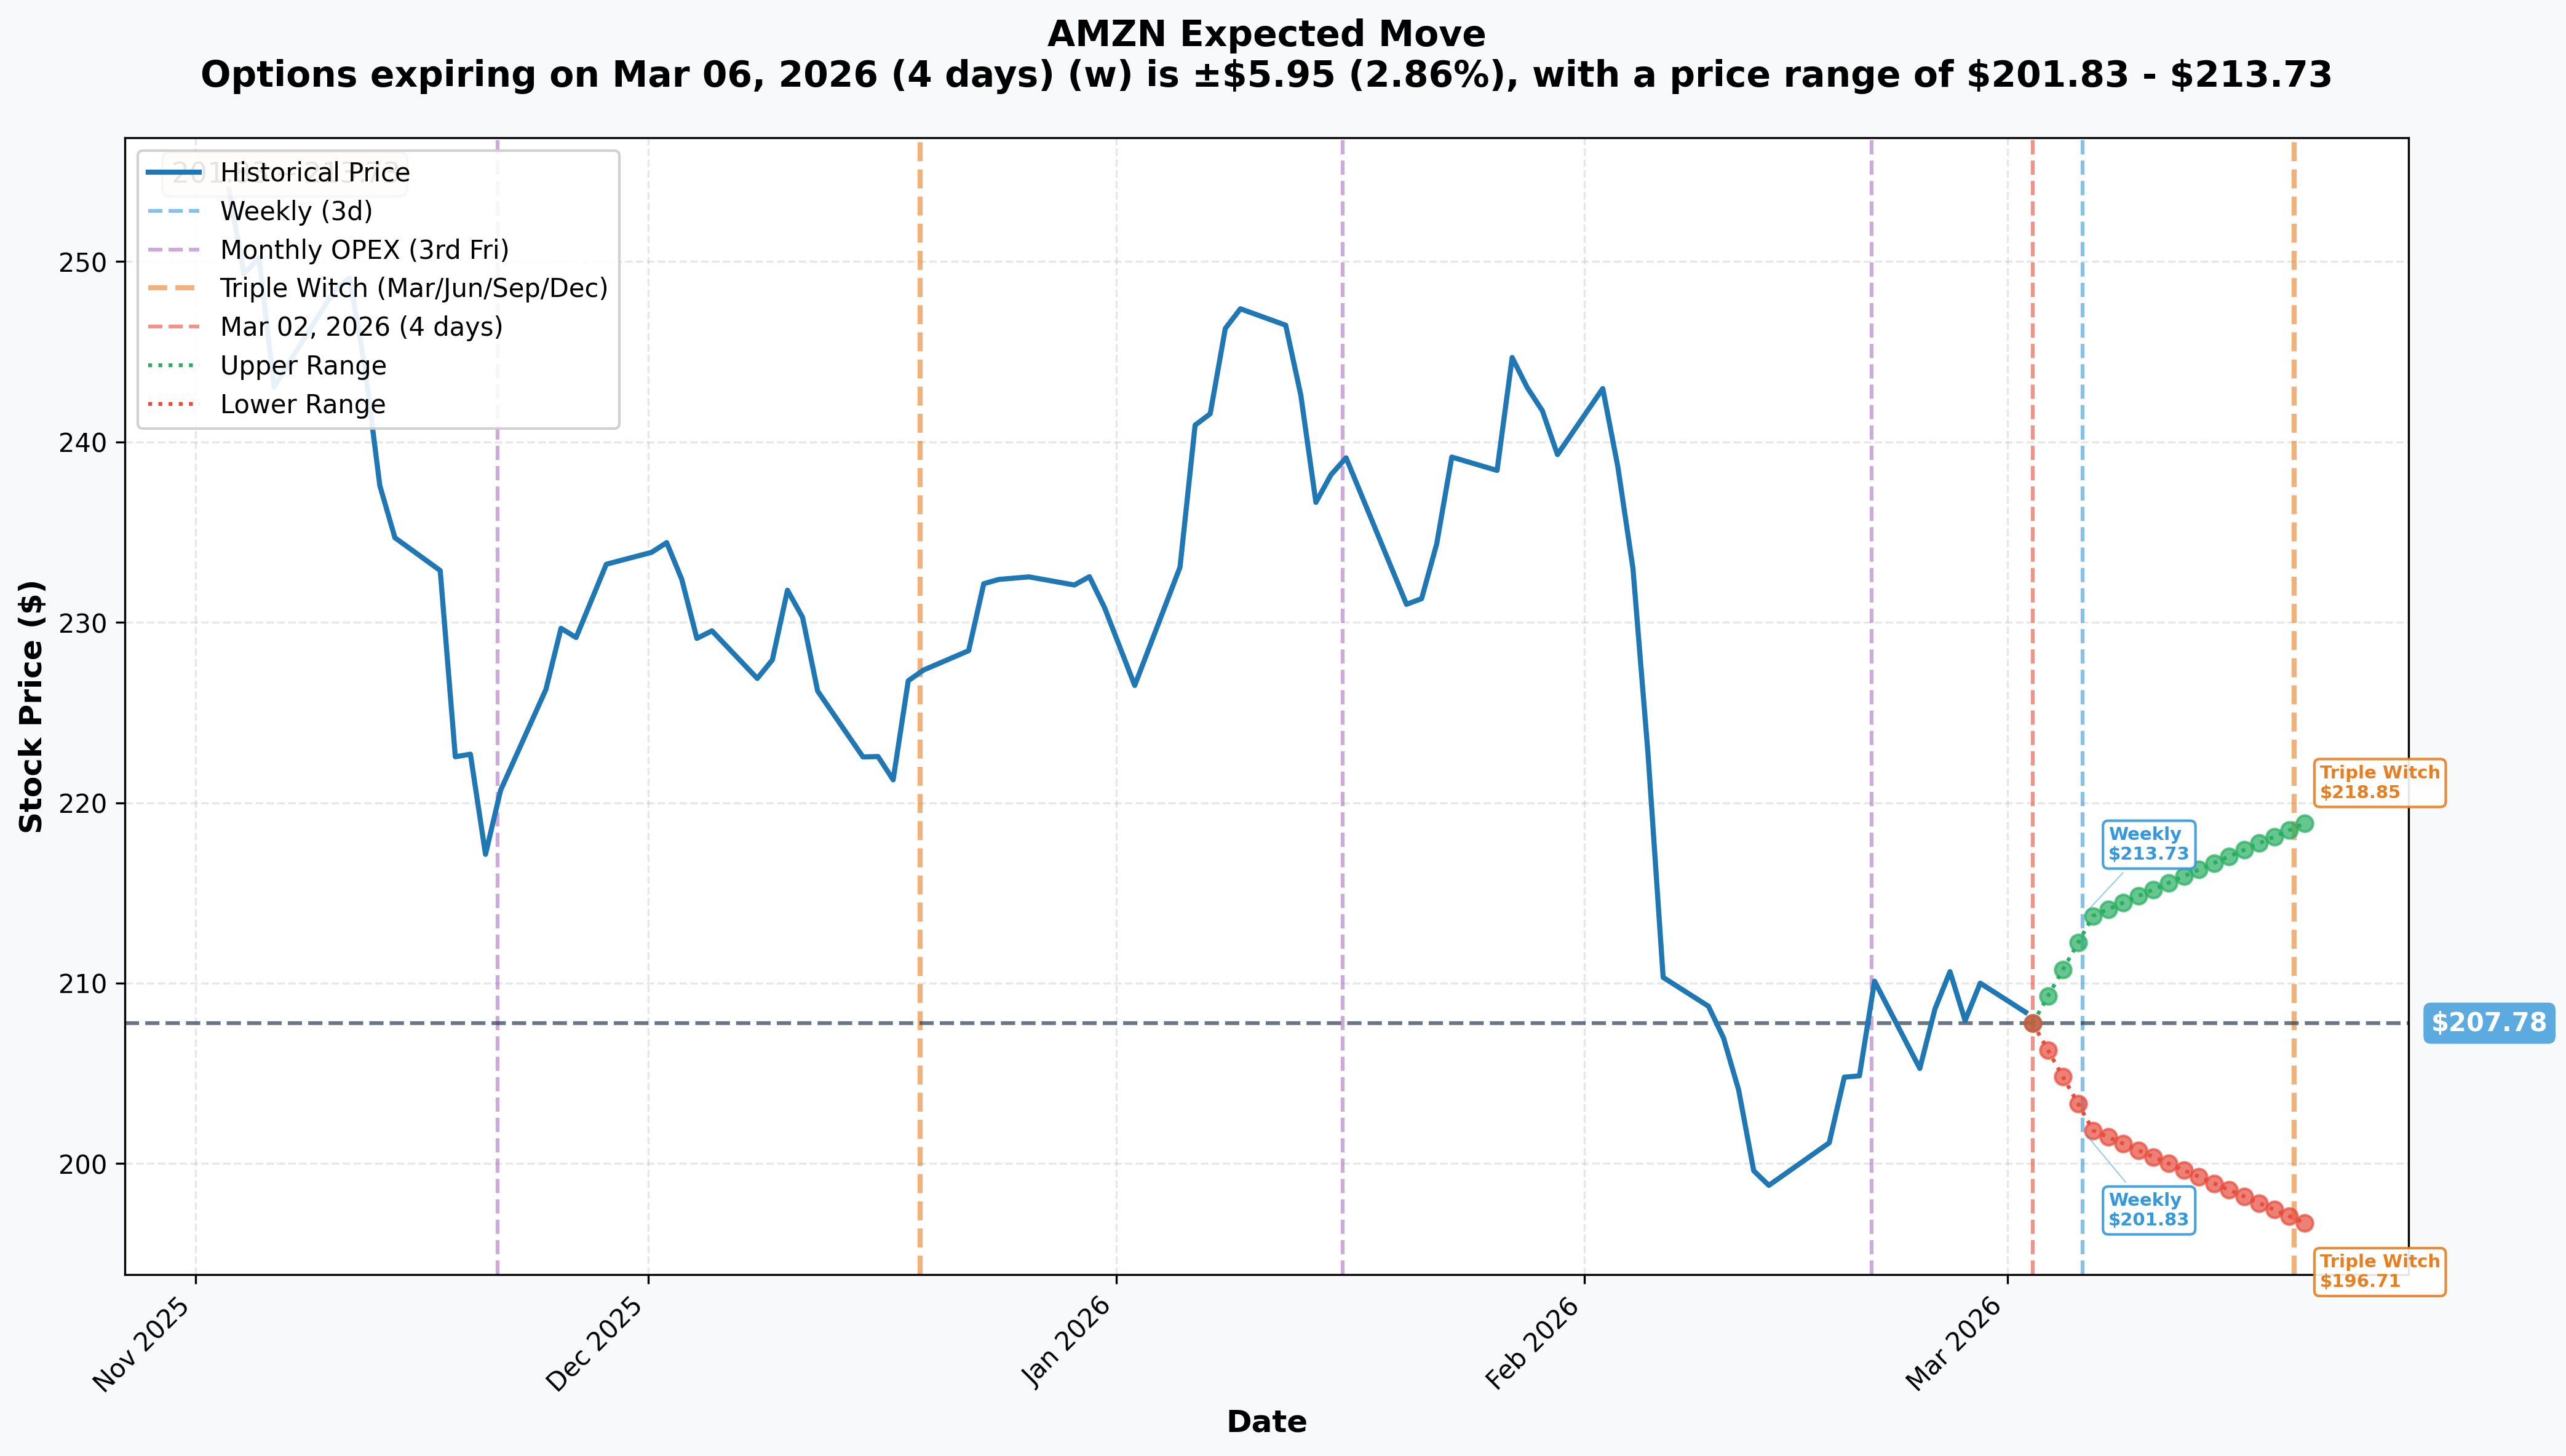
- 📅 Weekly (Mar 6 - 4 days): +/-$5.95 (+/-2.86%) --> Range: $201.83 - $213.73
- 📅 Monthly OPEX / Triple Witch (Mar 20 - 18 days): +/-$11.07 (+/-5.33%) --> Range: $196.71 - $218.85
Translation for regular folks:
Options traders are pricing in a 2.86% move ($6) by Friday and a 5.33% move ($11) through March expiration. That's fairly standard for a mega-cap tech stock, but the downside range ($196.71) breaks below the critical $200 psychological level. The implied move tells us the market expects AMZN to trade roughly between $197 and $219 over the next three weeks.
For this specific trade (May 15 expiration), the breakeven at $217 sits right near the upper end of the monthly implied range ($218.85). This seller is essentially betting the stock doesn't break out above current implied move ceilings by mid-May. Smart positioning.
Gamma-Based Support & Resistance Analysis
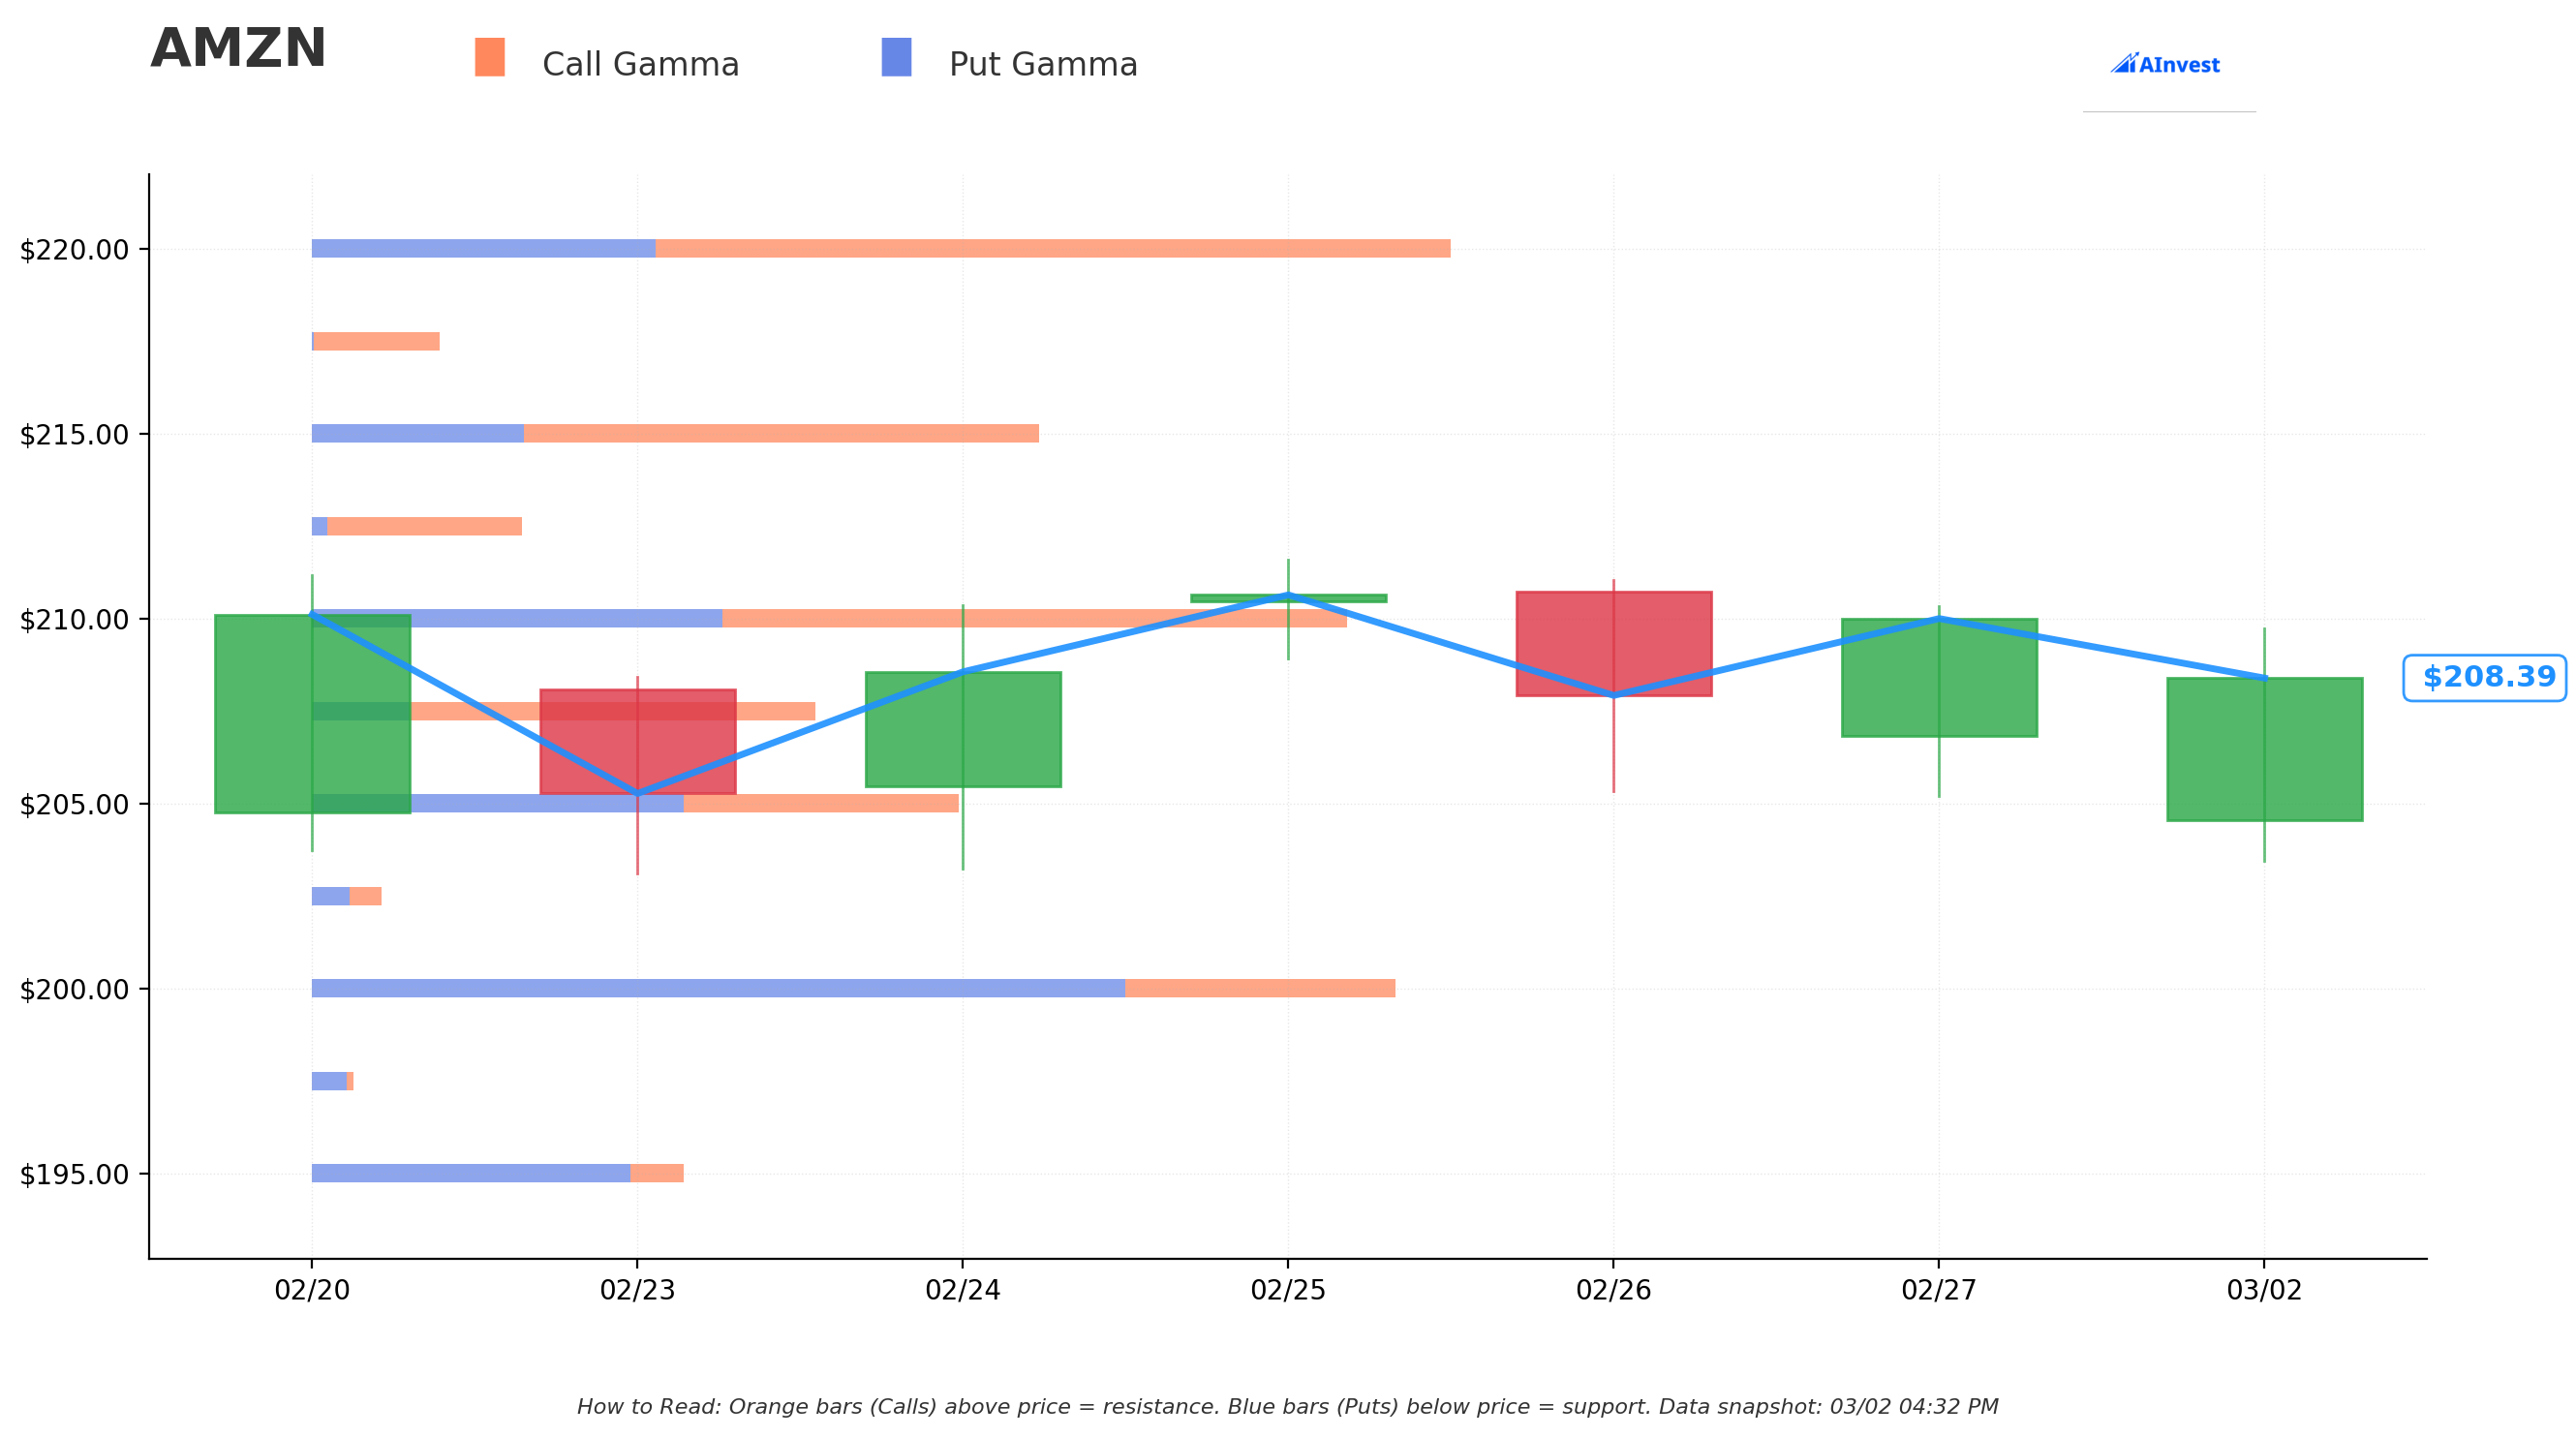
Note: Gamma exposure data is limited for AMZN today. Based on the implied move and recent price action, here are the key levels to watch:
🔵 Support Levels:
- $200 - Major psychological and technical floor; defended during the February sell-off
- $197 - Implied move lower bound for March OPEX
- $190 - The short call strike level; also where the seller's maximum loss starts accelerating
🟠 Resistance Levels:
- $214 - Implied move upper bound for weekly expiration
- $219 - Implied move upper bound for March OPEX
- $217 - Breakeven on this short call trade (strike + premium)
What this means for traders: The $200-$210 zone has been a consolidation range after the brutal February sell-off. The short call seller is positioning right in this "stuck" zone - collecting premium while Amazon figures out its direction. If AMZN breaks above $219, this trade starts losing money. If it stays below $217, the seller keeps the full $14M.
🎪 Catalysts
🔥 Upcoming Catalysts
OpenAI Investment Closing - March 31, 2026 💰
Amazon's $15 billion initial tranche of its $50 billion OpenAI investment is due by month-end. This is part of OpenAI's massive $110 billion funding round at a $730B pre-money valuation. AWS becomes the exclusive third-party cloud provider for OpenAI Frontier, and OpenAI committed to consuming 2 gigawatts of Trainium capacity. Confirmation of this closing could be a positive catalyst - or any hiccups could add uncertainty.
Q1 2026 Earnings - Expected Late April 2026 📊
Amazon's next earnings report is expected around April 23-30, 2026. Key metrics to watch:
- 📊 AWS revenue growth rate (can it sustain 24%+ acceleration?)
- 💸 Capex run rate vs. $200B annual target
- 🤖 Alexa+ adoption metrics and monetization progress
- ⚖️ Tariff impact on North America retail margins
- 💰 Consensus EPS: $1.62
Amazon Leo / Project Kuiper Commercial Launch - Q1-Q2 2026 🛰️
Satellite broadband service expected to launch in 5 markets (US, UK, Canada, France, Germany) by end of Q1 2026. Constellation now over 200 satellites in orbit with 20+ launches planned for 2026.
March 20 - Triple Witch OPEX 📅
Major options expiration could create elevated volatility and large hedging flows. The implied move prices a $197-$219 range through this date.
NBA Playoffs on Prime Video - April-June 2026 🏀
First playoff season under Amazon's $1.8B/year NBA deal could drive Prime subscriber growth and advertising uplift.
⏪ Recent Catalysts (Already Happened)
Q4 2025 Earnings Beat (February 5, 2026): Revenue of $213.4B (+14% YoY) beat estimates, but EPS of $1.95 missed by $0.02, and the $200B capex guidance (vs. $146.6B expected) spooked investors. AWS grew 24%, its fastest in 13 quarters, with a $244B backlog.
Amazon-OpenAI $50B Partnership (February 27, 2026): Landmark strategic partnership announced with $15B initial investment, making AWS the exclusive third-party cloud distribution provider for OpenAI.
Supreme Court Tariff Ruling (February 20, 2026): SCOTUS ruled 6-3 that Trump's IEEPA tariffs were unconstitutional, giving AMZN a ~3% bounce. However, Trump's administration imposed a new 10% global tariff starting February 24, maintaining uncertainty.
30,000 Layoffs (October 2025 - January 2026): Amazon's largest workforce reduction in company history, driven by generative AI enabling leaner operations. Separations continuing through May 2026.
DA Davidson Downgrade (February 6, 2026): Downgraded from Buy to Neutral with target slashed from $300 to $175, citing AWS "losing its lead" and "scrambling to catch up through escalating investment."
🎲 Price Targets & Probabilities
Using implied move data, recent price action, and upcoming catalysts:
📈 Bull Case (25% probability)
Target: $230-$250
How we get there:
- 🤝 OpenAI investment closes smoothly by March 31, market cheers the AI partnership validation
- 📊 Q1 earnings show AWS maintaining 24%+ growth with better-than-feared capex efficiency
- 🛰️ Project Kuiper commercial launch generates excitement about new revenue streams
- ⚖️ Tariff situation stabilizes, Amazon CEO Jassy's thesis that Amazon gains share under tariffs plays out
- 📈 Analyst consensus of $280-$297 targets (35-45% upside) starts pulling price higher
- 💪 Stock breaks above $219 implied move ceiling, triggering short covering and dealer hedging flows
Key risk to bulls: The $200B capex plan remains a massive overhang. Even with great execution, investors may not re-rate until they see returns on that investment.
Impact on the trade: This is where the short call seller loses money. Above $217, losses start mounting. The seller clearly doesn't think this scenario plays out by May.
🎯 Base Case (50% probability)
Target: $195-$215 range-bound
Most likely scenario:
- ✅ OpenAI investment closes without drama but doesn't meaningfully move the stock
- 📱 Alexa+ adoption is lukewarm - some user backlash from auto-enrollment continues
- ⚖️ Tariff uncertainty keeps retail margins under pressure (Jassy warned costs are "creeping into prices")
- 📊 Market waits for Q1 earnings to assess capex trajectory and AWS momentum
- 🔄 Stock consolidates in the $200-$215 band, digesting the February sell-off
This is the trade's sweet spot: AMZN stays range-bound, the call seller keeps most or all of the $14M premium. With the stock at $208 and the breakeven at $217, the seller has $8+ of cushion before losing money.
📉 Bear Case (25% probability)
Target: $175-$195
What could go wrong:
- 😰 Q1 earnings disappoint - AWS growth decelerates, capex run rate concerns intensify
- 📉 DA Davidson's $175 target and "AWS losing its lead" thesis gains traction among other analysts
- ⚖️ Tariff situation escalates beyond 10% global tariff, consumer spending drops with estimated $1,500/household impact
- 💸 $200B capex crushes free cash flow ($11.2B TTM FCF vs. $200B planned spend) - market questions capital discipline
- 🤖 AI spending ROI concerns spread across tech sector, causing broader rotation
- 🛡️ $200 support breaks: A decisive break below the psychological $200 level could trigger cascading selling down to implied move support at $197
Impact on the trade: Great for the short call seller - if AMZN drops to $190 (the strike), the option goes to parity and the seller keeps the full $8.38 of time value. Below $190, the call expires worthless and the seller keeps the entire $14M.
💡 Trading Ideas
🛡️ Conservative: The "Collect While You Wait" Covered Call
Play: If you own AMZN shares, sell May 15 $220 calls to generate income while the stock consolidates
Why this works:
- 💰 Follows the institutional playbook - collect premium while stock finds its footing
- 📊 $220 strike is above the monthly implied move ceiling ($218.85), giving room for modest upside
- ⏰ 74 days of theta decay working in your favor
- 🛡️ 96% of analysts have Buy ratings with $280+ targets - you still own the stock for the long-term recovery
- 📉 Premium collected provides downside cushion if stock drifts lower
Estimated P&L:
- 💰 Collect ~$5-7 per contract (~2.5-3.5% yield on stock position)
- 📈 Called away at effective price of $225-$227 (~8-9% above current price) - a good exit
- 📉 Breakeven lowered to $201-$203 with premium cushion
Risk level: Low (you already own the stock) | Skill level: Beginner-friendly
⚖️ Balanced: The "Earnings Setup" Put Spread
Play: Sell April put spread to collect premium before Q1 earnings (late April)
Structure: Sell $200 puts / Buy $190 puts (April 17 expiration, before earnings)
Why this works:
- 🎯 $200 is the established support floor from February's sell-off
- 📊 $190 strike matches the big institutional trade, suggesting significant interest at that level
- ⏰ 46 days of time decay, expires before earnings uncertainty
- 💰 Collect ~$2.50-3.50 per spread (~25-35% of width)
- 🛡️ Defined risk: Max loss $10 per spread minus premium collected
Estimated P&L:
- 💰 Max profit: ~$250-350 per spread if AMZN stays above $200
- 📉 Max loss: ~$650-750 per spread if AMZN below $190 at expiration
- 🎯 Breakeven: ~$197 (near the implied move lower bound)
Risk level: Moderate (defined risk) | Skill level: Intermediate
🚀 Aggressive: The "Bounce Back" Call Diagonal
Play: Buy a longer-dated call and sell a shorter-dated call to finance it
Structure: Buy July $210 calls / Sell April $220 calls
Why this works:
- 📈 Analyst consensus of $280-$297 targets implies 35-45% upside from current levels
- 🤝 OpenAI closing (March 31) and Q1 earnings (late April) are catalysts that could re-rate the stock
- 💰 Short April call defrays cost of long July call, reducing breakeven
- 📊 You're positioned for the recovery while the short call generates income
- 🛰️ Project Kuiper launch and NBA playoffs on Prime Video provide additional catalysts through summer
Why this could go wrong:
- 💥 If AMZN drops below $200 and stays there, the long call loses significant value
- 📉 If stock rallies past $220 before April, you're capped on gains until the short call expires
- ⚠️ Diagonal spreads have complex Greek profiles - vega and theta work differently on each leg
Estimated P&L:
- 💰 Net debit: ~$8-10 per spread
- 📈 Max upside after April expiration: significant if AMZN recovers toward $230-$250 by July
- 📉 Max loss: Net premium paid (~$800-1,000 per spread) if AMZN collapses below $200
- 🎯 Sweet spot: AMZN at $215-$220 at April expiration, then rallies into summer
Risk level: High (directional bet on recovery) | Skill level: Advanced
⚠️ Risk Factors
Don't get caught by these potential landmines:
-
💸 $200B capex plan crushing free cash flow: Amazon's planned capital expenditure dwarfs its $139.5B TTM operating cash flow and compresses free cash flow to just $11.2B. If AI demand growth disappoints or returns take longer than expected, this massive investment could weigh on the stock for quarters.
-
⚖️ Tariff uncertainty far from resolved: Despite the SCOTUS ruling against Trump's IEEPA tariffs, the administration imposed a new 10% global tariff starting February 24. Tariffs are estimated to increase average U.S. household costs by $1,500 in 2026, which directly pressures consumer spending on Amazon's platform.
-
📉 AWS market share gradually eroding: AWS share has declined from ~33% to ~30% as Microsoft Azure and Google Cloud gain ground, particularly in AI workloads. DA Davidson's downgrade warning that AWS is "scrambling to catch up" could prove prescient if the OpenAI partnership doesn't deliver competitive advantages quickly enough.
-
🤖 OpenAI deal execution risk: The $50B commitment involves complex contingent triggers and co-development of a "Stateful Runtime Environment." If integration stumbles or OpenAI shifts priorities, Amazon is locked into massive capital commitments without guaranteed returns.
-
📊 Tech sector rotation underway: Investors are increasingly questioning AI spending ROI across the sector. Amazon's 9-day losing streak in February was part of a broader rotation out of big-cap tech spending stories. This sector headwind could persist regardless of Amazon-specific fundamentals.
-
🏛️ FTC antitrust trial looming: While the bench trial has been pushed to February 2027, pre-trial motions and discovery developments through 2026 could create headline risk and uncertainty about potential remedies that could restructure marketplace operations.
-
🤖 Alexa+ monetization unproven: Despite the U.S. launch in February, user backlash from auto-enrollment raises questions about willingness-to-pay for AI assistant features. At $19.99/month for non-Prime users, adoption could disappoint.
🎯 The Bottom Line
Real talk: A sophisticated trader just collected $14M selling May calls on Amazon, and honestly, you can see why. The stock is in no-man's land - down 22% from highs with a $200B capex plan hanging over it, but still has 96% Buy ratings from analysts who see 35-45% upside. This short call seller is playing the waiting game, getting paid to be patient while the market figures out if Amazon's massive AI bet will pay off.
What this trade tells us:
- 🎯 Institutional money doesn't expect a sharp recovery before mid-May
- 💰 The seller is comfortable with the $190-$217 range for the next 74 days
- ⚖️ Risk/reward favors premium sellers in this sideways-to-down environment
- 📊 The $190 strike acts as a magnet - significant institutional interest at that level
If you own AMZN:
- ✅ Consider selling covered calls to generate income while the stock consolidates (follow the institutional playbook)
- 📊 96% analyst Buy rating with $280-$297 average target suggests long-term upside remains intact
- 🛡️ Watch $200 support carefully - a break below could trigger the next leg down toward $190
- ⏰ Key dates: OpenAI close March 31, Q1 earnings late April - these will determine direction
- 💪 The OpenAI partnership, AWS 24% growth with $244B backlog, and $69B advertising business are all legitimate reasons to hold
If you're watching from the sidelines:
- 🎯 A pullback to $195-$200 (near implied move support) would be an attractive entry point
- 📊 Wait for Q1 earnings clarity on capex execution before making big bets
- 🤝 The OpenAI closing on March 31 is the next binary event - watch for confirmation
- 💡 The most widely held equity among hedge funds in 2026 - institutional conviction remains high despite the drawdown
If you're bearish:
- 📉 The $200B capex overhang and tariff uncertainty are legitimate headwinds
- 🎯 DA Davidson's $175 target represents the worst-case scenario from a credible analyst
- ⚠️ Bear put spreads ($200/$190) offer defined-risk downside plays
- ⏰ Wait for a bounce to $215+ before initiating - fighting gravity at $208 is less ideal than selling rallies
Mark your calendar - Key dates:
- 📅 March 6 (Friday) - Weekly options expiration (implied range: $202-$214)
- 📅 March 20 - Triple Witch OPEX (implied range: $197-$219)
- 📅 March 31 - OpenAI $15B investment closing deadline
- 📅 Late April (est. April 23-30) - Q1 2026 earnings report
- 📅 May 15 - Expiration of this $14M short call trade
- 📅 Q2 2026 - Project Kuiper commercial service launch in 5 markets
Final verdict: This $14M short call tells a clear story: smart money thinks Amazon's recovery is going to take time. With a $200B capex plan, tariff headwinds, and the stock still digesting a 22% drawdown, the premium-selling strategy makes sense. Don't fight the trend - if you're bullish long-term (and the analyst consensus says you should be), use this consolidation period to sell premium and accumulate shares on dips toward $195-$200. The catalysts are there (OpenAI, Kuiper, AWS growth), but they need time to play out. Patience pays - literally, in the form of options premium.
Disclaimer: Options trading involves substantial risk of loss and is not suitable for all investors. This analysis is for educational purposes only and not financial advice. Past performance doesn't guarantee future results. The Z-Score of 2.93 reflects this specific trade's unusualness relative to recent activity - it does not imply the trade will be profitable or that you should follow it. Always do your own research and consider consulting a licensed financial advisor before trading.
About Amazon.com, Inc.: Amazon is the world's largest online retailer and cloud computing provider with a $2.25 trillion market cap, operating across e-commerce, AWS cloud infrastructure, digital advertising, and entertainment through Prime Video and Alexa AI.