🔌 APH $1.4M Put Bet - Someone's Not Buying the Post-Earnings Dip! 🐻
📅 January 30, 2026 | 🔥 Unusual Activity Detected
🎯 The Quick Take
A trader just dropped $1.4 MILLION on APH puts today at 11:55:50! They bought 1,500 contracts of $140 strike puts expiring May 15th - a straight-up bearish bet on Amphenol just two days after the stock cratered ~14% on earnings. With APH already bleeding from $157 highs down to $148, this trader is saying "the pain isn't over yet." The volume-to-open-interest ratio is a jaw-dropping 41.7x - this is someone opening a brand new position with conviction. Translation: While Wall Street analysts are raising price targets, this trader is betting APH has more room to fall.
📊 Company Overview
Amphenol Corporation (APH) is a global powerhouse in connectors, sensors, and interconnect systems - basically the plumbing that makes everything from data centers to fighter jets work:
- Market Cap: $183.1 Billion
- Industry: Electronic Connectors
- Current Price: ~$148.06
- Primary Business: Connectors, sensors, and interconnect systems for IT/data centers, automotive, defense, industrial, broadband, and mobile markets
- Key Position: Second-largest connector manufacturer globally with ~33% share in AI datacom connectivity
💰 The Option Flow Breakdown
The Tape (January 30, 2026 @ 11:55:50):
| Time | Symbol | Side | Buy/Sell | Type | Expiration | Premium | Strike | Volume | OI | Size | Spot | Option Price |
|---|---|---|---|---|---|---|---|---|---|---|---|---|
| 11:55:50 | APH | ASK | BUY | PUT $140 | 2026-05-15 | $1.4M | $140 | 1,500 | 36 | 1,500 | $148.06 | $9.50 |
🤓 What This Actually Means
This is a directional bearish bet - not a hedge. Here's the breakdown:
- 💸 Premium paid: $1.4M ($9.50 per contract x 1,500 contracts)
- 🎯 Strike price: $140 is 5.4% below the current price of $148.06
- 📉 Breakeven at expiration: $130.50 (needs ~12% drop from current levels to profit)
- ⏰ Time horizon: 105 days to expiration (through May 15th) - captures Q1 2026 earnings in late April
- 📊 Position size: 1,500 contracts = 150,000 shares worth ~$22.2M in notional exposure
- 🆕 Brand new position: Only 36 contracts of open interest existed before this trade - this is 41.7x the existing OI!
What's really happening here: This trader is looking at APH after the post-earnings sell-off and saying "the selling isn't done." They're paying $9.50 per share for May $140 puts, which means they need the stock below $130.50 to profit at expiration. That's another 12% decline from here. Given that APH just reported record results and still got hammered 14%, this trader may be betting that organic growth deceleration fears and CommScope integration headwinds will continue to pressure the stock through Q1 earnings season.
Unusual Score: 🔥 EXTREMELY UNUSUAL - The 41.7x volume-to-OI ratio means this trade dwarfs all existing positioning at this strike. When someone builds a position this aggressively against near-zero open interest, they're making a deliberate, high-conviction directional bet. This isn't portfolio shuffling - this is a statement.
📈 Technical Setup / Chart Check-Up
YTD Performance Chart
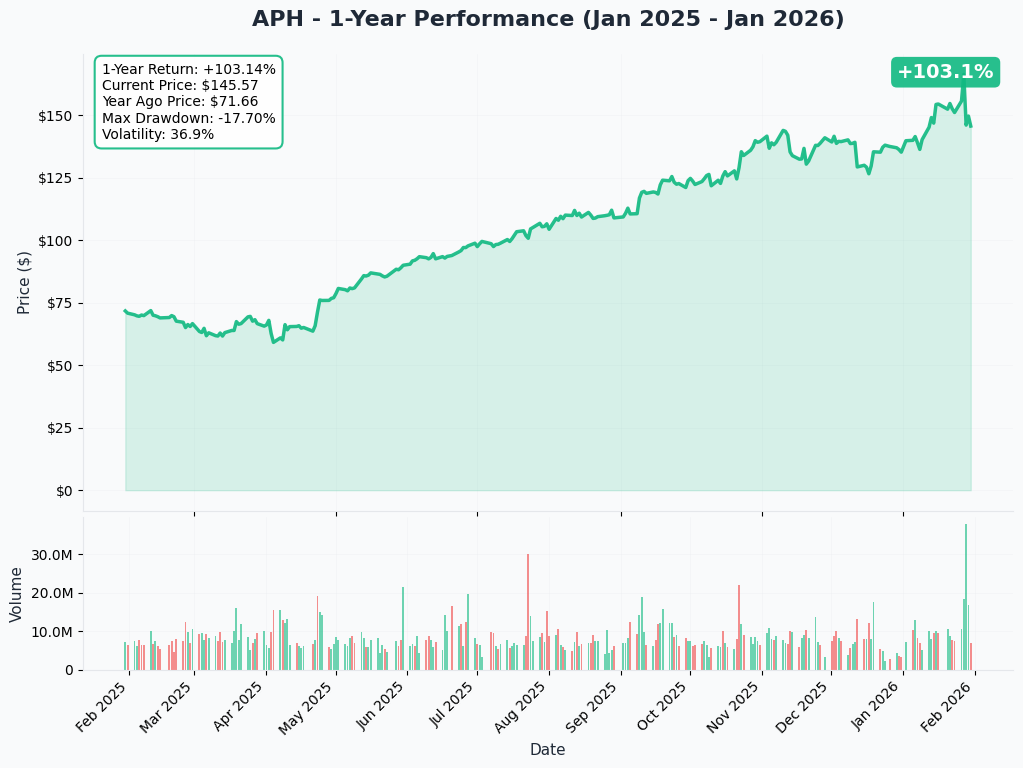
APH has been on a wild ride. The stock rallied from ~$139 at the start of 2026 to all-time highs near $157 ahead of Q4 earnings on January 22nd. Then came the January 28th earnings report - despite beating on both revenue ($6.44B vs consensus) and EPS ($0.97 vs $0.93 expected), the stock cratered approximately 14% on concerns about implied organic growth deceleration in Q1.
Key observations:
- 📉 Post-earnings crash: ~14% sell-off despite record results - classic "sell the news" on elevated expectations
- 📈 12-month monster run: Up ~90% over the trailing twelve months fueled by the AI infrastructure theme
- 🎢 Volatility spike: The earnings gap-down is the most violent move in recent memory for this normally steady compounder
- ⚠️ Below key levels: Trading below the pre-earnings launch point, suggesting the dip buyers haven't shown up in force
- 📊 High volume selling: Post-earnings volume confirms institutional distribution, not just retail panic
Gamma-Based Support & Resistance Analysis
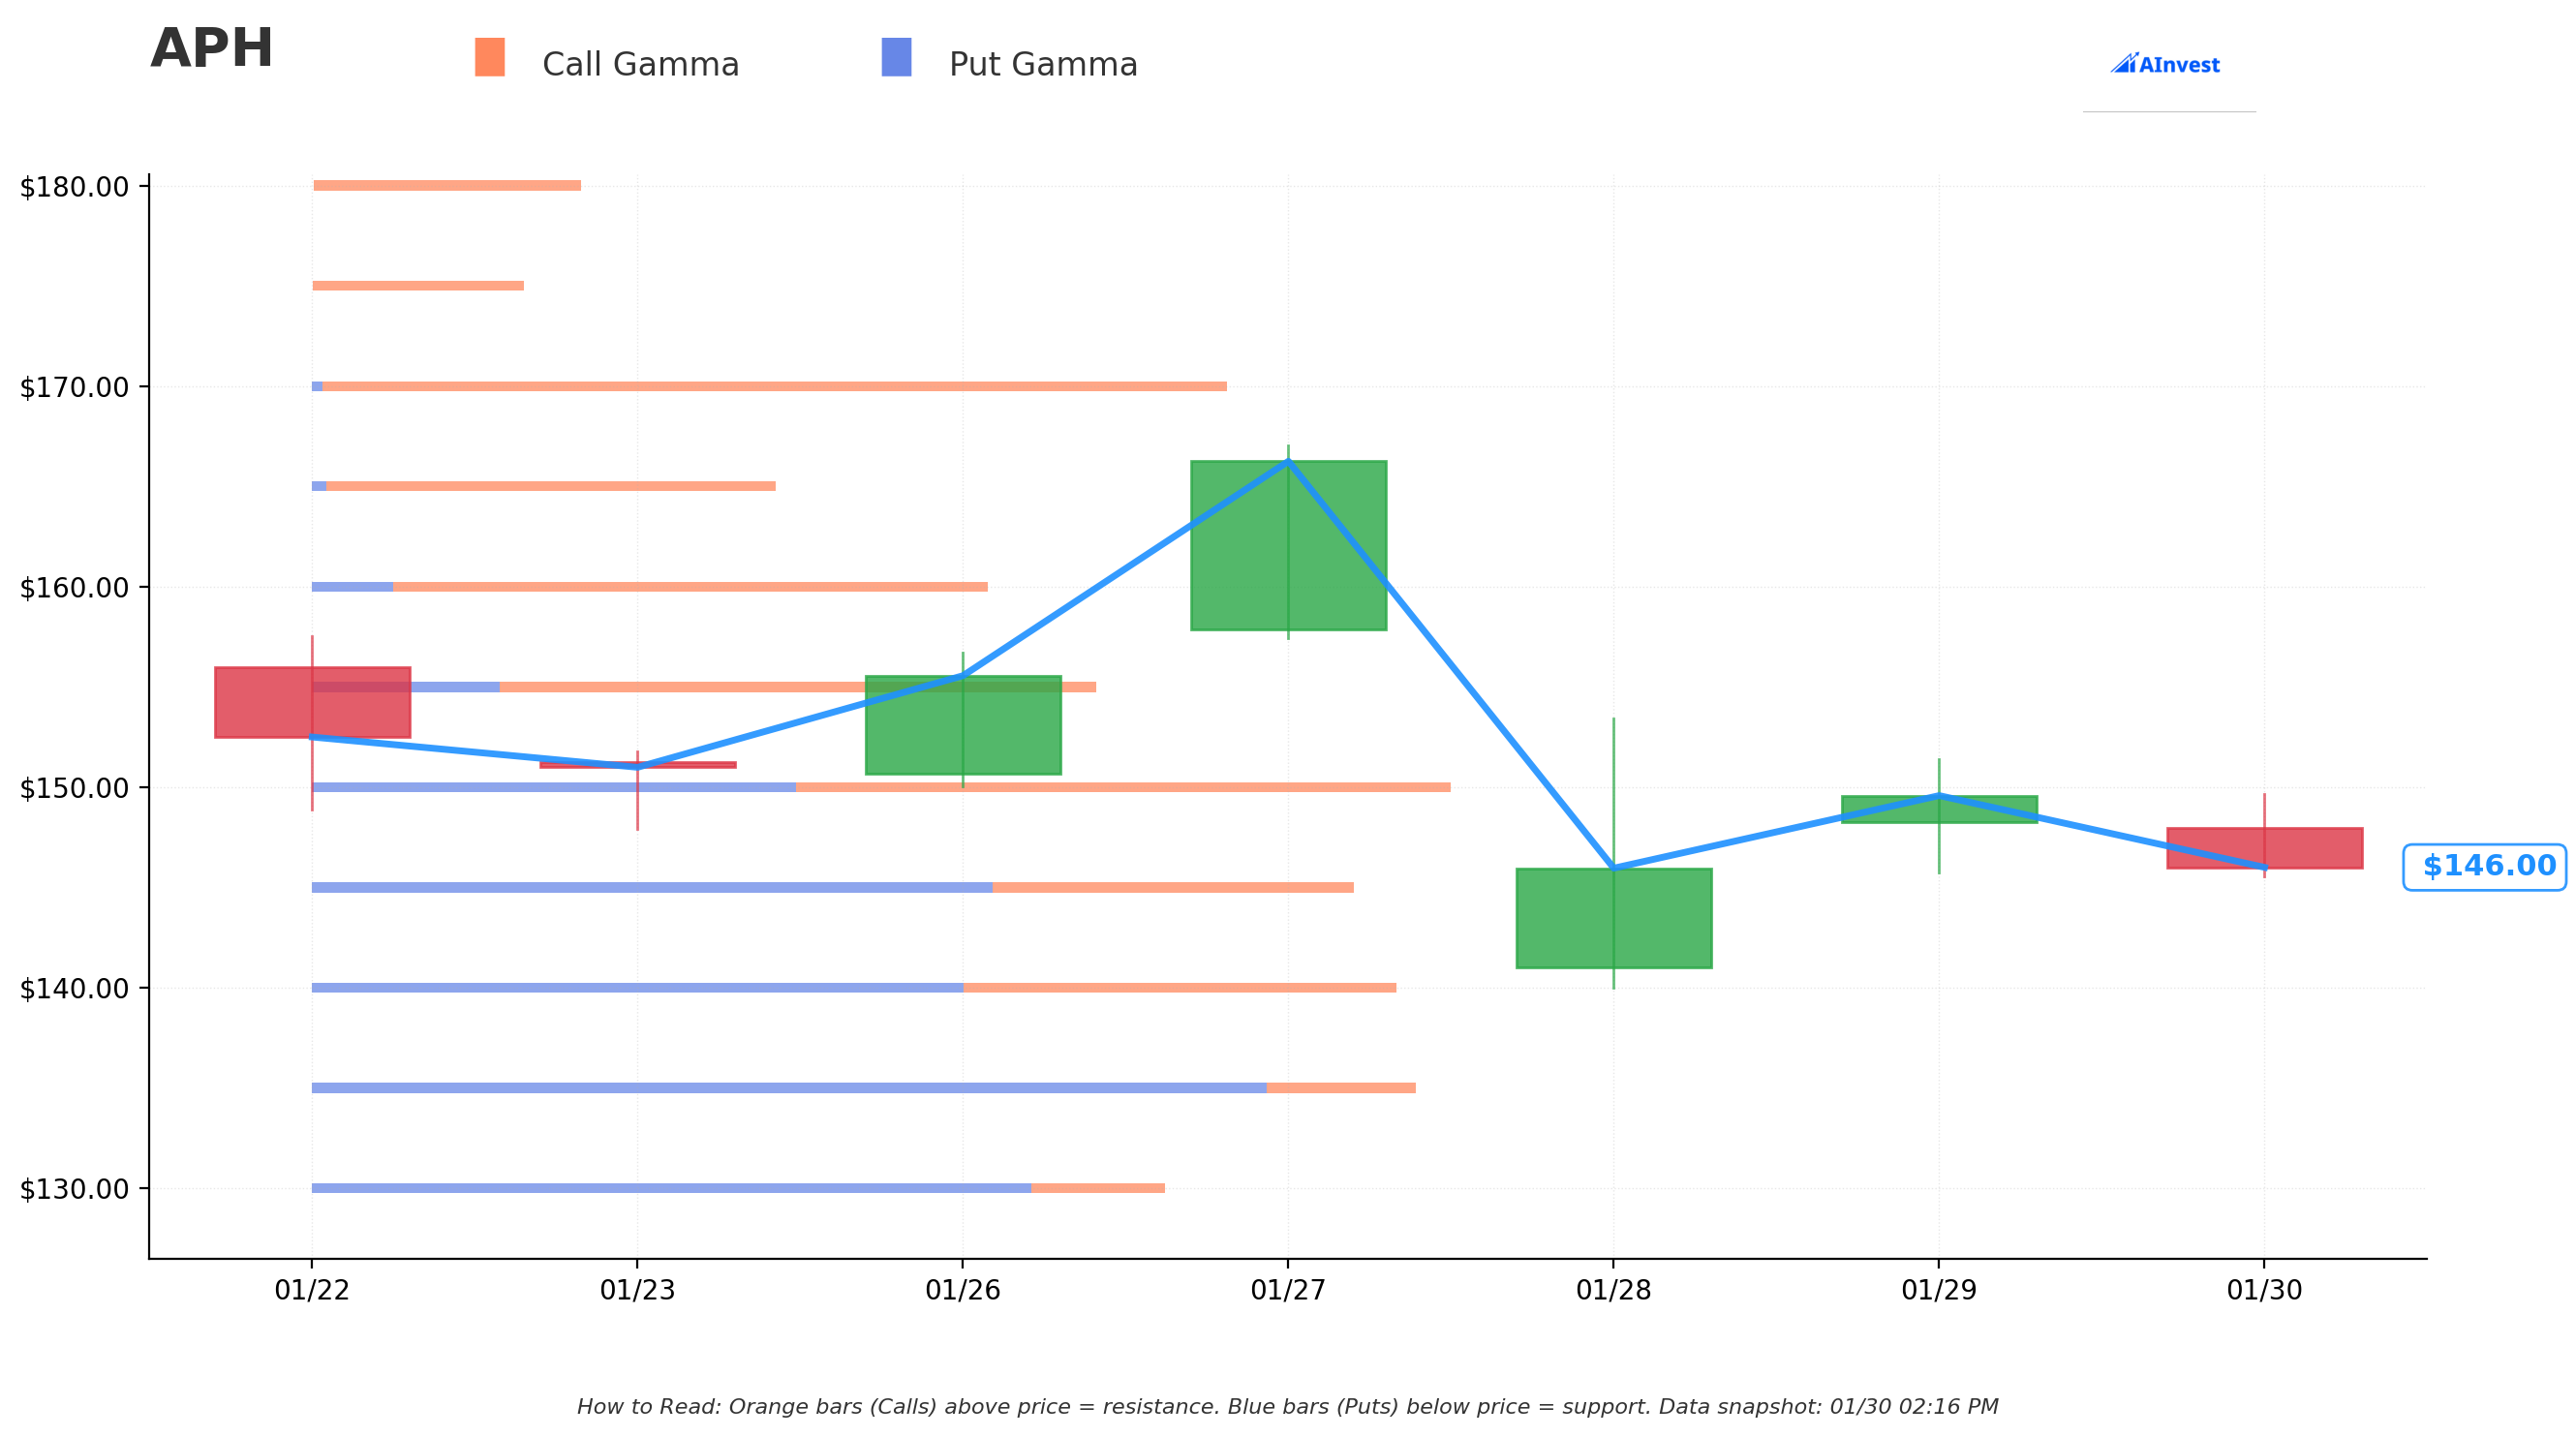
Current Price: $146.38
The gamma exposure map reveals where market makers are positioned and where price is likely to find floors and ceilings:
🔵 Support Levels (Where Dealers Buy the Dip):
- $145 - Strongest nearby support (gamma: 2) - THIS IS THE LINE IN THE SAND right now
- $140 - Major structural floor - exactly where the put strike is! Not a coincidence
- $135 - Secondary deep support
- $130 - Extended support zone
- $125 - Disaster floor
🟠 Resistance Levels (Where Dealers Sell Into Rallies):
- $150 - Strongest resistance (gamma: 2) - immediate ceiling overhead
- $155 - Secondary resistance (pre-earnings level)
- $160 - Major overhead wall
- $165 - Extended resistance
- $170 - Aspirational ceiling
What this means for traders: APH is sitting right between its strongest support at $145 and strongest resistance at $150. That's a tight $5 range where dealer hedging flows will dominate. A break below $145 opens the door to $140 - and that's exactly the put buyer's strike. They're betting the $145 support cracks and momentum carries the stock to $140 or below.
Notice the setup: The put buyer picked $140 precisely because it's a gamma support level. If $145 breaks, there's an air pocket before $140 catches bids. This is well-researched positioning.
Net GEX Bias: Bullish - Overall dealer positioning leans positive, which means the broader market structure favors stability. BUT, when stocks gap down through gamma levels (like APH just did on earnings), bullish GEX can flip quickly as dealers adjust hedges. The put buyer may be betting on exactly that dynamic.
Implied Move Analysis
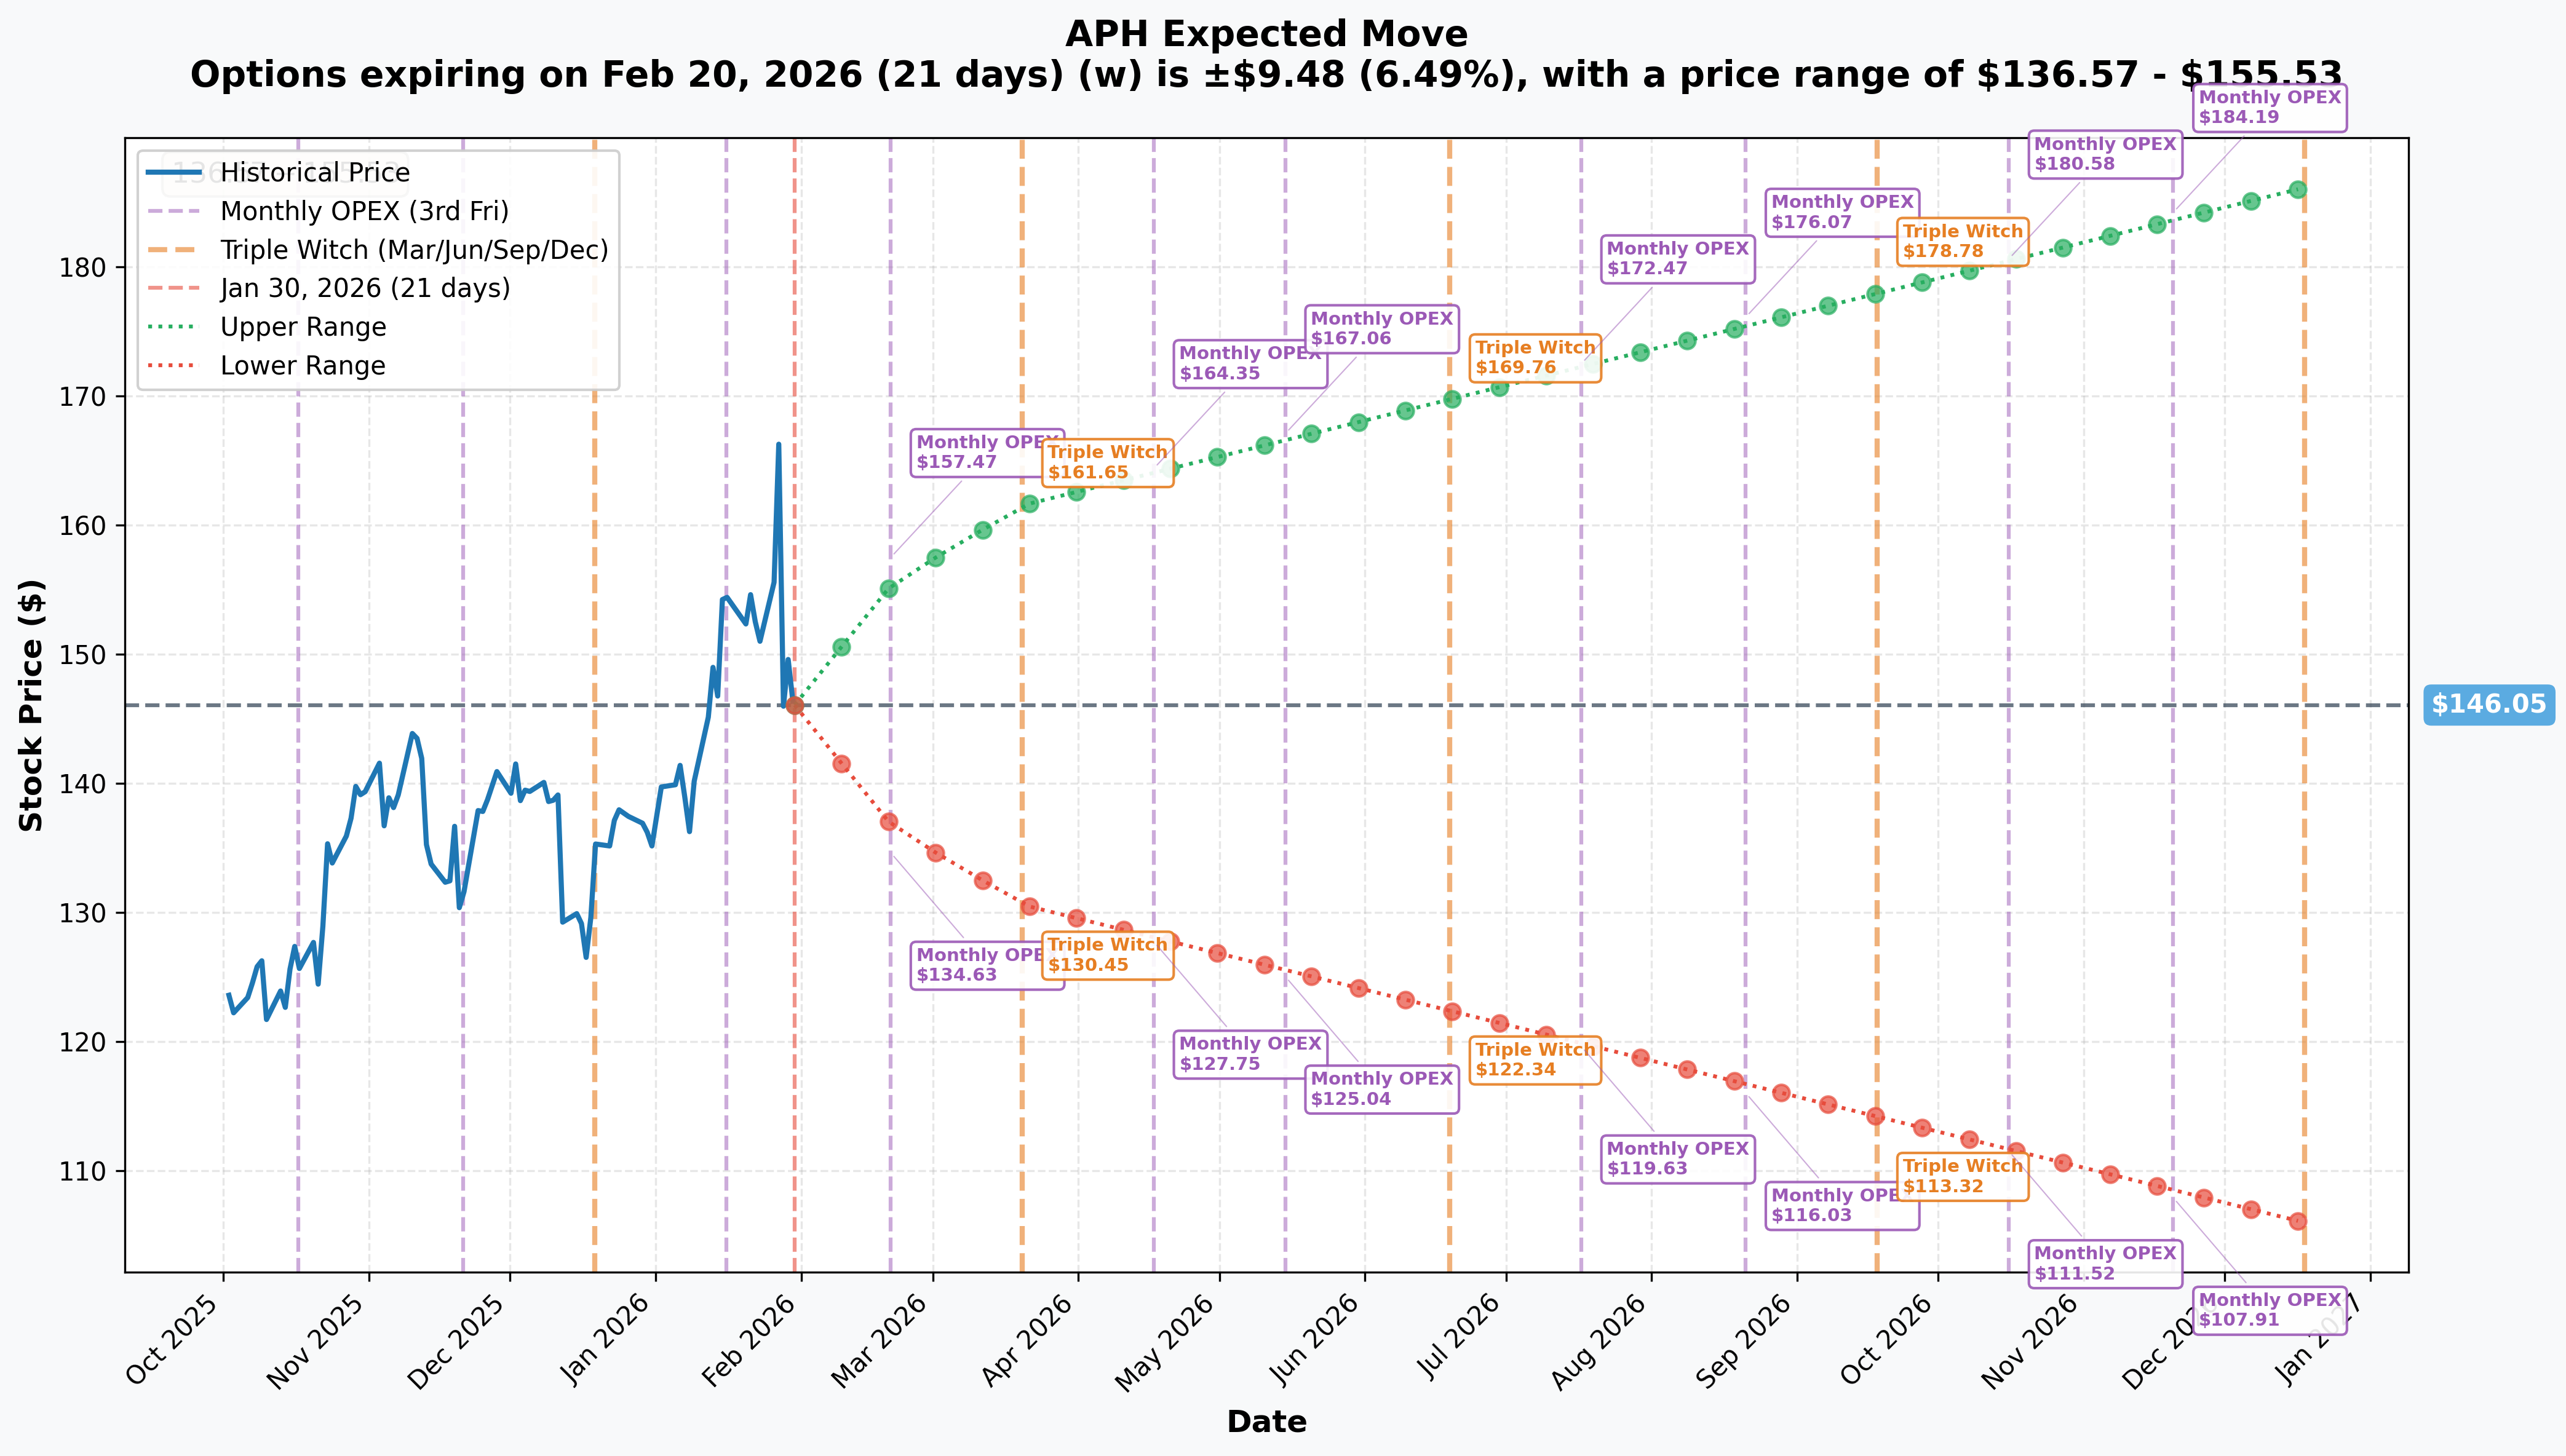
Options market pricing for upcoming expirations:
- 📅 Monthly OPEX (Feb 20 - 21 days): +/-$9.48 (+/-6.5%) -> Range: $136.57 - $155.53
- 📅 Quarterly Triple Witch (Mar 20 - 49 days): +/-$15.51 (+/-10.6%) -> Range: $130.54 - $161.56
- 📅 Yearly LEAPS (Dec 18 - 322 days): +/-$40.12 (+/-27.5%) -> Range: $105.93 - $186.17
Translation for regular folks: The options market is pricing in a $9.48 move (6.5%) by February OPEX - which puts the downside at $136.57. That's BELOW the put buyer's $140 strike, meaning the market thinks there's a real probability APH trades through that level within the next three weeks alone.
Looking at the quarterly window through March 20th, the implied range expands to $130.54 - $161.56. The put buyer's breakeven of $130.50 is right at the lower edge of the quarterly implied move. And the May 15th expiration of this trade falls between the quarterly and yearly timeframes, giving plenty of room for a move toward $130 or lower.
Key insight: The February monthly range alone ($136.57 - $155.53) suggests the options market views more downside risk from here. The put buyer's $140 strike is well within the expected move for the next month, making this a high-probability bet that at least some of the premium gets recovered.
🎪 Catalysts
📉 Why The Sell-Off Happened (Context for This Trade)
Q4 2025 Earnings Beat... But Stock Cratered Anyway (January 28, 2026)
APH reported record Q4 results that beat on every metric - revenue of $6.44B (+49% YoY), EPS of $0.97 (beat by $0.04), and record orders of $8.43B. So why did the stock drop ~14%?
- 📊 Organic growth deceleration fear: Q1 2026 guidance of $6.90B-$7.00B implies sequential organic deceleration that spooked investors
- 💰 Valuation squeeze: At 36-45x earnings, there was zero margin for error - even a beat wasn't enough
- 🏭 CommScope margin drag: The $10.5B acquisition adds ~100 bps of margin headwind in Q1
- 📈 "Sell the news": Stock had rallied to all-time highs near $157 before earnings - too much good news priced in
🔥 Near-Term Catalysts (The Put Buyer's Playbook)
CommScope CCS Integration Risk (Ongoing through 2026) 🏭
The largest acquisition in Amphenol's history closed on January 12, 2026:
- 💰 $10.5 billion cash deal for CommScope's Connectivity and Cable Solutions business
- 📊 Expected to add $4.1B in 2026 sales and ~$0.15 EPS accretion
- ⚠️ This is a MAJOR departure from Amphenol's typical tuck-in M&A playbook - integration risk is real
- 📉 CCS margins are lower than Amphenol's core, dragging consolidated margins by ~100 bps in Q1
- 🎯 If integration stumbles, the market will punish this stock hard given the premium valuation
Why this matters for the put trade: The CommScope integration is the biggest wildcard in Amphenol's history. The company built its reputation on small, disciplined acquisitions. A $10.5B deal is a completely different animal. Any early signs of integration challenges in Q1 results could accelerate the sell-off.
Q1 2026 Earnings (Expected April 28-29, 2026) 📊
The next earnings report falls squarely within the May 15th put expiration window:
- 📊 Guided revenue: $6.90B-$7.00B (~43-45% YoY growth) including ~$900M from CommScope CCS
- 🔍 Market will be laser-focused on organic growth rate EXCLUDING CommScope
- ⚠️ Book-to-bill sustainability after record 1.31x in Q4 - can it hold?
- 💰 Higher 25.5% adjusted tax rate creates additional EPS headwind
- 📉 If organic growth decelerates further, the "growth premium" in APH's valuation could evaporate quickly
AI Capex Spending Cycle - Peak Spending Risk 🤖
Amphenol's IT datacom segment grew ~110% YoY in Q4, representing 38% of total sales. But:
- 📊 Hyperscaler capex cycles are inherently cyclical - the question is WHEN, not IF, spending moderates
- ⚖️ Growth rate comparisons get much harder through 2026 after massive 2025 acceleration
- 🏭 Amphenol's Paladin HD2 and OverPass lines are becoming standard for 224G interconnects, but technology transitions create disruption risk
- 💸 If even ONE major hyperscaler signals capex moderation, the entire AI hardware supply chain sells off
📊 Analyst Activity - Bullish Consensus, But the Stock Isn't Listening
Despite the sell-off, analysts are RAISING price targets:
- J.P. Morgan: $185 (Buy)
- Goldman Sachs: $183 (Buy)
- Seaport Research: $210 (highest on the Street!)
- Barclays: $175 (Overweight)
- Citigroup: $180 (Buy)
- TD Cowen: $135 (Hold) - the lone cautious voice
The consensus is overwhelmingly bullish (11 Buy, 1-2 Hold, 0 Sell). But here's the thing - the stock dropped 14% WHILE analysts were raising targets. That disconnect between Wall Street optimism and actual price action is exactly the kind of setup where contrarian put buyers step in.
⚠️ Risk Catalysts (What Could Send APH Lower)
Trade Policy Uncertainty 🌐
- New semiconductor tariffs effective January 15, 2026 add supply chain complexity
- USMCA joint review in July 2026 could reshape North American trade dynamics
- Evolving export controls on AI-related technology add uncertainty
- As a global manufacturer with operations in 40+ countries, Amphenol is directly exposed to trade friction
Competition Heating Up 🏁
- TE Connectivity investing heavily in 224G ecosystem
- Astera Labs emerging as semiconductor-based connectivity disruptor
- Technology transitions (224G to 448G) could shift competitive dynamics
🎲 Price Targets & Probabilities
Using gamma levels, implied move data, and the catalyst calendar, here are the scenarios through the May 15th expiration:
📈 Bull Case (30% probability)
Target: $155-$170
How we get there:
- 💪 Dip buyers step in aggressively at $145 gamma support, creating a sharp V-recovery
- 🏭 Early CommScope integration signals come in positive (margin improvement, cross-selling wins)
- 🤖 AI capex spending reaccelerates with new hyperscaler build announcements
- 📊 Q1 2026 earnings in April surprise to upside on organic growth, silencing deceleration fears
- 📈 Stock recovers toward analyst consensus targets of $165-$185
- 🎯 Break above $150 resistance triggers momentum buying
Key metrics needed:
- Organic revenue growth holding above 35% YoY excluding CommScope
- Book-to-bill sustaining above 1.0x
- Operating margins stabilizing despite CCS integration drag
- No negative trade policy surprises
Probability assessment: 30% because the fundamental story is strong and analyst consensus is bullish. But the violent earnings reaction suggests institutions are repositioning, and premium valuation needs time to compress or be re-earned.
🎯 Base Case (45% probability)
Target: $135-$155 range (CHOPPY RANGE-BOUND)
Most likely scenario:
- ⚖️ Stock consolidates between $145 support and $150 resistance for weeks
- 📊 Market digests the post-earnings sell-off and CommScope integration narrative
- 🏭 Q1 earnings in April show modest organic deceleration (as guided) but nothing catastrophic
- 💤 Volatility settles down as the "shock" of the 14% drop fades
- 📉 Stock trades down toward $140-145 into Q1 earnings as growth concerns linger
- 🔄 CommScope margin drag confirmed but manageable
- 📈 Range-bound action as bulls and bears fight over the AI growth narrative
Put trade in this scenario: The $140 puts gain some intrinsic value if stock dips to $138-142 range, but likely expire with a partial loss given the $9.50 premium paid. The put buyer may look to take profits on any sharp move toward $140.
Why 45% probability: This is the most common outcome after violent post-earnings sell-offs in fundamentally strong companies. The dust settles, valuation resets lower, and the stock trades sideways until the next catalyst (Q1 earnings).
📉 Bear Case (25% probability)
Target: $120-$135 (THE PUT BUYER'S PAYDAY)
What could go wrong:
- 😰 CommScope integration stumbles - margin compression worse than expected, cultural clash with decentralized model
- 📉 Organic growth decelerates sharply in Q1, validating fears the AI cycle is peaking
- 🏭 Hyperscaler capex moderation signals emerge (even one pullback spooks the market)
- 🌐 Trade policy escalation hits global supply chain operations
- 💸 Broader tech correction drags high-multiple names lower
- ⚖️ Competition from TE Connectivity and Astera Labs gains visible traction
- 📊 Book-to-bill drops below 1.0x, signaling demand softening
- 🔨 Break below $140 triggers cascade through $135, $130 gamma supports
- 💰 Multiple compression from 36x to 25-28x forward earnings (historically normal range)
Critical support levels:
- 🛡️ $145: Strongest gamma support - first line of defense
- 🛡️ $140: Put strike level and secondary gamma support - break below confirms bearish thesis
- 🛡️ $135: Extended support - bear case transition zone
- 🛡️ $130: Deep support - full bear scenario target (quarterly implied move low: $130.54)
Put P&L in Bear Case:
- Stock at $135 on May 15: Puts worth $5.00, loss = -$4.50/share x 1,500 = -$675K (still losing)
- Stock at $130 on May 15: Puts worth $10.00, profit = $0.50/share x 1,500 = $75K (barely profitable)
- Stock at $125 on May 15: Puts worth $15.00, profit = $5.50/share x 1,500 = $825K (58% ROI)
- Stock at $120 on May 15: Puts worth $20.00, profit = $10.50/share x 1,500 = $1.575M (112% ROI!)
The math tells you something: This put buyer needs a SIGNIFICANT move to profit at expiration. They're either expecting a major breakdown (think CommScope disaster + macro selloff) OR they plan to trade around the position, selling into weakness and buying back on bounces. The $9.50 premium gives them time - 105 days is a LOT of runway.
💡 Trading Ideas
🛡️ Conservative: Wait for the Dust to Settle
Play: Stay on sidelines until APH finds a clear support level post-earnings
Why this works:
- ⏰ The 14% post-earnings drop is still being digested - catching falling knives is dangerous
- 📊 CommScope integration unknowns create a wide range of outcomes for Q1
- 💸 Implied volatility is elevated post-earnings - options are expensive
- 🎯 Let the stock prove $145 support holds (or doesn't) before committing capital
- 📉 If $145 breaks, you'll get a much better entry at $135-140
- 📈 If $145 holds and stock bounces to $155, you've "missed" 7% but avoided potential 10% further downside
Action plan:
- 👀 Watch $145 gamma support like a hawk - if it holds for 5+ trading days with improving volume, that's your buy signal
- 🎯 Look for entry at $140-145 range if you're bullish on the long-term AI connectivity story
- ❌ Do NOT buy if stock breaks $145 on heavy volume - wait for $135 or lower
- 📊 Monitor CommScope integration commentary from management and sell-side analysts
- ⏰ Q1 earnings in late April is the next major binary event - position accordingly
Risk level: Minimal (cash position) | Skill level: Beginner-friendly
⚖️ Balanced: Bear Put Spread (Defined Risk Bearish Play)
Play: Capitalize on elevated volatility with a defined-risk bearish spread
Structure: Buy $145 puts, Sell $135 puts (May 15 expiration - same as the big trade)
Why this works:
- 📊 Defined risk spread ($10 wide = $1,000 max risk per spread)
- 🎯 Targets the gamma support zone at $135-$145 where the stock could settle
- ⏰ Same expiration as the institutional trade - ride the same thesis at smaller scale
- 💸 Selling the $135 put reduces cost basis vs outright put purchase
- 📉 Q1 earnings falls within this window, creating potential catalyst for further downside
- 🤝 Aligned with the institutional flow signal
Estimated P&L:
- 💰 Cost: ~$4-5 net debit per spread
- 📈 Max profit: $500-600 if APH below $135 at May expiration
- 📉 Max loss: $400-500 if APH above $145 (defined and limited)
- 🎯 Breakeven: ~$140-141
Entry timing:
- ⏰ Enter on any bounce toward $148-150 (selling into strength gives better pricing)
- 🎯 Only enter if conviction is bearish - this is a directional trade
- ❌ Skip if stock drops below $140 before you enter (spread too close to being in-the-money)
Position sizing: Risk only 2-5% of portfolio
Risk level: Moderate (defined risk, bearish directional) | Skill level: Intermediate
🚀 Aggressive: Follow the Flow - Outright Put Purchase (ADVANCED ONLY!)
Play: Mirror the institutional trade with smaller size
Structure: Buy $140 puts (May 15 expiration - exactly copying the $1.4M trade)
Why this could work:
- 🐋 Following a high-conviction institutional trade with extreme unusual activity
- ⏰ 105 days gives time for CommScope integration concerns, Q1 earnings, and macro developments
- 📉 Stock already in downtrend after 14% post-earnings drop - momentum is bearish
- 📊 Analyst disconnect (raising targets while stock drops) often resolves to the DOWNSIDE
- 🎯 $140 gamma support level means if it breaks, it could break hard
Why this could blow up (SERIOUS RISKS):
- 💸 EXPENSIVE: $9.50/contract means you need a 12%+ drop just to break even at expiration
- ⏰ TIME DECAY: Theta eats away ~$0.09/day - that adds up fast over 105 days
- 📈 Bullish fundamentals: Record orders (1.31x book-to-bill), AI tailwinds, 11 analyst Buy ratings - fighting the fundamentals
- 🔵 Gamma support at $145: Market makers will buy dips aggressively here, limiting downside
- 📊 Already down 14%: Much of the bad news may already be priced in
- 🤖 AI spending resilient: If hyperscaler capex announcements remain strong, the sell-off reverses
Risk level: HIGH (can lose 100% of premium) | Skill level: Advanced only
Probability of profit at expiration: ~25-30% (needs significant move)
⚠️ Risk Factors
Don't get caught by these potential landmines:
-
📉 Post-earnings momentum cuts both ways: APH just dropped ~14% despite beating on every metric. The sell-off reflects institutional de-risking at peak valuation, not fundamental deterioration. If institutions decide the dip is oversold, a sharp recovery could vaporize put positions quickly. Conversely, if selling continues, it could cascade through gamma levels.
-
🏭 CommScope integration is THE swing factor: The $10.5B acquisition is the largest in Amphenol's history and a departure from their proven playbook. Success validates the growth strategy and stock recovers. Failure triggers multiple compression from 36x to 25x earnings - that alone is a 30% haircut. There's no middle ground here.
-
💰 Valuation still stretched after the drop: Even after the 14% pullback, APH trades at ~36x forward earnings vs a historical average closer to 25-30x. The premium requires continued 40%+ growth, which gets harder as 2025 comparisons become increasingly difficult. Zero cushion for disappointment.
-
🤖 AI capex cycle risk: IT datacom is now 38% of Amphenol's revenue and grew 110% YoY. That concentration creates significant risk if hyperscaler spending moderates. One major cloud company reducing capex guidance could trigger a sector-wide sell-off in AI infrastructure names.
-
🌐 Trade policy headwinds: New semiconductor tariffs (January 2026) and the upcoming USMCA joint review (July 2026) add uncertainty for a global manufacturer with operations in 40+ countries.
-
📊 Analyst consensus is BULLISH: 11 Buy ratings with an average target of $145-$173 and a high target of $210. Betting against Wall Street consensus is contrarian by definition - it works spectacularly when you're right, but the base rate favors the consensus.
-
🐋 The put trade could be a hedge, not a directional bet: While we classified this as a bearish directional trade (BTO with no existing OI), the trader could have a large stock position or call position elsewhere. A $1.4M put on a $183B market cap company isn't going to move the needle if it's part of a broader portfolio. Context matters.
-
📈 Record order backlog provides cushion: The 1.31x book-to-bill ratio and $8.43B in quarterly orders provide significant revenue visibility. Even if growth decelerates, the backlog provides a floor that pure bearish scenarios may underestimate.
🎯 The Bottom Line
Real talk: Someone spent $1.4 million betting APH keeps falling after its worst earnings reaction in years. This isn't a hedge at 36 contracts of prior open interest - this is a brand new, high-conviction bearish bet against one of the best-run companies in the industrial tech space.
What this trade tells us:
- 🎯 Someone sees the post-earnings sell-off as the BEGINNING of a larger reset, not a one-day overreaction
- 💰 They're willing to pay $9.50/share for $140 puts through May - giving them Q1 earnings exposure
- 📉 The $140 strike sits at gamma support, suggesting they expect the $145 floor to crack
- ⏰ 105 days of time value buys them patience - they don't need this to work tomorrow
- 🏭 The CommScope integration thesis is likely the core bear case - it's the biggest unknown
The bull case is also legitimate though. Amphenol just reported record results across the board. Orders are at all-time highs. AI infrastructure demand is real and growing. The company has one of the best management teams in the industry and has compounded shareholder value for decades. A 14% post-earnings drop in a stock this fundamentally strong often ends up being a buying opportunity, not a selling one.
If you own APH:
- ✅ Don't panic sell after a 14% drop on a beat-and-raise quarter - that's how you lock in losses at the worst time
- 📊 Watch $145 support closely - if it holds for a week, the bottom is likely in
- ⚠️ Consider trimming if stock breaks below $140 on volume - that would signal more pain ahead
- 🎯 Q1 earnings in late April is the next key checkpoint - organic growth rate is what matters most
- 🛡️ If holding a large position, protective puts at $140 (copying this trade) provide defined downside insurance
If you're watching from sidelines:
- ⏰ Patience is your edge - let the post-earnings volatility settle over the next 1-2 weeks
- 🎯 $140-145 range would be an attractive entry for long-term holders (that's 20-25% below recent highs)
- 📊 Wait for Q1 earnings to confirm whether organic growth deceleration is real or just Q1 seasonality
- 📈 Long-term, Amphenol's position in AI interconnects is strong - ~33% market share with best-in-class margins
- 🏭 The CommScope integration is either going to make this stock a $200+ story or a $120 story - figure out which before you buy
If you're bearish:
- 📉 The 14% drop gave you validation, but don't chase - entering puts after a crash means you're buying expensive vol
- 🎯 Watch for any bounce toward $150 resistance to initiate bearish positions at better prices
- 📊 Bear put spreads ($145/$135 or $140/$130) offer defined risk for the Q1 earnings catalyst
- ⏰ April Q1 earnings is your make-or-break event - organic deceleration confirmation would unlock $130 target
Mark your calendar - Key dates:
- 📅 February 20 - Monthly OPEX (+/-6.5% implied move)
- 📅 March 20 - Quarterly Triple Witch (+/-10.6% implied move)
- 📅 April 28-29 (est.) - Q1 2026 Earnings (THE binary event for this put trade)
- 📅 May 15 - This $1.4M put trade expires
- 📅 July 2026 - Q2 earnings + USMCA joint review
- 📅 Ongoing - CommScope CCS integration milestones
Final verdict: This is a battle between a fundamentally excellent company (record results, record orders, AI tailwinds) and a market that decided the valuation got ahead of itself. The $1.4M put trade is a bet that valuation normalization has more room to run - and with CommScope integration risk hanging over the stock, that's not a crazy thesis. But betting against a company with 27.5% operating margins, 1.31x book-to-bill, and the strongest product cycle in its history requires things to go meaningfully wrong.
The smart play: Let the stock tell you which way it's going. $145 holds = buy the dip. $145 breaks = more pain ahead. Don't try to be a hero - let the levels do the talking.
Disclaimer: Options trading involves substantial risk of loss and is not suitable for all investors. This analysis is for educational purposes only and not financial advice. Past performance doesn't guarantee future results. The 41.7x volume/OI ratio reflects this specific trade's unusual nature relative to existing positioning - it does not imply the trade will be profitable or that you should follow it. Always do your own research and consider consulting a licensed financial advisor before trading. Post-earnings volatility creates elevated risk of gap moves in either direction.
About Amphenol Corporation: Amphenol Corporation is a global supplier of connectors, sensors, and interconnect systems serving automotive, broadband, commercial air, industrial, IT/data, and military markets. The company holds the second-largest connector market share globally with a market cap of $183.1 billion in the Electronic Connectors industry.