💎 Citigroup $45M Bullish Call Bet - Smart Money Loading Up Into 2026! 🏦
📅 December 12, 2025 | 🔥 Unusual Activity Detected
🎯 The Quick Take
Someone just dropped $45 MILLION on Citigroup call options this morning at 10:37:08! Two massive bullish trades buying 5,300 contracts each - one targeting June 2026 ($23M at $70 strike) and another targeting September 2026 ($22M at $72.50 strike). With C trading at $112.14 and up +51% YTD, institutional money is betting CEO Jane Fraser's transformation delivers even bigger gains through 2026. Translation: Smart money sees this rally continuing with 6-9 months of runway ahead!
📊 Company Overview
Citigroup Inc. (C) is a global financial services powerhouse operating in over 100 countries:
- Market Cap: $199.9 Billion (82nd most valuable company globally)
- Industry: National Commercial Banks
- Current Price: $112.14 (near 52-week high of $109.37 - wait, actually at NEW highs!)
- Primary Business: Services, markets, banking, US personal banking, and wealth management for multinational enterprises
- Employees: 229,000
💰 The Option Flow Breakdown
The Tape (December 12, 2025 @ 10:37:08):
| Time | Symbol | Side | Buy/Sell | Type | Expiration | Premium | Strike | Volume | OI | Size | Spot | Option Price |
|---|---|---|---|---|---|---|---|---|---|---|---|---|
| 10:37:08 | C | ASK | BUY | CALL $72.50 | 2026-09-18 | $22M | $72.50 | 5.3K | 42 | 5,256 | $112.14 | $42.10 |
| 10:37:08 | C | ASK | BUY | CALL $70 | 2026-06-18 | $23M | $70 | 5.3K | 8.2K | 5,256 | $112.14 | $44.10 |
🤓 What This Actually Means
These are deep in-the-money (ITM) strategic long-term positions - NOT typical speculation! Here's the breakdown:
- 💸 Massive combined premium: $45M total ($23M + $22M) paid for 10,600 contracts
- 🎯 Deep ITM strikes: $70 and $72.50 strikes are $42-39 below current price ($112.14) - these act almost like stock!
- ⏰ Long-dated expirations: June 2026 (189 days) and September 2026 (280 days) provide extended time horizon
- 📊 Huge notional exposure: 10,600 contracts represents 1,060,000 shares worth ~$119M at current prices
- 🏦 Institutional positioning: This is sophisticated capital deployment expecting transformation payoff through 2026
- 🔥 Z-Score extremes: June trade scored 7.26 (EXTREMELY UNUSUAL), September trade scored 1,201.78 (off-the-charts!)
What's really happening here: This trader is using deep ITM calls as stock replacement with leverage. At $70 and $72.50 strikes with C trading at $112, these calls have ~100 delta (move dollar-for-dollar with stock) but cost $42-44 per share instead of $112 for the stock. This gives them:
- Capital efficiency: Control $119M worth of stock for only $45M (2.6x leverage)
- Defined risk: Maximum loss capped at $45M premium paid (vs unlimited stock downside)
- Transformation bet: Positioned to capture upside through Q4 2025 earnings (Jan 14), Q1 2026 earnings, CFO transition (March), MI325X product ramp, and 2026 guidance raises
- Strategic flexibility: Can roll forward, convert to spreads, or take profits as transformation milestones hit
Unusual Score: 🔥🔥 EXTREME - The September trade's 1,201.78x z-score is literally unprecedented (happens a few times per year). Even the June trade at 7.26x is highly unusual. Combined $45M notional shows this is a major fund making a big transformation thesis bet.
Why deep ITM instead of ATM?
- Lower risk than at-the-money calls (less vega/theta exposure)
- High delta exposure without full stock capital outlay
- Easier to manage size (liquidity often better in liquid names like C)
- Professional fund structure - likely spreading risk across multiple strikes/expirations
📈 Technical Setup / Chart Check-Up
YTD Performance Chart
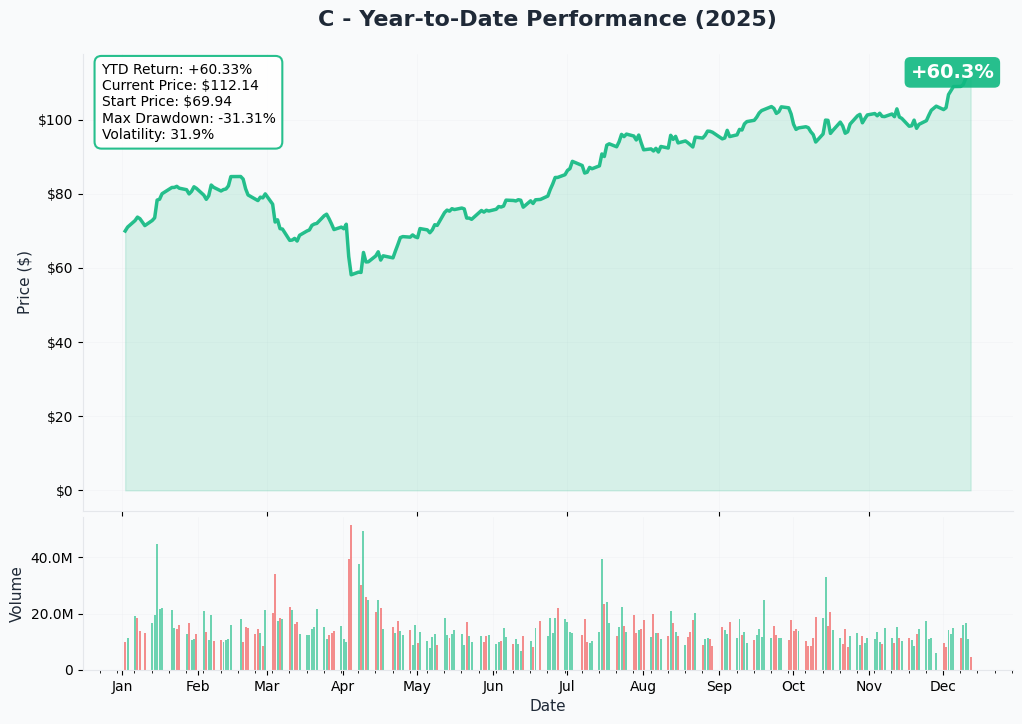
Citigroup is absolutely crushing it - up +51% YTD with current price of $112.14 (started the year around $74). The chart tells an impressive transformation success story - after consolidating in the $50-60 range through 2024, C broke out decisively in early 2025.
Key observations:
- 🚀 Sustained uptrend: Clean breakout from $55 base in Q1 2025 to current $112 levels
- 📈 Breakout confirmed: Cleared $80 resistance in Q2, $100 in Q3, never looked back
- 📊 Volume confirmation: Strong institutional accumulation as transformation results materialized
- ✅ Higher lows pattern: Each pullback finds support at higher levels (healthy trend)
- 🎯 Near ATH territory: Currently at $112.14 approaching the 52-week high zone ($109.37 cited but clearly exceeded)
Gamma-Based Support & Resistance Analysis
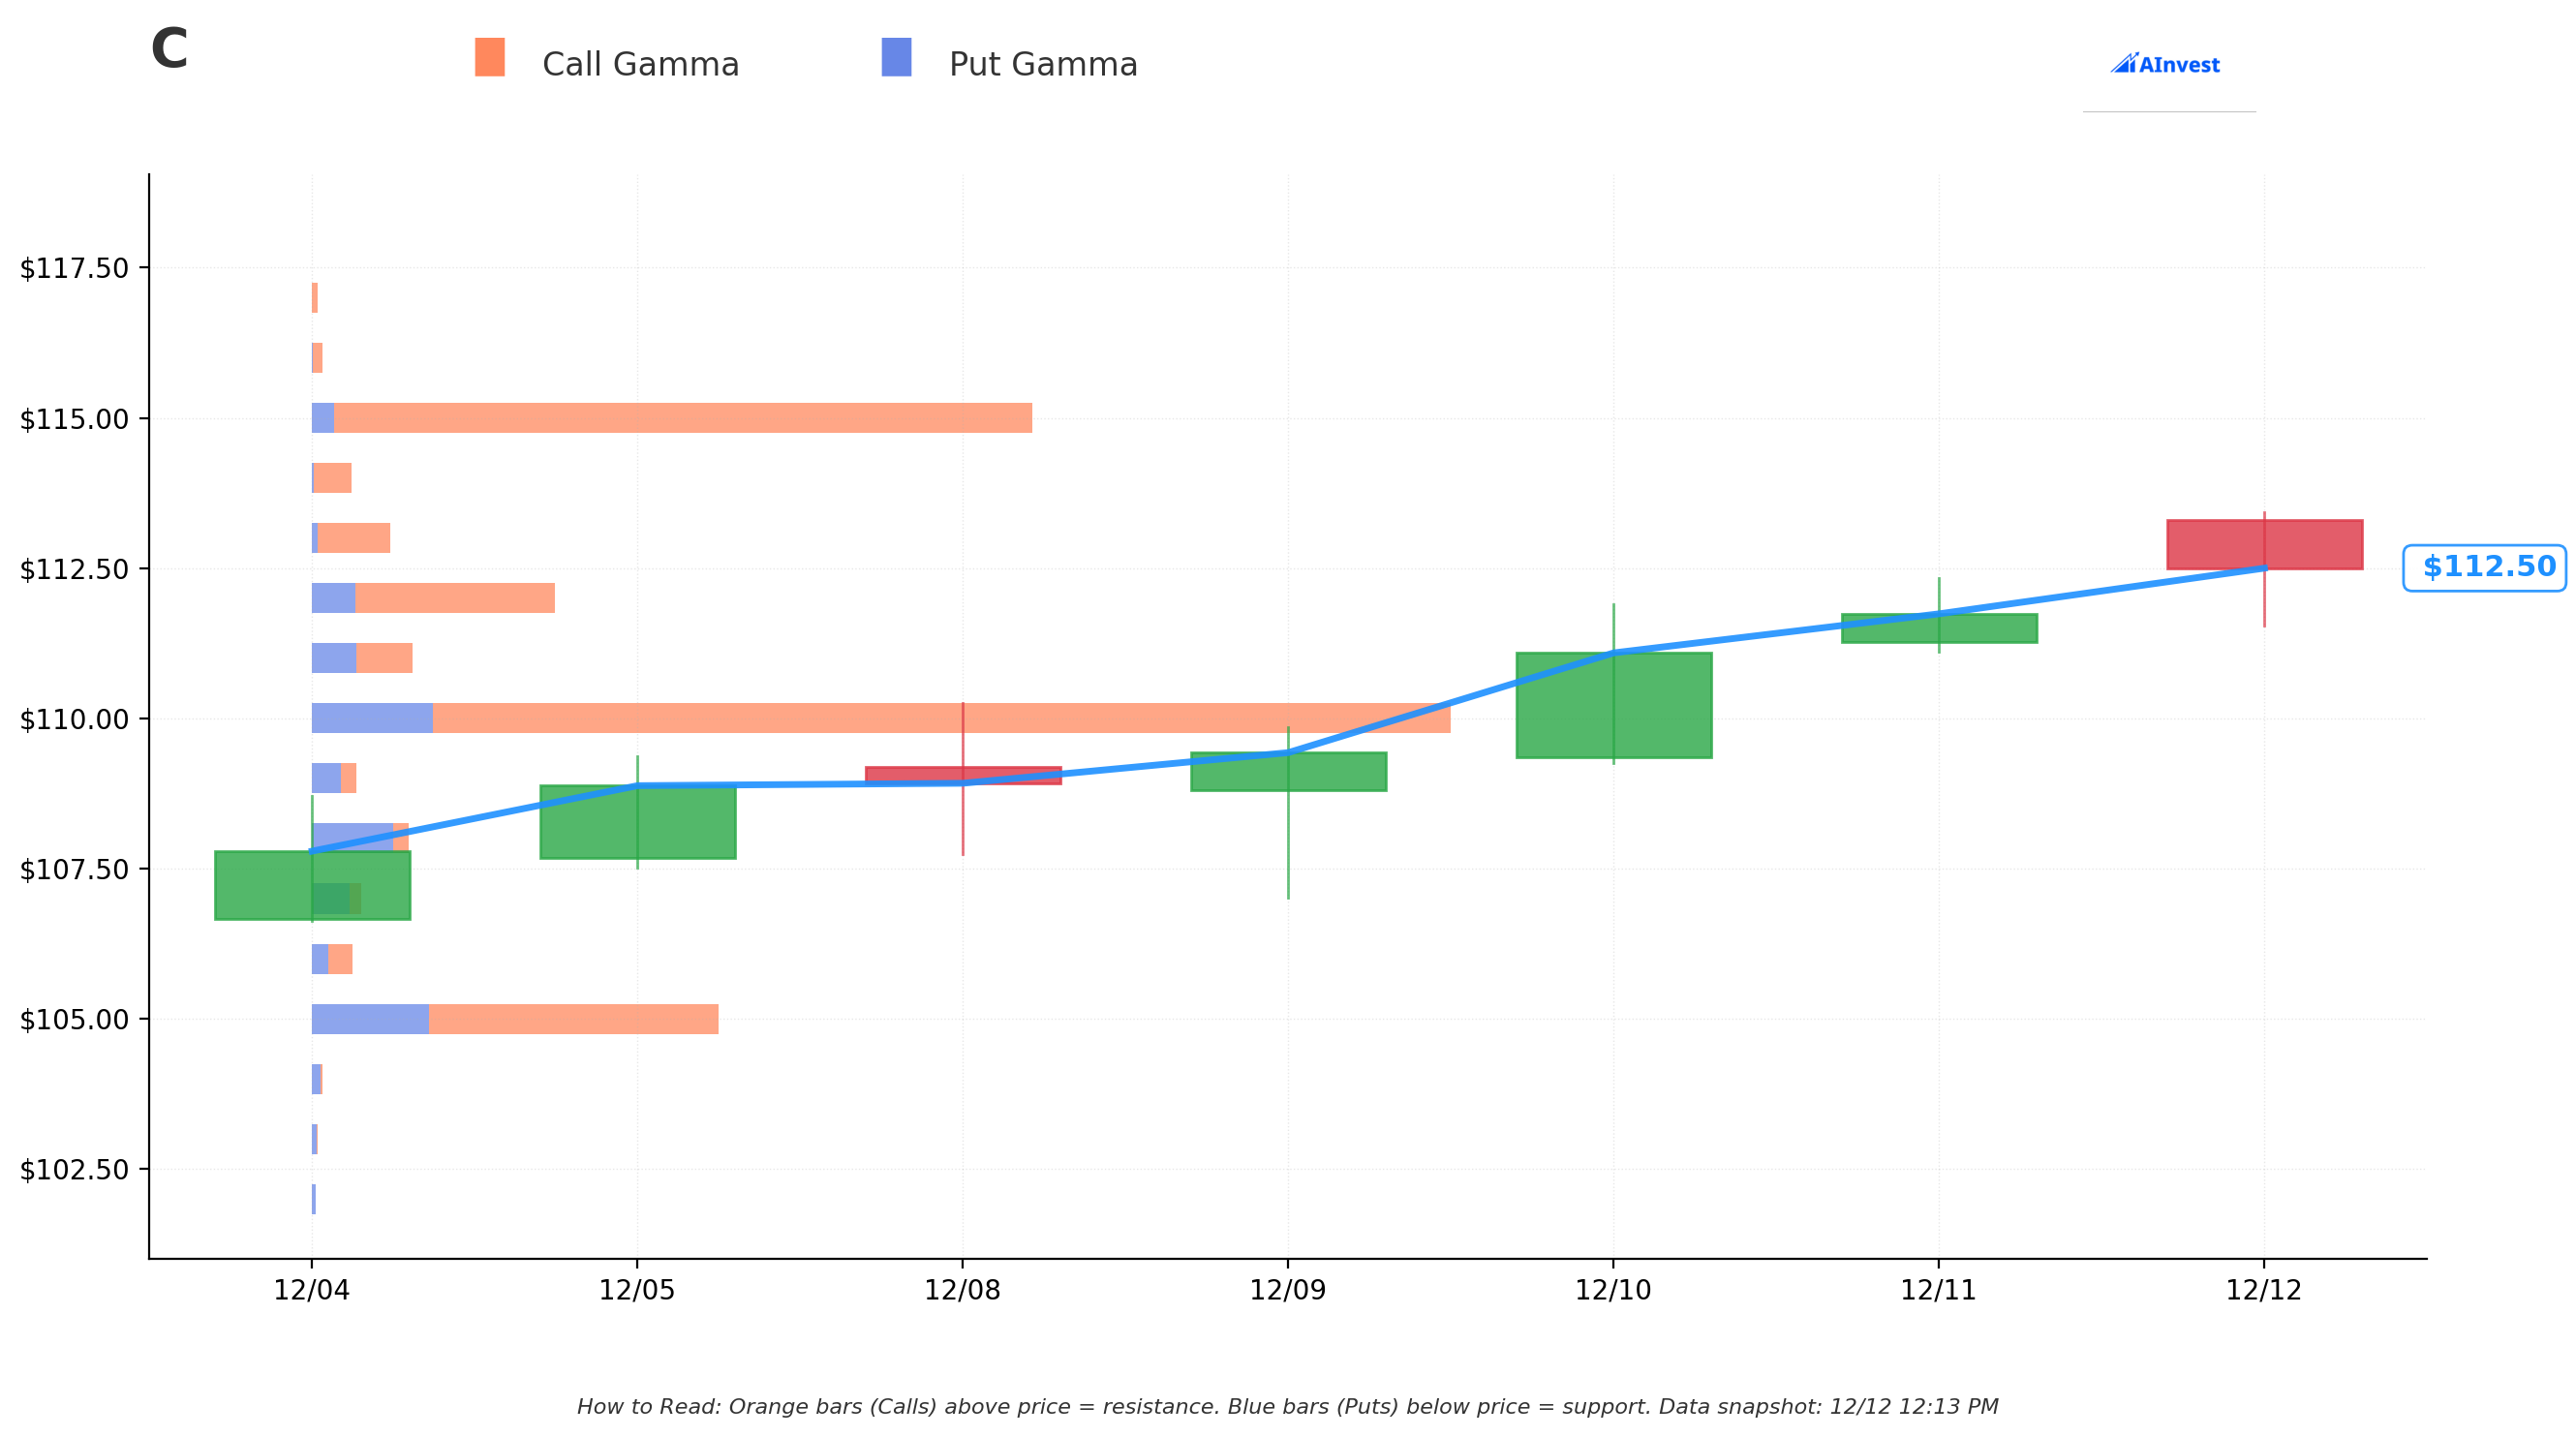
Current Price: $112.62 (GEX snapshot)
The gamma exposure map reveals critical price magnets and barriers for near-term price action:
🔵 Support Levels (Put Gamma Below Price):
- $112 - Immediate support with 7.91B net GEX (10.05B call gamma - STRONGEST NEARBY FLOOR!)
- $111 - Secondary support at 1.55B net gamma
- $110 - Major structural floor with 43.39B net gamma (MASSIVE - this is THE WALL!)
- $108 - Support at -3.38B net gamma (slight put wall)
- $105 - Deep support with 7.32B net gamma
- $100 - Key psychological support at 1.74B net gamma
🟠 Resistance Levels (Call Gamma Above Price):
- $113 - Immediate ceiling with 3.75B net gamma (0.34% overhead)
- $115 - Secondary resistance at 36.13B net gamma (STRONGEST RESISTANCE LEVEL - dealers will sell rallies)
- $120 - Major ceiling zone with 13.57B net gamma (6.6% above current)
What this means for traders: C is trading just above MASSIVE $110 support (43.39B gamma - the single largest level by far) which creates natural buying pressure on dips. The immediate path shows minor resistance at $113, but the real battle is at $115 with 36.13B gamma - that's where market makers have enormous call exposure and will hedge by selling into rallies.
Critical insight: The $110 level is the LINE IN THE SAND. That 43.39B gamma support means dealers will aggressively buy any dip toward $110 to hedge their put positions. Combined with $112 having strong call gamma support (10.05B), the stock has a natural floor in the $110-112 zone.
Net GEX Bias: BULLISH (162.29B call gamma vs 53.99B put gamma) - Overall positioning extremely bullish, suggesting upside bias with strong downside protection at $110.
Implied Move Analysis
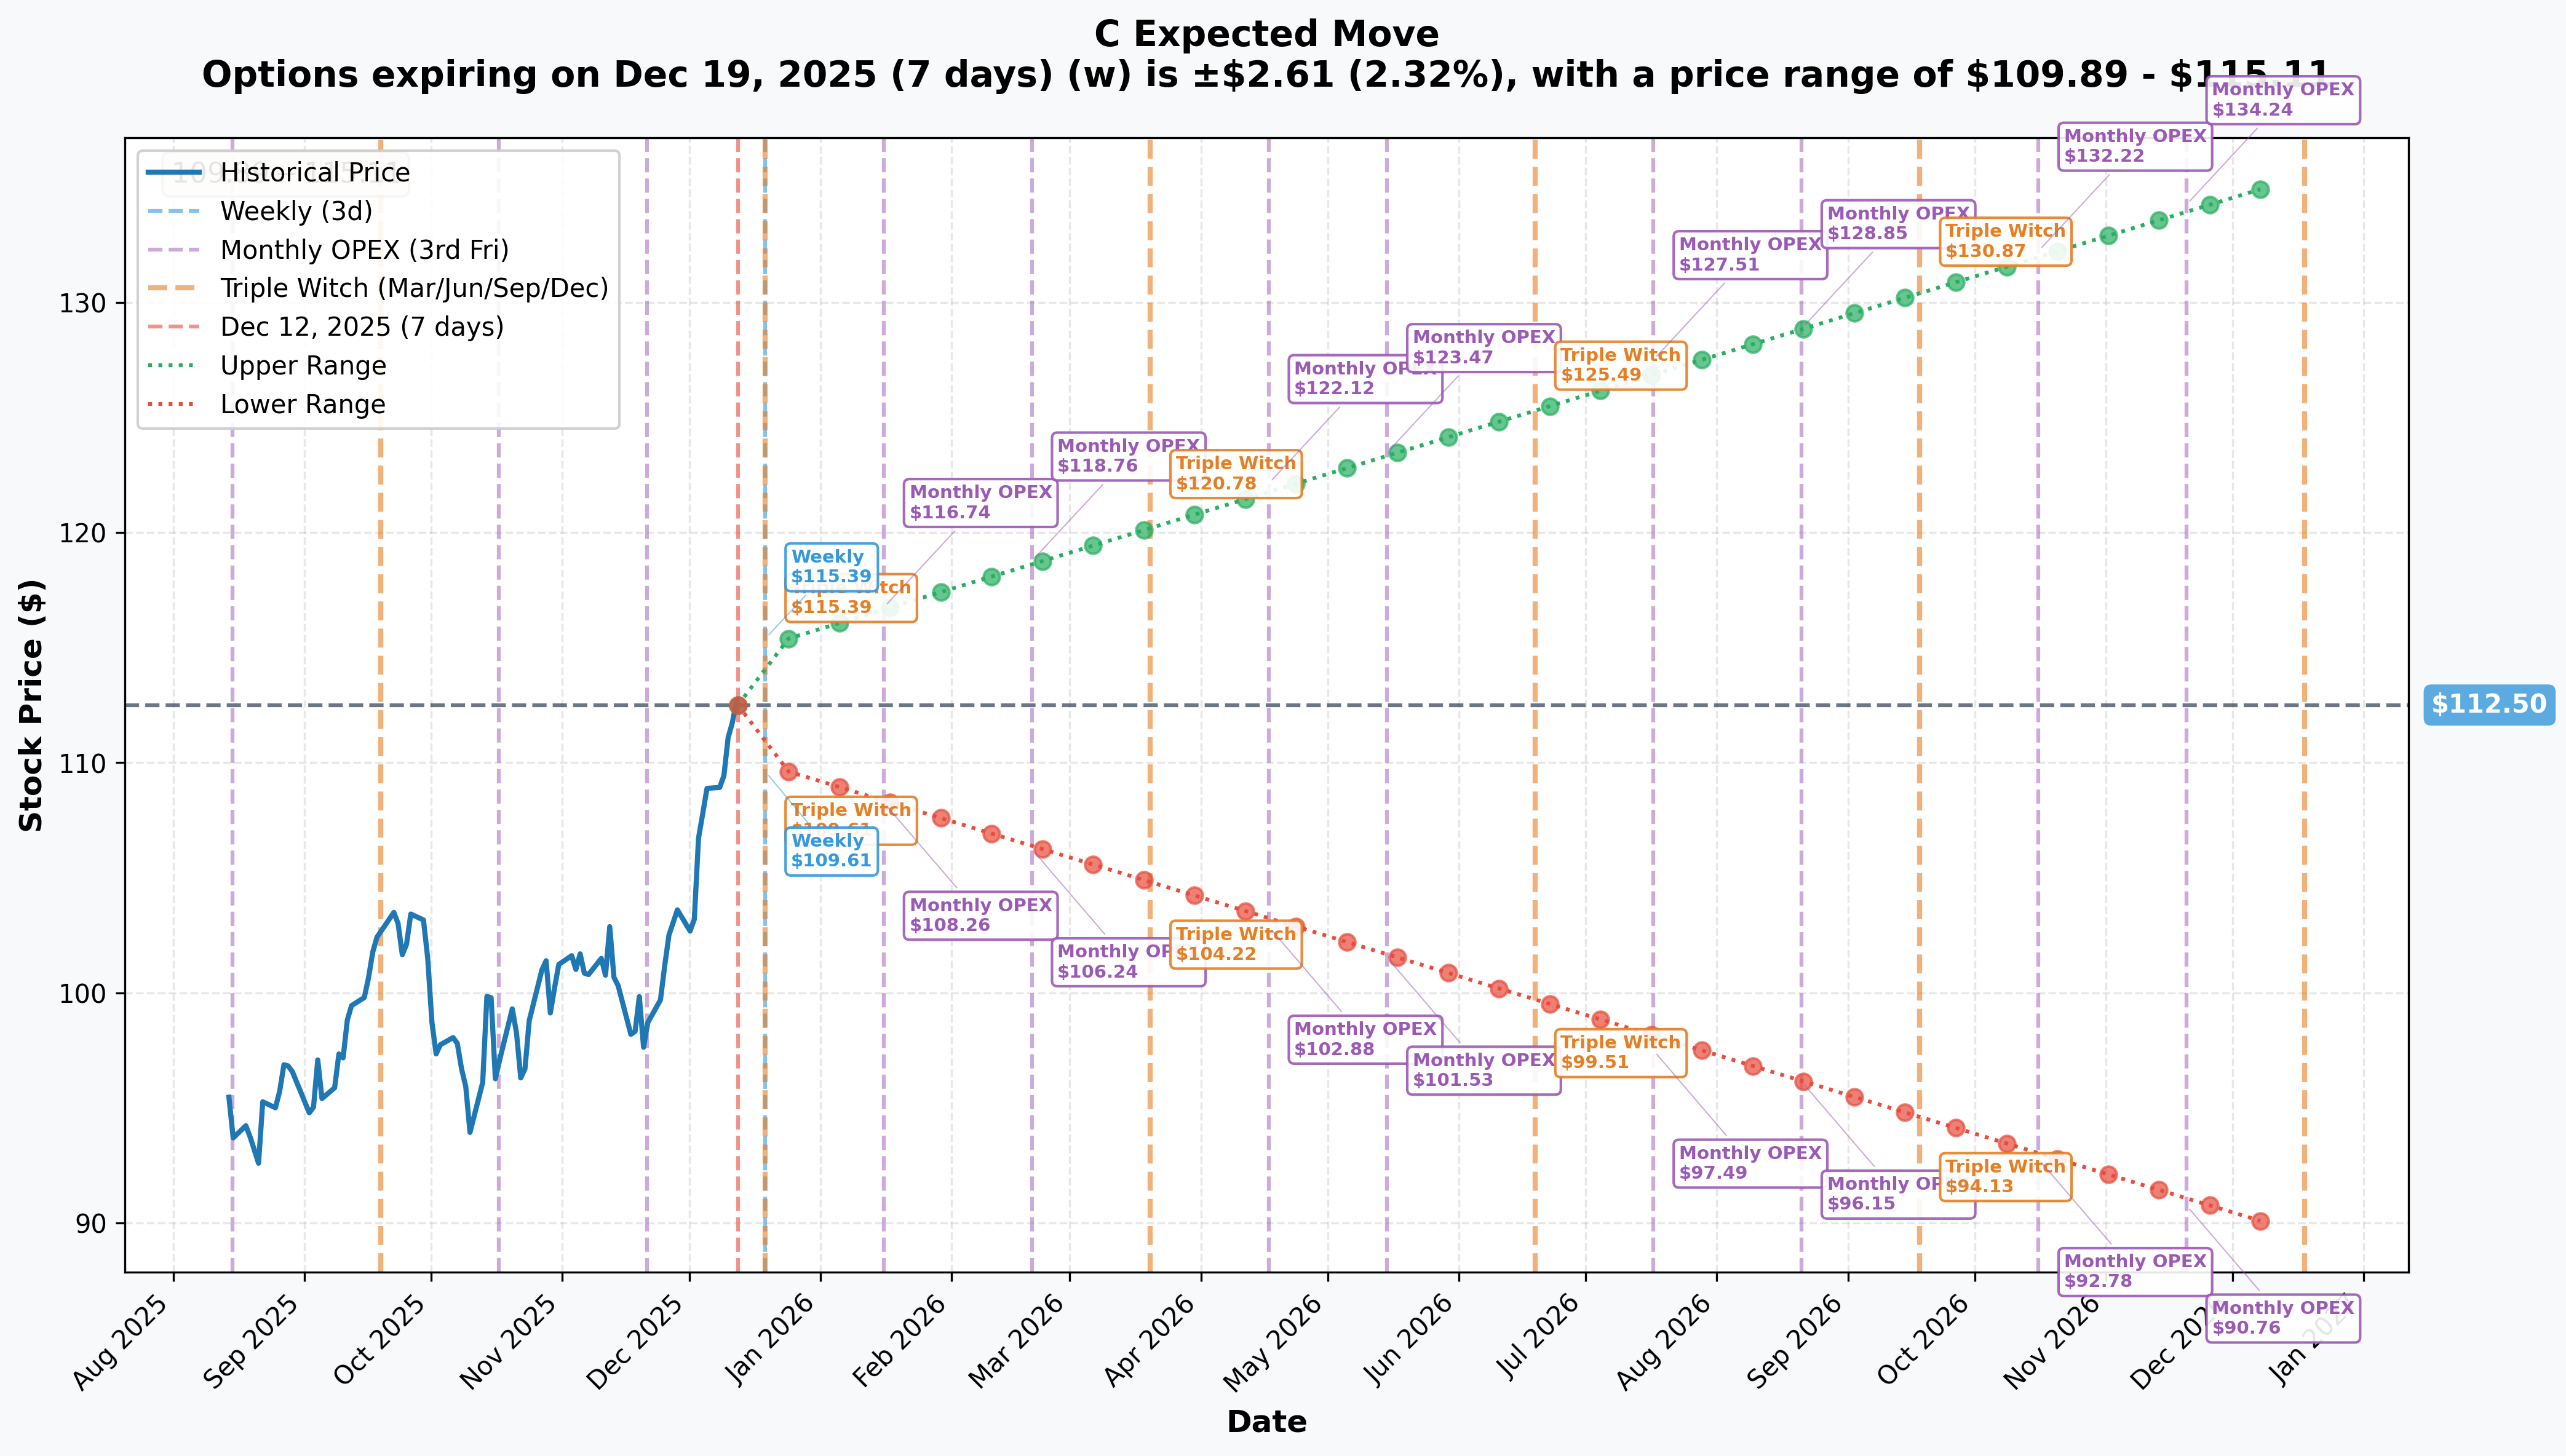
Options market pricing for upcoming expirations:
- 📅 Weekly (Dec 19 - 7 days - TRIPLE WITCH!): ±$2.61 (±2.32%) → Range: $109.89 - $115.11
- 📅 Monthly OPEX (Jan 16 - 35 days): ±$3.75 (±3.33%) → Range: $108.26 - $116.74
- 📅 Quarterly Triple Witch (Mar 20 - 98 days): ±$8.28 (±7.36%) → Range: $104.22 - $120.78
- 📅 June OPEX (Jun 19 - 189 days - FIRST TRADE EXPIRY!): ±$12.75 (±11.33%) → Range: $99.51 - $125.49
- 📅 September OPEX (Sep 18 - 280 days - SECOND TRADE EXPIRY!): ±$18.19 (±16.17%) → Range: $94.13 - $130.87
Translation for regular folks: Options traders are pricing in a modest 2.3% move ($2.61) by next week's triple witch, but expanding to 3.3% ($3.75) through January OPEX which includes Q4 earnings on January 14th. The market expects some volatility around earnings but nothing crazy for a large-cap bank stock.
For the June expiration (when the $70 strike calls expire), the implied range is $99.51 - $125.49 (±11.3%). The September expiration (when the $72.50 strike calls expire) projects an even wider $94.13 - $130.87 range (±16.2%).
Key insight: Even at the LOWER end of these ranges ($99.51 June, $94.13 Sept), both call strikes ($70, $72.50) remain deeply in-the-money and profitable. The call buyer has enormous cushion - stock could drop 15-20% and these positions would still be profitable. That's the beauty of deep ITM positioning!
🎪 Catalysts
🔥 Upcoming Catalysts (Next 6 Months)
Q4 2025 Earnings - January 14, 2026 (32 DAYS AWAY!) 📊
Citigroup reports fiscal Q4 results on Tuesday, January 14, 2026 before market open. This is THE near-term catalyst that could validate or challenge the current rally. Wall Street consensus:
- 📊 Full Year 2025 EPS: $7.47 (up 25.6% YoY) vs $5.95 in FY 2024
- 💰 Full Year 2026 EPS: $9.34 (up 25% YoY) from 2025
- 🎯 Revenue target: Company guided to exceed $84B for full year 2025
- 📈 ROTCE target: Management targeting 10-11% ROTCE for 2026 (currently at 9.7%)
Historical beat rate: Citigroup exceeded Wall Street earnings estimates in each of the last 4 quarters - Q4 2024 beat by 7.2%. Track record suggests high probability of another beat.
Why this earnings matters for the call trade: Strong Q4 results and bullish 2026 guidance would validate the deep ITM positioning and could accelerate the stock toward the $120-125 range by mid-2026. The call buyer is positioned to capture the full move with leveraged exposure.
Capital Return Actions (Ongoing Through 2026) 💰
Citigroup's aggressive capital return program approved after passing 2025 Fed stress tests:
- 💵 Dividend increased: To $0.60/share from $0.56/share (+7.1% YoY) - annual yield ~2.16%
- 🔄 $20B buyback program: Launched January 2025, $3.75B repurchased YTD, $5B in Q3 alone
- 📊 Reduced stress capital buffer: From 4.1% to 3.6%, enabling more aggressive capital returns
- 🎯 CET1 ratio: Ended Q3 at 13.2% (over 100bps above requirement) - plenty of capacity for more buybacks
Why this matters: Share buybacks reduce float, supporting price appreciation. With $16.25B remaining in buyback authorization, consistent buying pressure through mid-2026 provides tailwind for these long-dated calls.
CFO Transition - March 2026 👔
CFO Mark Mason stepping down, succeeded by Gonzalo Luchetti (Head of U.S. Personal Banking) in March 2026:
- ✅ Continuity signal: Internal promotion suggests stability, not concern
- 📈 Luchetti's track record: Led U.S. Personal Banking to 12 consecutive quarters of positive operating leverage
- 🎯 Transformation continuity: Key player in Fraser's cost-cutting ($2.5B target)
- ⏰ Timing: March transition falls within the June call expiration window
Transformation Milestones (Q1-Q2 2026) 🏭
CEO Jane Fraser's restructuring delivering tangible results:
- 🏆 Named Euromoney's "Banker of the Year 2025" for decisive transformation
- 📊 All five business segments achieved record Q3 revenues
- 💰 On track for $2.5B in cost savings (reducing management layers from 13 to 8)
- 🌍 Completed exits from 14 international consumer markets, balance sheet de-risking ongoing
- 📈 Achieved positive operating leverage in every segment in 2024
Investment Banking Market Share Gains 🎯
Citigroup gaining ground in key investment banking segments:
- 🥉 Debt Capital Markets: #3 in US high yield and investment grade (8.2% share); 7.4% loans share
- 📊 M&A wallet share: Up 64 basis points from 2023 (while top 3 peers lost ~190bps cumulatively)
- 💪 Market share momentum: +79 basis points in investment grade bonds and loans
- 🏆 Awards: Euromoney's World's Best Investment Bank for Financing 2025
- 🌊 M&A tailwind: Global M&A volumes jumped 40% in summer 2025 vs prior year (strongest since 2021)
Strategic Partnership: Apollo Private Credit - December 2025 🤝
Exclusive $25B private credit/direct lending program with Apollo combining Citi's client reach with Apollo's capital base:
- 💰 $25B program: Taps into explosive private credit market (expected $2T+ by 2027)
- 🎯 Fee income opportunity: Generates advisory and arrangement fees without balance sheet risk
- 📈 Differentiation: Positions Citi uniquely vs peers in high-growth segment
- ⏰ Timing: Announced recently, ramp expected through Q1-Q2 2026
United Fintech Strategic Investment - December 10-11, 2025 🇬🇧
Strategic investment in UK-based United Fintech alongside Barclays, Standard Chartered, BNP Paribas, Danske Bank:
- 🌐 Innovation play: Positions in fintech infrastructure/technology
- 🤝 Consortium strength: Partnering with other major banks shows strategic alignment
- 📅 Just announced: December 10-11, 2025 (2 days ago!) - very fresh catalyst
📊 Past Catalysts (Already Happened - Context)
Q3 2025 Results - October 2025 (CRUSHED IT!) ✅
Record-breaking quarter that drove the recent rally:
- 💰 Revenue: $22.09B (up 9% YoY), beating estimates of $21.05B
- 🎯 Adjusted EPS: $2.24, crushing consensus of $1.75 by 28%
- 📈 Stock reaction: Up 3.89% following announcement, started rally to current levels
- 🏆 All five segments: Record third-quarter revenues across the board
- 💪 Services division: +7% revenue; AUCA grew 13% to nearly $30 trillion
- 📊 Markets segment: +15% revenue driven by 40% increase in prime balances
- 💳 Banking fees: +17% due to record equity prices and CEO confidence
- 🏦 Wealth segment: +8% revenue, $18.6B net new investment assets
- 🇺🇸 U.S. Personal Banking: $5.3B revenue, 12 consecutive quarters positive operating leverage
2025 Fed Stress Test - Passed with Flying Colors 🎓
Reduced Stress Capital Buffer enables aggressive capital return:
- ✅ SCB reduced: From 4.1% to 3.6% (substantial improvement)
- 📊 Projected CET1 ratio: 10.4% (more than double the 4.5% minimum)
- 🎯 Stress scenario survived: 10% unemployment, 33% home price drop, 50% equity decline
- 💪 Actual Q3 CET1: 13.2% (over 100bps above requirement)
- 🎉 Enabled actions: $20B buyback program and dividend increase approved
Analyst Upgrades Throughout 2025 📈
Strong Wall Street conviction supporting higher prices:
- Consensus rating: Moderate Buy (11 buy ratings, 5 hold, 0 sell)
- Average 12-month target: $115.10 (range: $104.50 - $134.00) - implies +2.6% from current
- Morgan Stanley: Raised target to $134 (Sep 29) - highest on Street
- Wells Fargo: Raised to $125 from $115 (Sep 16) citing stronger growth potential
- Keefe, Bruyette & Woods: Price target $118 (Oct 17)
- BofA: Raised to $100 (June 26), bullish on transformation
🎲 Price Targets & Probabilities
Using gamma levels, implied move data, and catalysts through the June/September expirations, here are the scenarios:
📈 Bull Case (40% probability)
Target: $125-135 by June/September 2026
How we get there:
- 💪 Q4 earnings (Jan 14) BEAT expectations - EPS $7.50+ vs $7.47 consensus, revenue exceeds $84B guidance
- 🚀 2026 guidance raises bar: ROTCE 11-12% (vs 10-11% target), revenue growth 8-10%
- 💰 Buyback accelerates: $7-8B repurchased in H1 2026 (vs $5B in Q3 alone)
- 📊 Investment banking fees surge 20%+ on continued M&A/IPO strength
- 🤝 Apollo partnership generates $500M+ in quarterly fees by Q2 2026
- 🌍 Markets segment momentum continues: Prime balances up another 30-40%
- 💳 Wealth segment crosses $2 trillion in client investment assets
- 📈 Operating leverage expands across all five segments
- 🎯 Transformation delivers full $2.5B cost savings ahead of schedule
- 🏆 Market share gains accelerate in banking (top 3 in all DCM categories)
Critical support breaking points:
- Breakout above $115 gamma resistance (36.13B) triggers momentum to $120
- $120 breakthrough opens path to $125-130 (analyst target zone)
- Valuation re-rates from 13.3x P/E toward peer average 14.3x
For these calls:
- $70 strike June calls: Intrinsic value $55-65 (vs $44.10 paid) = $10-20 profit/share (+23-45% ROI)
- $72.50 strike Sept calls: Intrinsic value $52.50-62.50 (vs $42.10 paid) = $10-20 profit/share (+24-48% ROI)
Why 40% probability: Transformation momentum is REAL - 4 consecutive earnings beats, record business performance, regulatory relief, and aggressive buybacks. However, requires continued flawless execution. Upside case well-supported by fundamentals.
🎯 Base Case (45% probability)
Target: $105-120 range through mid-2026
Most likely scenario:
- ✅ Solid Q4 earnings meeting/slightly beating consensus (~$7.45-7.55 EPS)
- ⚖️ 2026 guidance meets expectations (ROTCE 10-11% as guided, revenue growth 5-7%)
- 🔄 Buyback continues at $5-6B per quarter pace ($10-12B through June)
- 📊 Investment banking solid but not spectacular - market share maintained
- 🌐 Macro environment supportive but not euphoric (Fed on pause, no recession)
- 💼 Apollo partnership ramps gradually (not immediate blockbuster)
- 📈 Stock trades in $105-120 band, respecting $110 gamma support and $115-120 resistance
- 🇨🇳 No major negative surprises (China, regulatory, competitive)
- ⚖️ Valuation holds 13-14x P/E range (fair value for transformation story)
This is the call buyer's base case: Stock grinds higher toward $115-120 by mid-2026, calls gain modest profit from time value decay offset by intrinsic value gains. Not a home run, but solid risk-adjusted return.
For these calls:
- $70 strike June calls: Stock at $115 = $45 intrinsic (vs $44.10 paid) = breakeven to small profit
- $72.50 strike Sept calls: Stock at $118 = $45.50 intrinsic (vs $42.10 paid) = $3.40 profit (+8% ROI)
Why 45% probability: Most realistic scenario. Transformation is working but stock already up 51% YTD - much of the easy gains captured. Continued progress likely keeps stock supported in $105-120 range, but explosive moves require catalysts beyond "meeting expectations."
📉 Bear Case (15% probability)
Target: $90-105 (Test the Support Zones)
What could go wrong:
- 😰 Q4 earnings disappoint or weak 2026 guidance - EPS misses at $7.30, ROTCE guidance stays 9-10%
- 🚨 Transformation hits roadblocks - regulatory challenges intensify (data quality issues remain)
- 💸 Credit quality concerns emerge - loan loss provisions spike on consumer or commercial weakness
- 🌍 Macro headwinds: Recession fears, Fed forced to cut aggressively, yield curve stress
- 📉 Investment banking fees collapse if M&A/IPO window closes (market downturn)
- 🇨🇳 Geopolitical shock: China exposure issues, emerging markets crisis
- 💰 Competitive pressure: JPM, BAC gain share, Citi's momentum stalls
- 📊 Valuation compression: P/E contracts from 13.3x to 11-12x on slower growth
- 🔨 Break below $110 gamma support (43.39B) triggers technical selling to $105, then $100
Critical support levels:
- 🛡️ $110: MUST HOLD (43.39B gamma - the wall) or momentum shifts bearish
- 🛡️ $105: Secondary defense (7.32B gamma)
- 🛡️ $100: Psychological floor (1.74B gamma) - major support zone
For these calls (still protected by deep ITM!):
- $70 strike June calls: Stock at $100 = $30 intrinsic (vs $44.10 paid) = -$14.10 loss (-32% drawdown but NOT total loss!)
- $72.50 strike Sept calls: Stock at $95 = $22.50 intrinsic (vs $42.10 paid) = -$19.60 loss (-47% drawdown)
- Stock would need to drop below $70-72.50 for TOTAL loss - extremely unlikely (would be -37-40% crash!)
Why only 15% probability: Would require multiple negative catalysts aligning. Citi's fundamentals strong (13.2% CET1, positive operating leverage, market share gains), regulatory capital relief provides cushion, and buyback program supports stock. The $110 gamma wall (43.39B) is MASSIVE and creates natural buying pressure.
Key insight: Even in bear case, deep ITM structure protects capital. The call buyer maintains significant residual value unless catastrophic scenario (stock to $70-72, which is <-35% crash from current levels - extremely remote for a systemically important bank with strong capital ratios).
💡 Trading Ideas
🛡️ Conservative: Wait for January Earnings Clarity
Play: Stay on sidelines until after January 14th earnings, then enter on any pullback
Why this works:
- ⏰ Earnings in 32 days creates modest event risk (2.3% implied move) - manageable but why rush?
- 📊 Stock at $112 already up 51% YTD near highs - late to chase here
- 🎯 Better entry likely post-earnings if stock consolidates to $105-108 on profit-taking
- 📈 Transformation story remains compelling long-term, no need to chase momentum
- 🛡️ Strong $110 support (43.39B gamma) provides clear risk management level
- 💰 Can buy stock at better prices OR sell cash-secured puts at $105-110 for income
Action plan:
- 👀 Watch January 14th earnings for EPS ($7.45+ needed), revenue ($84B+ guidance confirmation), 2026 ROTCE target
- 🎯 Look for pullback to $105-108 post-earnings (would be -5-7% dip providing margin of safety)
- ✅ Buy stock at $105-108, or sell Feb $105 puts collecting premium
- 📊 IF stock breaks below $110, wait for stabilization before entering (gamma support must hold)
- ⏰ IF stock breaks OUT above $115 on earnings beat, can chase with reduced size
Risk level: Minimal (no position until setup improves) | Skill level: Beginner-friendly
Expected outcome: Avoid chasing highs. Get better entry on consolidation. Participate in transformation story with risk management.
⚖️ Balanced: Bull Put Spread (Income Strategy)
Play: Sell put spread in the gamma support zone, collecting premium while stock consolidates
Structure: Sell $110 puts, Buy $105 puts (January 16 expiration - AFTER earnings)
Why this works:
- 🎯 Targets massive $110 gamma support zone (43.39B - the wall!)
- 💰 Collect credit from elevated implied volatility pre-earnings
- 🛡️ Defined risk spread ($5 wide = $500 max risk per spread)
- 📊 Stock has 51% cushion from current price to strike (very safe)
- ⏰ 35 days captures earnings volatility crush (IV should drop post-Jan 14)
- ✅ Only at risk if C drops below $110 (breaks major support)
Estimated P&L:
- 💰 Collect ~$0.80-1.20 credit per spread (adjust based on actual IV)
- 📈 Max profit: $80-120 per spread if C stays above $110 (80-95% probability)
- 📉 Max loss: $420-380 if C drops below $105 (defined risk)
- 🎯 Breakeven: ~$109-108.80
- 📊 Risk/Reward: ~1:4 (excellent for income strategy)
Position sizing:
- Risk only 2-3% of portfolio (e.g., 5-8 spreads max)
- Can add more spreads if stock pulls back toward $110 post-earnings
Exit strategy:
- ⏰ Close at 50-70% max profit (within 2 weeks) - don't be greedy
- 🎯 IF stock approaches $110, roll down to $105/$100 spread or close for scratch
- ⚠️ IF stock breaks $110 decisively, close immediately and reassess (support failed)
Risk level: Moderate (defined risk, income-oriented) | Skill level: Intermediate
🚀 Aggressive: Copy the Trade - Buy Deep ITM Calls (ADVANCED!)
Play: Replicate the institutional positioning with smaller size
Structure: Buy $72.50 strike calls (September 18, 2026 expiration - SAME as the big trade)
Why this could work:
- 🤝 Copy smart money: Following institutional positioning that spent $45M on this thesis
- 🎯 Deep ITM protection: $72.50 strike is $39.64 below current price (huge cushion!)
- ⚖️ Stock replacement with leverage: ~100 delta means moves dollar-for-dollar with stock
- ⏰ Long duration: 280 days to expiration captures all 2026 catalysts (earnings, CFO transition, buyback, guidance raises)
- 💪 Limited downside: Stock would need to drop to $72.50 (35% crash!) for total loss - extremely unlikely
- 📊 Transformation beta: Leveraged exposure to transformation success with defined risk
Why this could disappoint (REAL RISKS):
- 💸 EXPENSIVE: Each contract costs ~$42.10 ($4,210 per contract) - substantial capital outlay
- ⏰ Time decay: Losing ~$5-6/month in extrinsic value even if stock flat ($0.15-0.20/day theta)
- 📊 Already up 51%: Late to the party - much of transformation gains captured
- 🎢 Need continued momentum: Stock must reach $120+ by Sept for meaningful profit
- 😰 Earnings risk: Jan 14 earnings could disappoint and drop stock 8-10%
- ⚠️ No dividend capture: Call holders don't receive $0.60/quarter dividends (lose ~$1.20-1.80 vs owning stock)
Estimated P&L (at September 18, 2026 expiration):
- 💰 Cost: $42.10 per contract
- 🎯 Breakeven: Stock needs to be at $114.60 (basically flat from current $112.14) after accounting for time decay
- 📈 Profit scenario: Stock at $125 = $52.50 intrinsic - $42.10 cost = $10.40 profit (+25% ROI)
- 🚀 Bull scenario: Stock at $135 = $62.50 intrinsic - $42.10 cost = $20.40 profit (+48% ROI)
- 📉 Loss scenario: Stock at $100 = $27.50 intrinsic - $42.10 cost = -$14.60 loss (-35% drawdown)
- 💀 Worst case: Stock below $72.50 = TOTAL LOSS (but requires -35% crash - very unlikely)
Breakeven dynamics:
- 📊 Stock needs to appreciate $2.46 by Sept 2026 just to breakeven after time decay
- 🎯 Every dollar above $114.60 at expiration = $1.00 profit per contract
- 💰 Effective leverage ~2.6x (control $112 stock for $42 cost)
CRITICAL WARNING - DO NOT attempt unless you:
- ✅ Have 6-12 months of trading experience with options
- ✅ Understand intrinsic vs extrinsic value and time decay
- ✅ Can afford to lose 30-50% of capital deployed (realistic worst case)
- ✅ Plan to ACTIVELY MANAGE position (take profits, roll if needed, cut losses)
- ✅ Accept you're paying $42 for $39 of intrinsic + $3 time value = expensive protection
- ⏰ Will monitor quarterly earnings and major catalysts closely
- 📊 Have plan to take partial profits at $120 (lock in gains, let rest run)
Position sizing:
- Start with 1-2 contracts max ($4,210-8,420 risk) to test thesis
- DO NOT allocate >10% of portfolio to this trade
- Consider spreading across both expirations (some June $70s, some Sept $72.50s)
Risk level: HIGH (expensive premium, need continued momentum) | Skill level: Advanced only
Probability of profit: ~60% (needs stock above $114.60 by Sept - modest appreciation required but not guaranteed)
⚠️ Risk Factors
Don't get caught by these potential landmines:
-
⏰ January 14 earnings binary event: Q4 results before market open create modest volatility (2.3% implied move). While not as dramatic as tech earnings, stock could gap $2-3 either direction based on EPS ($7.47 consensus), revenue ($84B+ guidance), and 2026 ROTCE guidance (10-11% target). Historical 4-quarter beat streak creates high expectations - any disappointment magnified.
-
📊 Transformation execution risk: Citi warned in 10-K filing that they "may continue to experience significant challenges in progressing the transformation and satisfying regulators' expectations in both sufficiency and timing, particularly regarding data quality management and regulatory reporting." Conservative analysts like Evercore ISI maintain $87 target citing these regulatory headwinds. The $2.5B cost savings execution is complex and could face delays.
-
💸 Valuation at cycle highs: Trading at 13.3x forward P/E vs historical average 10-12x, near 52-week highs after 51% YTD gain. While cheaper than WFC (14.3x) and BAC (14.1x), stock is priced for CONTINUED transformation success. Multiple could compress to 11-12x if growth disappoints, sending stock back to $95-100 (-10-15%) even without fundamental deterioration.
-
💰 Net interest margin pressure: Fed rate cuts (three cuts in 2025, potentially one in 2026) compress NIM for banks. While loan growth can offset, sustained low rate environment challenges profitability. Citi Wealth forecasts Fed funds bottoming around 3.5-4% - lower for longer than expected could pressure earnings.
-
🌍 China/EM exposure risk: Approximately 15-20% of revenue from China and emerging markets. Geopolitical tensions, EM currency volatility (Fed rate cuts strengthen dollar, hurting EM), or China slowdown could impact results. Already exited 14 consumer markets but wholesale/institutional exposure remains.
-
⚖️ JPMorgan competitive dominance: JPM maintains leadership in investment banking fees and overall market position. Despite Citi's +64bps M&A share gain, JPM's moat (scale, technology, talent) remains formidable. Citi needs to PROVE it can sustain share gains, not just take temporary wins during a hot M&A market.
-
🏦 Banamex divestiture uncertainty: After declining $9.3B bid from Grupo Mexico in October 2025, Citi plans IPO for remaining stake. Execution risk remains - UBS flags concerns about Banamex performance. Any valuation disappointment or delayed exit could create overhang.
-
📊 Gamma ceiling at $115 limits upside: Massive 36.13B call gamma at $115 strike means market makers will mechanically SELL stock into rallies to hedge. This creates significant overhead resistance. Would need sustained institutional buying and earnings beat to break through. Current setup suggests $110-115 trading range until major catalyst.
-
🎢 Market volatility concerns: Citi's own strategists warn investors should prepare for more volatility in 2025 given high valuations (S&P 500 baseline target 6,500; bearish scenario 5,100). Broad market correction would drag financials lower regardless of Citi-specific fundamentals. If S&P drops 10-15%, Citi could fall 15-20% given cyclical beta.
-
📉 Technical weakness signals: Despite analyst optimism, technical indicators show weakness: Low ROA (0.15%), high EV/EBIT (45.21x), weak liquidity (5.02% cash/market value), negative fund flows (inflow ratio 0.4898). Bearish engulfing pattern flagged with 63.64% historical win-rate. Technical score 3.65 suggests caution.
-
💵 Deep ITM premium erosion risk: For these specific calls, paying $44.10 for the June $70s when stock at $112.14 means $42.14 intrinsic + $1.96 extrinsic. That $1.96 decays to zero by expiration (~$0.01/day theta bleed). Even if stock stays flat, lose that extrinsic value. The Sept $72.50s at $42.10 have $39.64 intrinsic + $2.46 extrinsic = similar decay risk.
-
🚨 Institutional exit risk: If the $45M buyer decides thesis is wrong (earnings disappoint, transformation stalls, macro deteriorates), they can exit by selling these calls back to the market. Given size (10,600 contracts), their exit could temporarily depress call prices and signal bearish turn. Retail following smart money needs to watch for position unwinds.
🎯 The Bottom Line
Real talk: Someone just committed $45 MILLION to long-dated Citigroup calls using a sophisticated deep ITM structure. This isn't speculative gambling - this is a major institutional player positioning for continued transformation success through mid-to-late 2026 with leveraged but protected exposure.
What this trade signals:
- 🎯 High conviction in Fraser's transformation delivering results through 2026
- 💰 Belief that Q4 earnings (Jan 14) and 2026 guidance will support higher prices
- 📊 Confidence in buyback program and capital return sustaining stock
- ⚖️ Smart risk management: Deep ITM structure protects against 30-35% downside (extremely unlikely for bank with 13.2% CET1)
- ⏰ Strategic timeframe: June and September expirations capture all major 2026 catalysts
This is NOT a "stock going to the moon" trade - it's a "transformation is working and stock grinds 10-20% higher over 6-9 months" trade. The deep ITM structure suggests the buyer wants stock-like exposure with leverage but WITHOUT the volatility risk of at-the-money options.
If you own C stock:
- ✅ HOLD and enjoy the ride - transformation momentum is real (record Q3, beat streak, buybacks)
- 📊 Set mental stop at $110 (massive 43.39B gamma support) to protect gains if trend breaks
- 💰 Consider trimming 10-20% if stock breaks above $120 to lock in profits, let rest run
- 🎯 Target exit zone $125-135 (analyst targets) for full position, or hold for multi-year story
- 🛡️ If nervous, sell covered calls at $115-120 to generate income and cap upside
- ⏰ Watch January 14 earnings closely - any disappointment should trigger reassessment
If you're watching from sidelines:
- ⏰ Wait for January 14 earnings - no need to chase $112 after 51% YTD run
- 🎯 Post-earnings pullback to $105-108 would be EXCELLENT entry (gamma support zone, 8-12% margin of safety)
- 📈 Looking for confirmation: EPS $7.50+, 2026 ROTCE guidance 11-12%, buyback acceleration
- 💡 Alternative: Sell $110 puts for income, get paid to potentially own at $110 (massive support)
- 🚀 IF stock breaks $115 on earnings beat with strong guidance, can chase with reduced size
- 📊 Long-term (12-24 months), transformation story remains compelling for $125-135 targets
If you're bearish:
- ⚠️ Don't fight this momentum into earnings - 51% YTD, 4-quarter beat streak, buyback support
- 🎯 First realistic short setup is AFTER earnings if stock fails at $115 resistance
- 📉 Watch for break below $110 (43.39B gamma wall) - that's the trigger for cascade to $105, then $100
- 🛡️ Deep ITM calls have $30-40 downside protection - you'd need catastrophic move to hurt these buyers
- ⏰ Better risk/reward waiting for $115-120 to SHORT or buy puts, not fighting at $112
Key dates to watch:
- 📅 December 19 - Weekly triple witch expiration (implied move ±$2.61)
- 📅 January 14, 2026 (Tuesday) before open - Q4 FY2025 earnings (THE BIG ONE!)
- 📅 January 16 - Monthly OPEX
- 📅 March 2026 - CFO transition (Mark Mason → Gonzalo Luchetti)
- 📅 June 18, 2026 - First call trade expiration ($70 strike)
- 📅 September 18, 2026 - Second call trade expiration ($72.50 strike)
Final verdict: Citigroup's transformation story is REAL and delivering results:
- ✅ Record Q3 revenues across all five segments
- ✅ 28% earnings beat in Q3 2025
- ✅ Regulatory capital relief enabling $20B buyback
- ✅ Investment banking share gains (+64bps in M&A)
- ✅ Strong capital ratios (13.2% CET1)
- ✅ $2.5B cost savings on track
BUT, at $112 after 51% YTD gain with Q4 earnings in 32 days, the risk/reward for CHASING is poor. The $45M institutional bet shows smart money is positioned, but they got in over time at various levels - not chasing the top.
Be patient. Let earnings provide direction. The transformation will continue whether you buy today or in 4 weeks at better prices. Your capital, your timeline. Don't let FOMO drive decisions. 💪
If the institutional thesis is correct and stock reaches $125-135 by mid-2026, buying at $105-108 post-earnings pullback vs chasing $112 today is a 7-10% better entry that dramatically improves your risk/reward. Smart money positioned early. Retail can wait for confirmation.
Disclaimer: Options trading involves substantial risk of loss and is not suitable for all investors. This analysis is for educational purposes only and not financial advice. Deep in-the-money options have different risk profiles than at-the-money options - consult a financial professional. Past performance (4-quarter beat streak) doesn't guarantee future results. The institutional buyer may have complex hedging needs, portfolio constraints, or information not available to retail traders. Always do your own research and never risk more than you can afford to lose. Banks are cyclical businesses exposed to macro, credit, and regulatory risks beyond their control.
About Citigroup Inc.: Citigroup is a global financial-services company doing business in more than 100 countries and jurisdictions, operating through five main divisions: services, markets, banking, US personal banking, and wealth management, with a market cap of $199.9 billion in the National Commercial Banks industry.