🐋 C - Big Money Bets $2M That Citigroup Breaks Above $115 Before April Earnings!
📅 March 27, 2026 | 🔥 Unusual Activity Detected
🎯 The Quick Take
Someone just dropped $2 MILLION on Citigroup $115 calls expiring April 17 - that's 9,998 contracts betting Citi rallies +6.4% in just 21 days, right into the bank's Q1 2026 earnings on April 14. With volume hitting 1.45x existing open interest on a brand-new Buy-to-Open position, this is fresh institutional conviction money entering the stock at today's lows - not a hedge, not a roll. Big banks don't write $2M checks without a reason, and this one smells like a pre-earnings catalyst play.
📊 Company Overview
Citigroup (C) is one of the four largest U.S. banks by assets, operating globally across investment banking, consumer banking, wealth management, and institutional services:
- 🏦 What they do: Global bank providing investment banking, markets, wealth management, and consumer banking across 160+ countries - the most internationally-diversified U.S. bank
- 💰 Market Cap: ~$196.6B
- 🏢 Exchange: NYSE
- 📊 Current Price: $108.12
- 🔄 Big Story: A multi-year transformation under CEO Jane Fraser is ~80% complete, and a $4 trillion BlackRock ETF middle-office mandate just validated Citi's fee-based services pivot. Q1 2026 earnings on April 14 are the next major checkpoint
💰 The Option Flow Breakdown
📊 The Tape
| Time | Symbol | Side | Buy/Sell | Type | Expiration | Premium | Strike | Volume | OI | Size | Spot | Option Price | Option Symbol |
|---|---|---|---|---|---|---|---|---|---|---|---|---|---|
| 12:39:50 | C | MID | BUY | CALL $115 | 2026-04-17 | $2M | $115 | 11K | 7.6K | 9,998 | $108.12 | $1.96 | C20260417C115 |
🤓 What This Actually Means
Let me break this down in plain English:
- 💸 $2 million spent: 9,998 contracts at $1.96 each ($1.96 x 100 shares x 9,998 = ~$1.96M)
- 📈 Strike $115 is 6.4% above current price - out-of-the-money but not wildly distant for a bank with multiple near-term catalysts
- ⏰ 21 days to expiration (April 17, 2026) - this is a short-dated, high-conviction directional bet with Q1 earnings on April 14 squarely in the window
- 📊 Volume/OI ratio = 1.45x - volume exceeded the existing open interest of 7,600, confirming this is a Buy-to-Open (new position entering, not closing out existing trades)
- 🤝 MID fill - executed at the midpoint of the bid-ask spread, the hallmark of a sophisticated institutional trader negotiating, not a retail market order
- 🎯 Breakeven at expiration: $116.96 ($115 strike + $1.96 premium paid) = needs a +8.2% rally from current levels by April 17
- 🔥 Z-Score: 15.0 (EXTREMELY UNUSUAL) - this trade is flagged as far outside normal flow patterns for this strike and timeframe. Trades scoring this high appear only a handful of times per year for any given contract
What's the thesis here?
This trader is betting that Citi's Q1 2026 earnings on April 14 deliver a strong enough beat to push the stock through $115 and toward the gamma resistance cluster before the April 17 expiration - literally three trading days after the earnings report drops. At $1.96 per share, they're paying about 1.8% of Citi's stock price for 21 days of upside optionality. Cheap in dollar terms, but the clock is ticking fast.
Why $115? The strike is the single largest call gamma resistance level (16.2B total gamma exposure per the GEX data) and sits right at the midpoint of the implied move upper range ($116.89) for the April 17 expiration. This trader is essentially betting that a strong earnings print closes the gap between today's $108 price and the gamma wall at $115 - a level where serious supply sits, but also where a strong catalyst could spark a gamma squeeze higher.
📈 Technical Setup / Chart Check-Up
YTD Performance
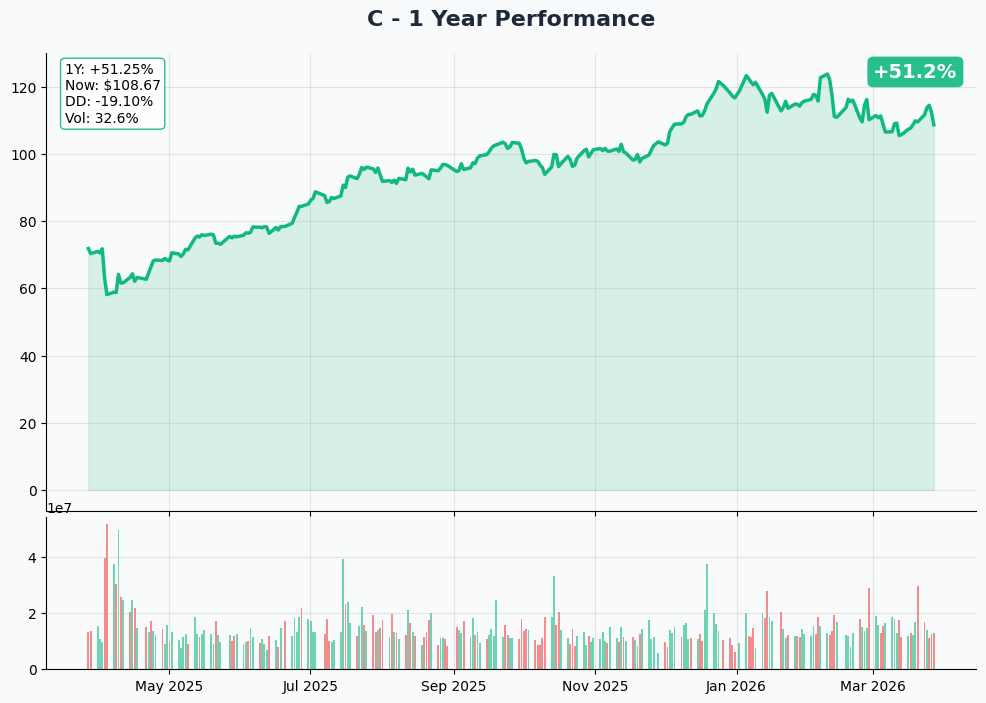
Citigroup has had a volatile 2026 so far:
- 📉 Down ~11% from its 52-week high of $125.16 - the stock hit peak levels earlier in the year and has been in a cooling pattern
- 📈 +60.7% over the past year (from ~$67.95 in March 2025) - the multi-year transformation narrative has driven a massive re-rating
- 🚀 Two-day bounce: Surged +3.98% on March 24 (BlackRock ETF mandate) and another +3.08% on March 25 (Jefferies upgrade to Strong-Buy with $135 target)
- 📊 Current price of $108.12 sits in a $107-$115 range defined by recent trading activity - right at the lower end of a near-term consolidation channel
- 💡 The setup: Stock is consolidating after a sharp pullback from highs, but fresh institutional buying (BlackRock mandate, analyst upgrades) is forming a potential floor ahead of April earnings
Key takeaway: Citi is in a reset phase - down from highs but gathering momentum from positive catalysts. The $108-$110 range is becoming a support base, and the $115 level is the clear line to watch for a breakout.
Gamma-Based Support & Resistance Analysis
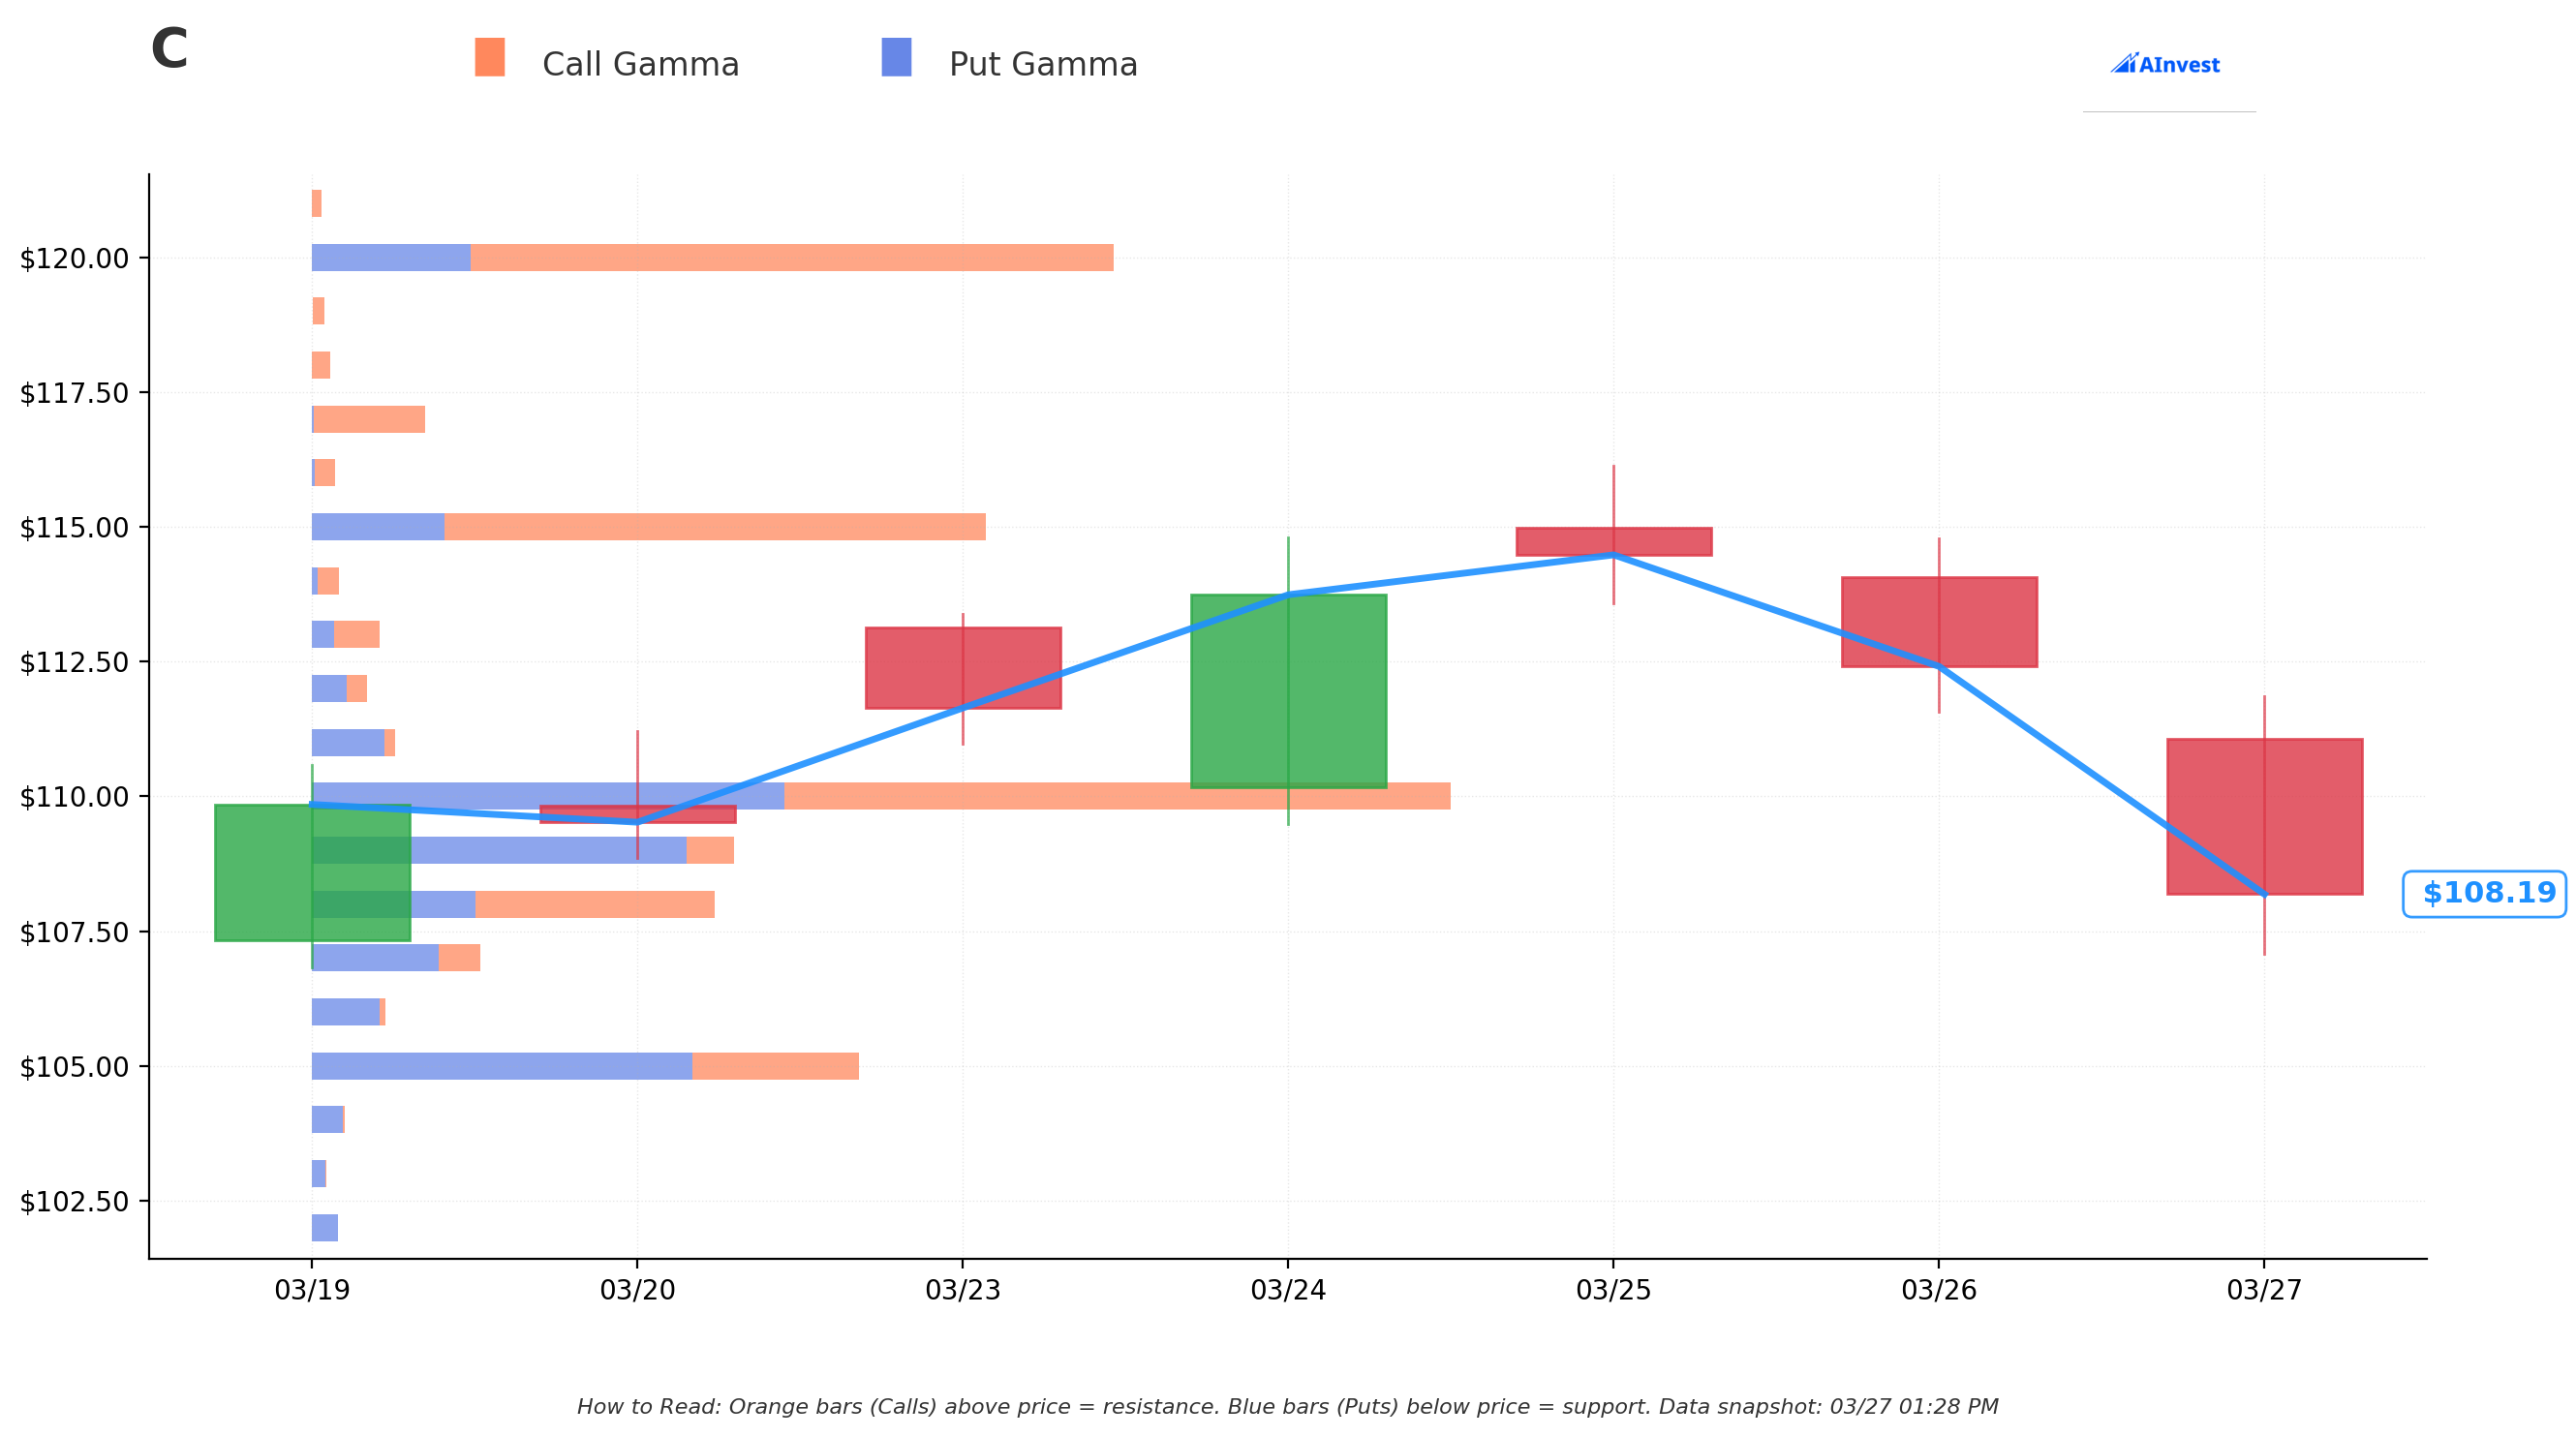
Current Price: $108.12
The gamma exposure map shows where market makers have concentrated positions, creating natural price magnets and barriers:
🔵 Support Levels (Put Gamma Below Price):
- $108 - Immediate support right at the current price with 10.3B total gamma exposure - this is literally the floor right now
- $105 - Strongest nearby support with 13.4B total gamma (the biggest blue bar) - market makers have heavy put protection here, acting as a very strong cushion
- $100 - Major psychological and technical support at 12.2B gamma - a round-number gravitational pull
- $95 - Extended support at 5.5B gamma (about 12% below current price)
- $90 - Deep floor at 4.8B gamma - this is where the bears would need to push for a real breakdown
🟠 Resistance Levels (Call Gamma Above Price):
- $109 - First overhead resistance at 9.3B gamma (less than 1% above - very near-term ceiling)
- $110 - DOMINANT resistance with 26.7B total gamma - the biggest orange bar on the chart, this is the key near-term hurdle that the stock needs to clear
- $115 - Strong resistance at 16.2B gamma - this is THE STRIKE on the big trade. Once C pushes through $110, the next wall is right at $115
- $120 - Extended resistance at 19.4B gamma - post-breakout target zone
- $125 - Light resistance at 7.1B gamma (the 52-week high area)
What this means for traders:
The battle in Citigroup right now is at $108-$110. The $110 strike has the heaviest call gamma concentration of any level on the board - 26.7B. Getting through $110 is the prerequisite for the $115 call trade to come to life. Here's the playbook: if Q1 earnings are strong enough to punch through $110, the next magnet is $115 (where this whale put their strike). A close above $115 into OPEX would trigger serious gamma hedging pressure from market makers that could accelerate the move.
Net GEX Bias: Bullish - overall dealer positioning leans bullish, meaning the floor tends to hold more easily than the ceiling breaks. This supports the idea that $105 is a hard support and $108 is reasonable accumulation territory.
Implied Move Analysis
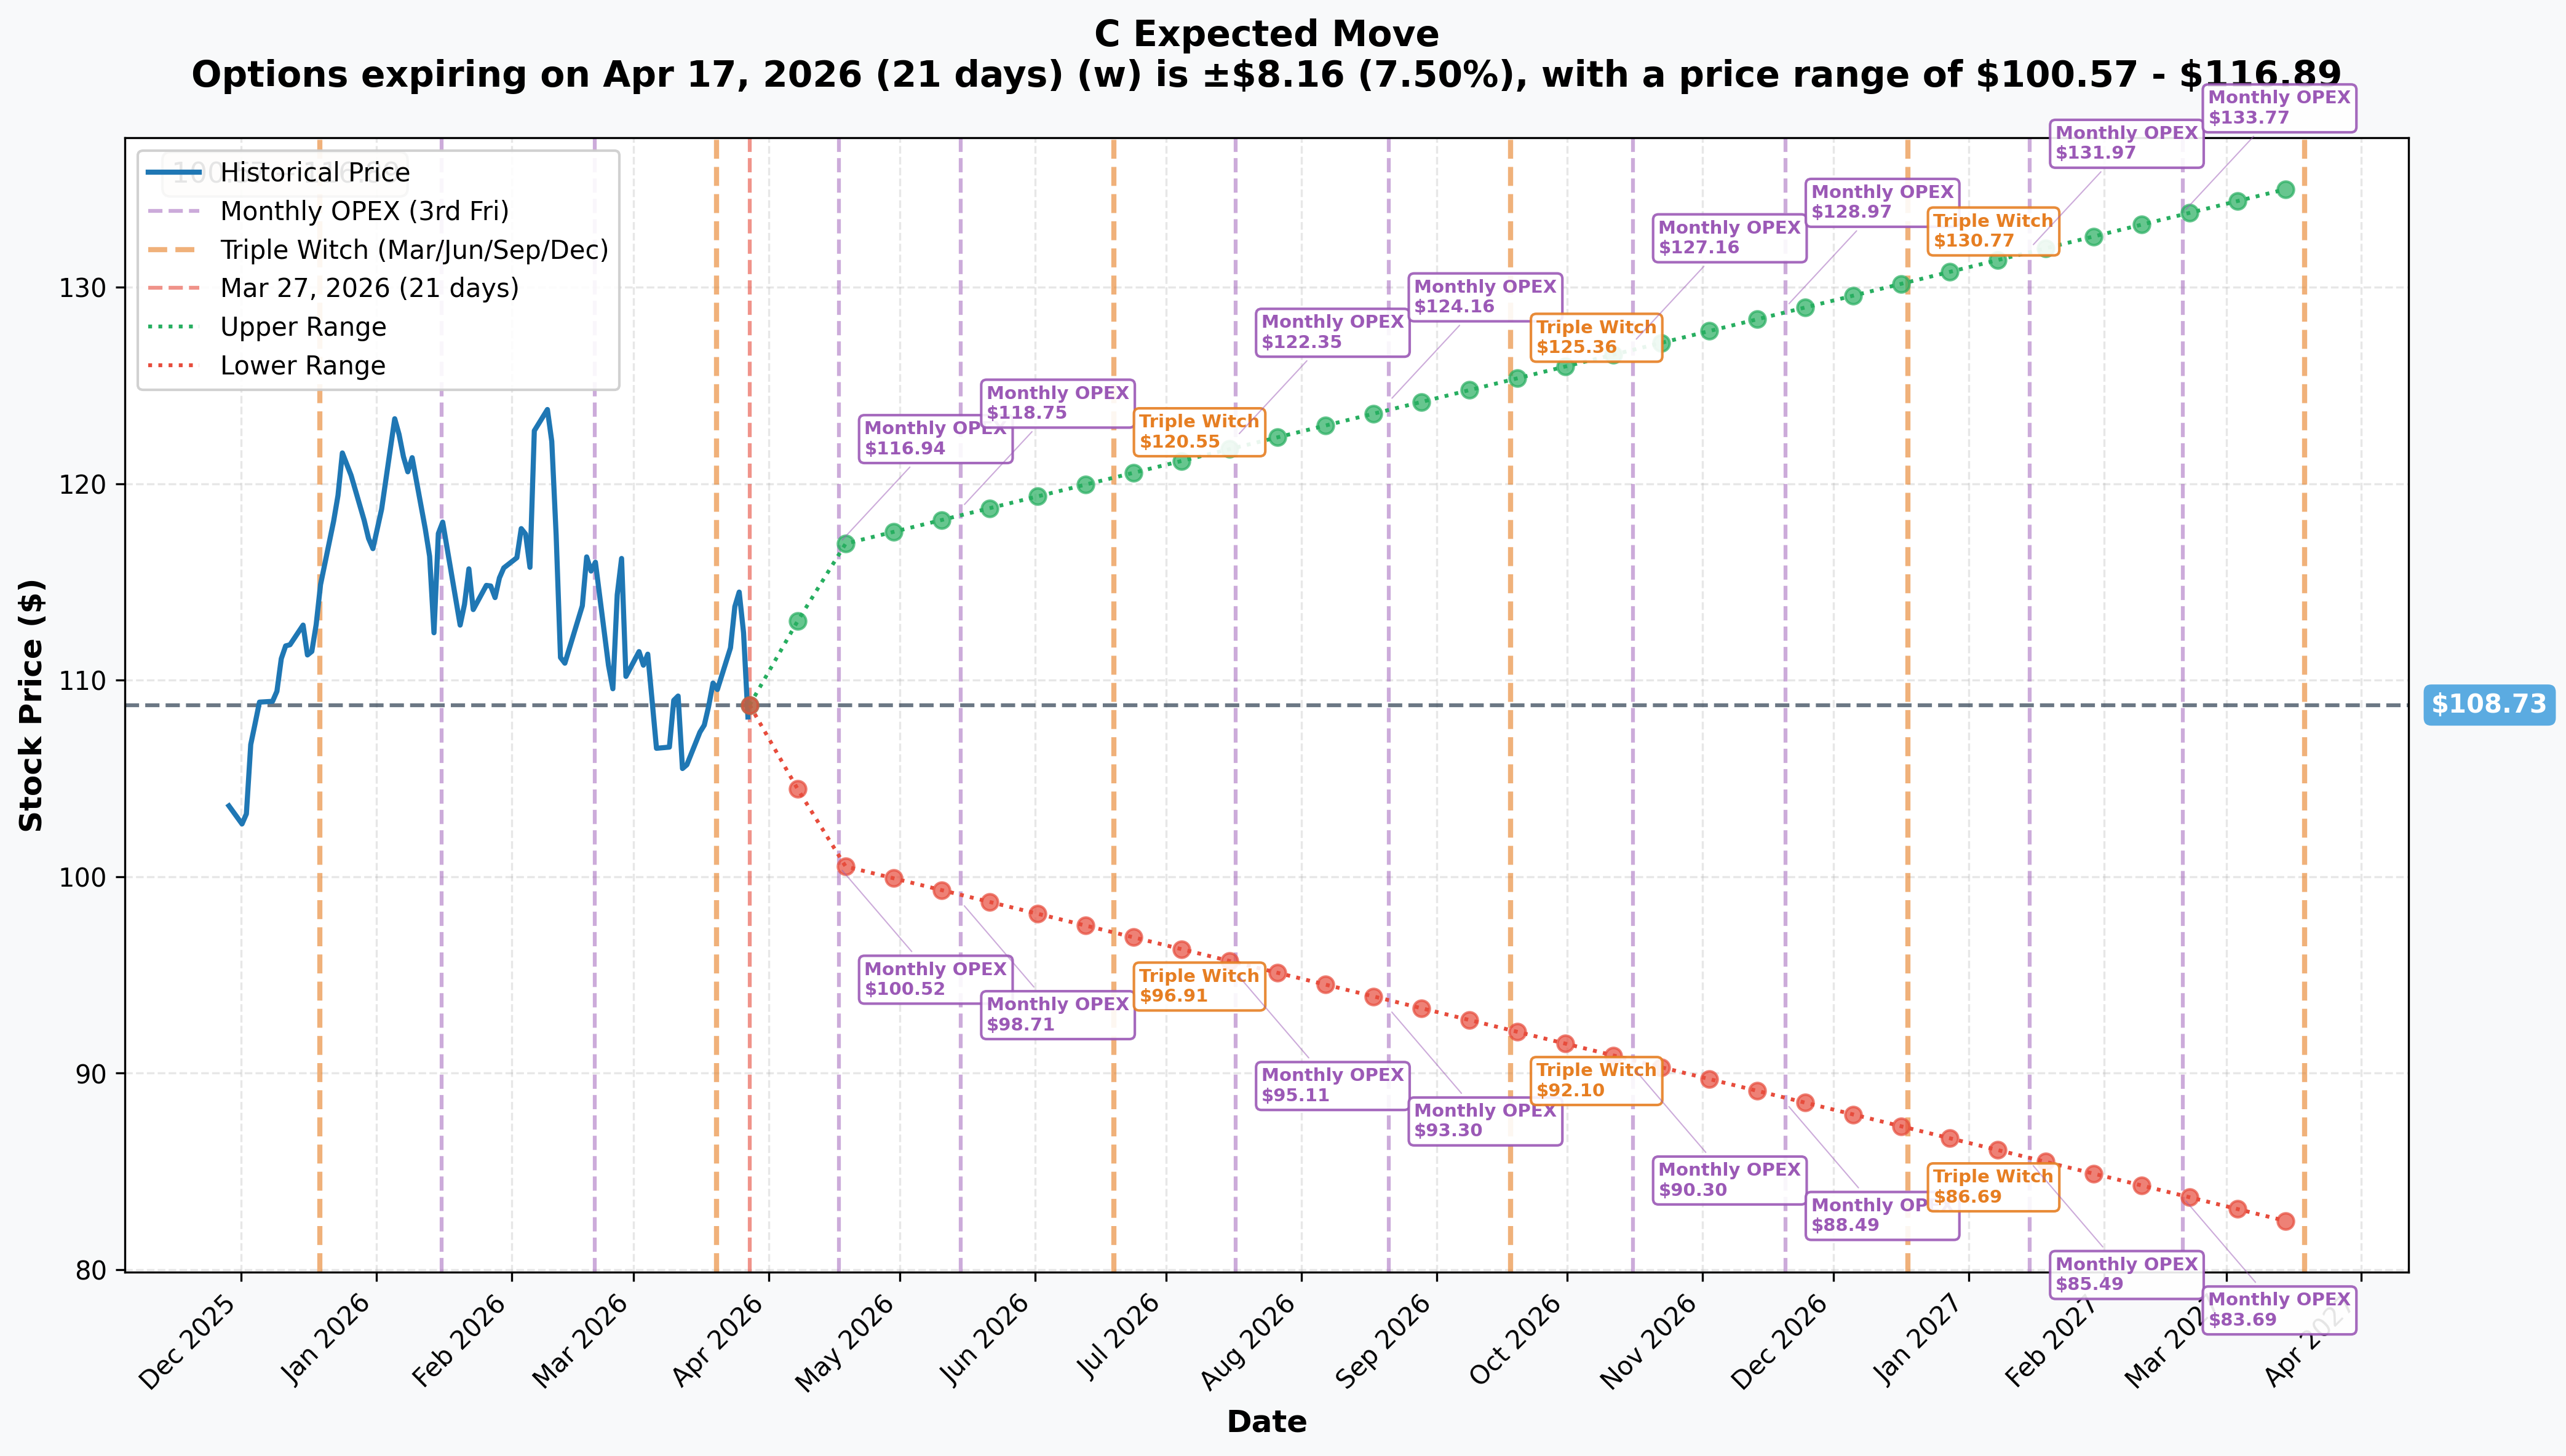
Options market pricing for upcoming expirations:
- 📅 April 17 Monthly OPEX (THIS TRADE - 21 days): ±$8.16 (±7.5%) --> Range: $100.57 - $116.89
- 📅 May 15 Monthly OPEX (Investor Day!): Upper range $118.75, Lower range $98.71
- 📅 June 19 Triple Witch (CCAR results!): Upper range $120.55, Lower range $96.91
- 📅 Yearly LEAPs (Mar 2027): ±$26.52 (±24.4%) --> Range: $82.21 - $135.25
Translation:
The options market says Citigroup can move up to $116.89 by April 17 in the bull case - and the $115 strike sits just inside that upper boundary. That's not a coincidence. The trader picked a strike that sits right at the edge of what the market considers the achievable upside range for this expiration. It's aggressive but not crazy - the market's own pricing says this level is theoretically reachable.
Key insight: The April 17 implied move of ±7.5% means the market expects a significant event by expiration. With earnings on April 14 (three trading days before), the volatility is priced for a real catalyst. If Citi beats on EPS and revenue and management strikes a confident tone on the consent order progress, $115 becomes very realistic.
🎪 Catalysts
🔥 Upcoming Catalysts
Q1 2026 Earnings: April 14, 2026 (Before Market Open) 📊
This is THE catalyst for this trade. The options expire on April 17 - literally three trading days after earnings drop. Per Yahoo Finance's preview, Street expectations:
- 💰 Consensus Revenue: $22.99 billion
- 📈 Consensus EPS: $2.60 (vs. $1.96 year-ago, +32.7% YoY growth)
- 🏆 Citi has beaten EPS estimates in each of the last four quarters
- 👀 Key metrics to watch:
- Net Interest Income trajectory (rate environment stabilizing)
- Investment banking fee pipeline (M&A/IPO activity post-geopolitical pause)
- Credit card net charge-off rates (prior guidance: 3.50-4.00%)
- Consent order compliance update from management
- BlackRock mandate revenue contribution (first quarter)
April 14-18, 2026: March Layoffs Effective Period
265 senior employees and managing directors are being laid off effective this period - right around earnings. This is part of the ongoing restructuring plan but could create noise around the earnings release.
May 7, 2026: Investor Day 🎤
Per Citigroup's January earnings call, Citi will host an Investor Day where management is expected to:
- 📊 Provide strategic details on the path toward 10-11% ROTCE
- 🔄 Update on consumer divestitures completion
- 🤖 Lay out the AI adoption strategy and efficiency gains
- 📈 Potentially revise medium-term financial targets upward
This event is captured within the May 15 OPEX implied move upper range of $118.75. If the $115 call trade succeeds (stock at or above $115 by April 17), Investor Day could be the next leg up.
June 30, 2026: CCAR Preliminary Results 📋
Citi's current stress capital buffer is 3.6% with CET1 ratio of 13.4% vs 11.6% requirement (180bp buffer). A favorable CCAR result could unlock accelerated buybacks and dividend increases - massive for the stock.
H2 2026: Consent Order Resolution (Expected) ⚖️
Per Seeking Alpha's report, Citi executives are "optimistic" about resolving the long-standing 2020 Fed and OCC consent orders in 2026. Completion of compliance work already ~80% done. This is the single largest overhang on the stock's valuation.
✅ Recent Catalysts (Already Happened)
BlackRock ETF Mandate - February 26, 2026 (MASSIVE WIN) 🏆
BlackRock selected Citi to provide middle-office services for $4.0 trillion in U.S.-domiciled iShares ETFs on the Aladdin platform. This embeds Citi in critical financial market infrastructure alongside State Street and BNY Mellon. Per Simply Wall St's analysis, this deepens Citi's fee-based services story in a major way. Stock jumped +3.98% on the announcement.
Jefferies Upgrade to Strong-Buy - March 27, 2026 (TODAY!) 📈
Jefferies today raised Citigroup to Strong-Buy with a $135 price target - that's roughly 25% upside from current levels. The timing of this upgrade on the same day as a $2M call buy is notable.
Q4 2025 Earnings - January 14, 2026 📊
Per Citigroup's official Q4 release: Revenue $19.9B (missed consensus), EPS $1.81 (beat by +6.5%). Full year 2025 revenue hit $85.2B - highest since 2010. CNBC reported net interest income rose 14% and loan loss provisions came in lighter than expected. Stock fell 4.58% pre-market on the revenue miss despite the EPS beat - a potential reset that created today's buying opportunity.
🎲 Price Targets & Probabilities
Using gamma levels, implied move data, analyst targets, and the catalyst calendar, here are the scenarios through the April 17, 2026 expiration:
📈 Bull Case (35% probability)
Target: $115-$120
How we get there:
- 🚀 Q1 2026 earnings on April 14 deliver a clean beat: EPS above $2.60 consensus AND revenue above $22.99B
- 📊 Management strikes confident tone on Q2 guidance and consent order progress
- 💪 IB fees and Markets revenue benefit from M&A/IPO activity picking up post-geopolitical pause
- 📈 Stock punches through the $110 gamma wall on earnings gap-up, then grind to $115
- 🤝 BlackRock mandate's revenue contribution (first quarter showing) exceeds expectations
- 🔥 Short squeeze potential as bears get caught on the Jefferies upgrade momentum
Call trade P&L at $115: At-the-money at expiration, intrinsic value ~$0, loss = -$1.96M (-100%) Call trade P&L at $117: Calls worth $2, profit = $0.04/share x 9,998 contracts = +$40K (breakeven zone) Call trade P&L at $120: Calls worth $5, profit = $3.04/share x 9,998 contracts = +$3M (+152% ROI) Call trade P&L at $125: Calls worth $10, profit = $8.04/share x 9,998 contracts = +$8M (+408% ROI)
This is the scenario where Citi delivers on its transformation narrative - the first clean beat in several quarters with no revenue miss. The implied move upper range of $116.89 for April 17 confirms $115 is technically achievable within the expected distribution.
🎯 Base Case (40% probability)
Target: $108-$113 range (stock stays in current channel)
Most likely scenario:
- ✅ Earnings meet but don't blow away expectations - EPS beat, slight revenue miss (echoing Q4 pattern)
- 📊 Stock bounces but doesn't escape the $110 gamma wall on a modest print
- ⚖️ Credit card normalization data (NCL rates 3.5-4.0%) keeps investors cautious
- 🔄 Stock grinds toward $110-$112 but stalls at the 26.7B gamma resistance level
- ⏰ Calls expire worthless as stock closes below $115 on April 17
Call trade P&L: Calls expire worthless, loss = -$1.96M (-100%)
Even in this scenario, the trader loses their premium. But with $1.96 per share invested, the most they can lose is the $2M spent - no margin calls, no unlimited downside. That's the beauty of defined-risk long options.
📉 Bear Case (25% probability)
Target: $100-$107
What could go wrong:
- 😰 Q1 earnings miss on BOTH revenue AND EPS - breaking the recent streak of EPS beats
- 🚨 Credit card NCL rates come in above the 3.5-4.0% guidance range, spooking investors
- 📉 Management cuts the ROTCE target again (already revised down to 10-11% from 11-12%)
- 💸 Tariff-related headwinds hit the EM revenue streams harder than expected
- 🌍 Iran conflict escalation creates broader risk-off pressure in financials
- 📊 Break below $108 gamma support opens path to the $105 level (13.4B put gamma cushion)
- ⚖️ Consent order resolution pushed to 2027 in management commentary
Call trade P&L: Calls expire worthless, loss = -$1.96M (-100%)
The $105 level is serious put gamma support - market makers hold 13.4B in put gamma there, the strongest support level on the board. Even in a bear case, a collapse below $100 would require multiple things going wrong simultaneously.
💡 Trading Ideas
🛡️ Conservative: "Earnings Safety Net" - Bull Call Spread
Play: Buy the C April 17, 2026 $110 calls, sell the April 17 $115 calls
Structure: $110/$115 bull call spread, same expiration as the whale trade
Why this works:
- 📊 Captures the same earnings directional thesis at a MUCH lower cost
- 🛡️ Defined risk: you can only lose the net debit paid (roughly $1.50-$2.00 per spread)
- 💰 Max profit: $5 per spread minus debit paid (~$3-$3.50 gain) if C is above $115 at expiry
- 📈 The $110 long strike is only 1.75% away - easier to go in-the-money on an earnings beat
- 🎯 The $115 short strike aligns perfectly with the whale's strike and the gamma resistance wall
- ⚖️ Better risk/reward than buying the $115 calls outright: you need less of a move to profit
Position sizing: Risk no more than 2-3% of portfolio. 20 spreads at ~$1.75 net debit = $3,500 risk for ~$10,000 max profit.
Risk level: Moderate (defined risk, earnings catalyst) | Skill level: Intermediate
⚖️ Balanced: "Earnings Straddle Flip" - At-the-Money Calls
Play: Buy C April 17, 2026 $108 or $109 calls ahead of earnings
Why this works:
- 🎯 At-the-money calls have the most leverage to an earnings gap
- 📈 The gamma sensitivity (delta ~0.50) means these calls move nearly dollar-for-dollar with the stock on a big gap
- 💸 Lower strike than $115 = much cheaper premium, lower breakeven
- ⏰ Same 21-day window captures the earnings catalyst on April 14
- 📊 A move to $115 on earnings would make these calls worth ~$6-7, from a ~$3 entry (2x+)
- 🔵 The $108 gamma support acts as a floor - if the stock holds, these calls retain value better
Position sizing: Risk no more than 3-5% of portfolio. 10 contracts at ~$3.00 = $3,000 risk.
Risk level: High (options expire in 21 days, all-or-nothing on earnings) | Skill level: Intermediate
🚀 Aggressive: "Tail Ride" - Mirror the Whale
Play: Buy C April 17, 2026 $115 calls outright
Why this works (and why it's risky):
- 💥 Exact same trade as the institutional buyer - you're riding alongside $2M in smart money
- 🎰 Maximum leverage: if C gaps above $117 on earnings, these calls go from ~$1.96 to $3+, nearly doubling immediately
- 🔥 Potential for outsized gains if a strong earnings beat creates momentum buying into April 17 OPEX
- 📈 Gamma squeeze potential: heavy call OI at $115 means market makers need to buy stock as the price approaches, accelerating the move
Why it could blow up:
- 💸 $115 is 6.4% OTM with only 21 days left - this is a lottery ticket, not a calculated bet
- ⏰ Time decay is brutal on short-dated OTM options. These calls lose value every single day
- 📉 If earnings disappoint even slightly, these expire worthless - 100% loss
- 📊 Breakeven is $116.96, meaning you need an 8.2% rally just to not lose money at expiration
- 🎯 Three trading days between earnings and expiration is not enough time to recover from a bad print
Position sizing: Risk ONLY what you can afford to lose completely. This is a defined-risk lottery ticket. 5-10 contracts at ~$1.96 = $980-$1,960 at risk.
Risk level: VERY HIGH (high probability of 100% loss) | Skill level: Advanced
⚠️ Risk Factors
Don't get caught by these potential landmines:
-
📉 Strike is 6.4% OTM with only 21 days left: There's a real chance this trade expires worthless. The stock needs to rally through the dominant $110 gamma wall (26.7B exposure) AND push to $115 in three weeks. That's two obstacles in a compressed timeframe.
-
⏰ Three days between earnings and expiration is razor thin: If earnings drop on April 14 and the initial reaction is muted, there's essentially no time for the position to recover. A soft earnings response = instant total loss.
-
📊 Citi's Q4 pattern (EPS beat + revenue miss) is a two-edged sword: The last four quarters showed EPS beats, but Q4 still triggered a 4.58% pre-market decline on the revenue miss. If Q1 repeats this pattern, the stock might not reach $115.
-
💳 Credit card NCL rates are the wildcard: Citigroup's branded cards portfolio guided NCL rates at 3.50-4.00%. Any reading above the high end of that range signals consumer credit stress and could tank the stock regardless of other beats.
-
🌍 Geopolitical pause is real: Per Ad-Hoc-News reporting, the Iran conflict is creating a short-term pause in M&A/IB deal activity. If IB fees disappoint materially, the overall earnings print suffers.
-
🏛️ Consent order timing is in regulators' hands: Per Seeking Alpha, resolution depends on Fed and OCC timelines, not Citi management. A negative regulatory update during the earnings call would be damaging.
-
💸 ROTCE target already under pressure: American Banker reported that management cut the ROTCE target to 10-11% from 11-12% in January. Another revision lower would destroy the transformation narrative.
-
📈 $110 gamma wall is a serious ceiling: With 26.7B in call gamma at $110 - the largest single resistance level on the board - getting through that level on earnings requires a genuine surprise beat, not just a meet. The stock could stop dead at $110 and grind sideways.
🎯 The Bottom Line
Real talk: Someone with deep pockets just put $2 million on the line betting Citigroup breaks $115 by April 17 - three trading days after Q1 earnings. This is a high-conviction, short-dated earnings play from an institution that presumably has done serious homework on the bank's trajectory. With a Z-Score of 15.0, this kind of flow appears only a handful of times a year for any given contract - it's not background noise.
What this trade tells us:
- 🎯 Institutional money expects a strong Q1 2026 earnings beat on April 14 - consensus EPS of $2.60 needs to be cleared, and the trader probably thinks management surprises to the upside
- 💰 The $115 strike is not random - it aligns with the largest single call gamma resistance level, the top of the implied move range for April 17, and the median analyst price target of $115 per StockAnalysis consensus data
- ⏰ The ultra-short 21-day window with earnings inside it is a binary bet, not a slow grind play
- 📊 The 1.45x Vol/OI confirms this is fresh capital entering, not rolling an existing position
- 🔥 The timing alongside Jefferies' same-day upgrade to Strong-Buy with a $135 target is notable
If you're bullish on C:
- ✅ Consider the $110/$115 bull call spread (Conservative) - same directional thesis, better risk/reward ratio, survives a moderate earnings beat
- 📊 The $105 gamma support (13.4B exposure) is your near-term backstop - set an alert if the stock breaks below $105
- 📅 Mark April 14 as the moment of truth for any position you put on now
If you're watching from the sidelines:
- 🎯 A pre-earnings pullback to the $105 gamma support level would be a better entry for stock buyers
- 📊 Wait for the April 14 earnings reaction before committing to options - implied volatility will crush after the print regardless of direction
- 📈 The analyst consensus average target is $131.42 per WallStreetZen with a high of $150 - the long-term fundamental case remains intact regardless of this short-term trade
If you're cautious:
- ⚠️ The credit card NCL rate guidance (3.50-4.00%) is the canary in the coal mine - if Citi shows signs of consumer credit deterioration, avoid the long trade
- 📉 A break below $108 gamma support (currently where the stock is sitting) would signal the setup is broken
- 🛡️ If you want exposure but not earnings binary risk, consider waiting until after April 14 to position for the May 7 Investor Day catalyst at lower volatility
Key dates to mark:
- 📅 April 14, 2026 - Q1 2026 Earnings (Before Market Open) - THE event for this trade
- 📅 April 17, 2026 - This trade expires (three trading days post-earnings)
- 📅 May 7, 2026 - Investor Day - next major strategic catalyst
- 📅 June 30, 2026 - CCAR preliminary SCB notification - potential buyback/dividend catalyst
- 📅 H2 2026 - Consent order resolution - the transformational binary event for the stock
Final verdict: The $2M bet on Citi $115 calls is an aggressive earnings lottery ticket - high risk, potentially very high reward. The thesis is sound (strong earnings catalyst, analyst upgrades, BlackRock mandate tailwind, technical setup building a floor), but the short timeframe and OTM strike make this a binary event. For retail traders, the smarter play is to use the defined-risk spread approach that captures the same directional bet at a fraction of the premium risk. You don't need to match the whale's size - you just need to be in the right seat when the train leaves the station.
The $110 gamma wall is the key level to watch. If Citi breaks above $110 on earnings, the next stop is $115. If it stalls at $110 - the calls expire worthless. 👀
Disclaimer: Options trading involves substantial risk of loss and is not suitable for all investors. This analysis is for educational purposes only and not financial advice. Past performance doesn't guarantee future results. Short-dated out-of-the-money call options are high-risk instruments with a high probability of expiring worthless. Always do your own research and consider consulting a licensed financial advisor before trading. Options can lose 100% of their value.
About Citigroup: Citigroup is a global diversified financial services holding company, providing consumers, corporations, governments, and institutions with a broad range of financial products and services, including consumer banking and credit, corporate and investment banking, securities brokerage, transaction services, and wealth management. Market cap ~$196.6B, listed on NYSE.