🐋 CF Industries: Someone Just Dropped $3.1M on a Single Bullish LEAP Bet -- and the Timing Is Wild
📅 March 5, 2026 | 🔥 Unusual Activity Detected
🎯 The Quick Take
Someone just loaded up $3.1M into CF Industries January 2027 $130 calls -- buying 2,926 contracts when open interest was only 145. That's a 20.7x volume-to-OI ratio, meaning this is an entirely new position, not someone adding to an old one. With CF already up 38% YTD on the Strait of Hormuz crisis choking off a third of global fertilizer supply, this trader is betting the rally has much further to run over the next 10 months.
🏢 Company Overview
CF Industries Holdings (NYSE: CF) is a leading North American producer and distributor of nitrogen-based fertilizers, headquartered in Northbrook, Illinois. The company operates with roughly 2,900 employees and a current market cap of ~$16.1B. CF's edge is its use of low-cost U.S. natural gas as feedstock, making it one of the most cost-efficient nitrogen producers on the planet. The company is classified under Agricultural Chemicals (SIC 2870) and is also investing in next-generation blue and green ammonia for clean energy applications.
What makes CF uniquely relevant right now: its production is 100% North American, completely insulated from the Middle East supply chaos currently roiling global fertilizer markets.
💰 The Option Flow Breakdown
📊 What Just Happened
| Field | Detail |
|---|---|
| 📅 Date & Time | March 5, 2026 at 10:11 AM ET |
| 🏷️ Ticker | CF (NYSE) |
| 📍 Side | MID (negotiated between bid/ask) |
| 🟢 Direction | BUY (opening) |
| 📞 Type | CALL |
| 💵 Strike | $130 (17% out-of-the-money) |
| 📆 Expiration | 2027-01-15 (~10 months out) |
| 📦 Size | 2,926 contracts |
| 📊 Volume vs OI | 3,000 vs 145 (20.7x ratio) |
| 💰 Premium Paid | $3.1M ($10.50/contract) |
| 📍 Spot Price | $111.12 |
| 🎯 Breakeven | $140.50 (26.4% above current price) |
| ⚡ Z-Score | 175.76 -- EXTREMELY UNUSUAL |
| 🏷️ Strategy | Long Call (standalone, new opening) |
🤓 What This Actually Means
Let's break this down in plain English.
This trader walked in with $3.1M in cash and bought nearly 3,000 call contracts on a single fertilizer stock, giving themselves the right to buy CF shares at $130 any time before January 2027. Right now CF trades around $111, so these calls are 17% out of the money. The stock needs to hit $140.50 just for this bet to break even.
Why is this unusual? The volume-to-open-interest ratio of 20.7x means this position basically didn't exist before today. Only 145 contracts were sitting on the books at this strike -- and this trader just added nearly 3,000 more in a single clip. The trade's Z-Score of 175.76 flags it as extremely unusual relative to CF's normal options activity.
The MID execution (right between the bid and ask) is a classic institutional move. Retail traders hit the ask; big players negotiate fills at the midpoint. This wasn't someone panic-buying on their phone. This was deliberate, planned, and sized like a fund allocation.
The 10-month timeframe is key. This isn't a short-term earnings gamble. This trader is betting that the current geopolitical supply shock, combined with seasonal demand and CF's dominant domestic position, will power the stock well past $130 over the coming months. At $140.50 breakeven, they need roughly 26% upside -- ambitious, but not unreasonable given that CF has already ripped 38% since January.
📈 Technical Setup / Chart Check-Up
YTD Price Action
CF has been on an absolute tear. The stock spent most of 2025 trading sideways in the $75-$95 range, but the combination of a strong Q4 earnings beat and the Strait of Hormuz crisis sent it parabolic in early 2026. It hit a new 52-week high of $113.77 today before settling around $111.
The 50-day moving average has crossed above the 200-day MA -- a textbook golden cross. Volume has picked up meaningfully in recent sessions, confirming the breakout is real and not just a few lucky ticks.
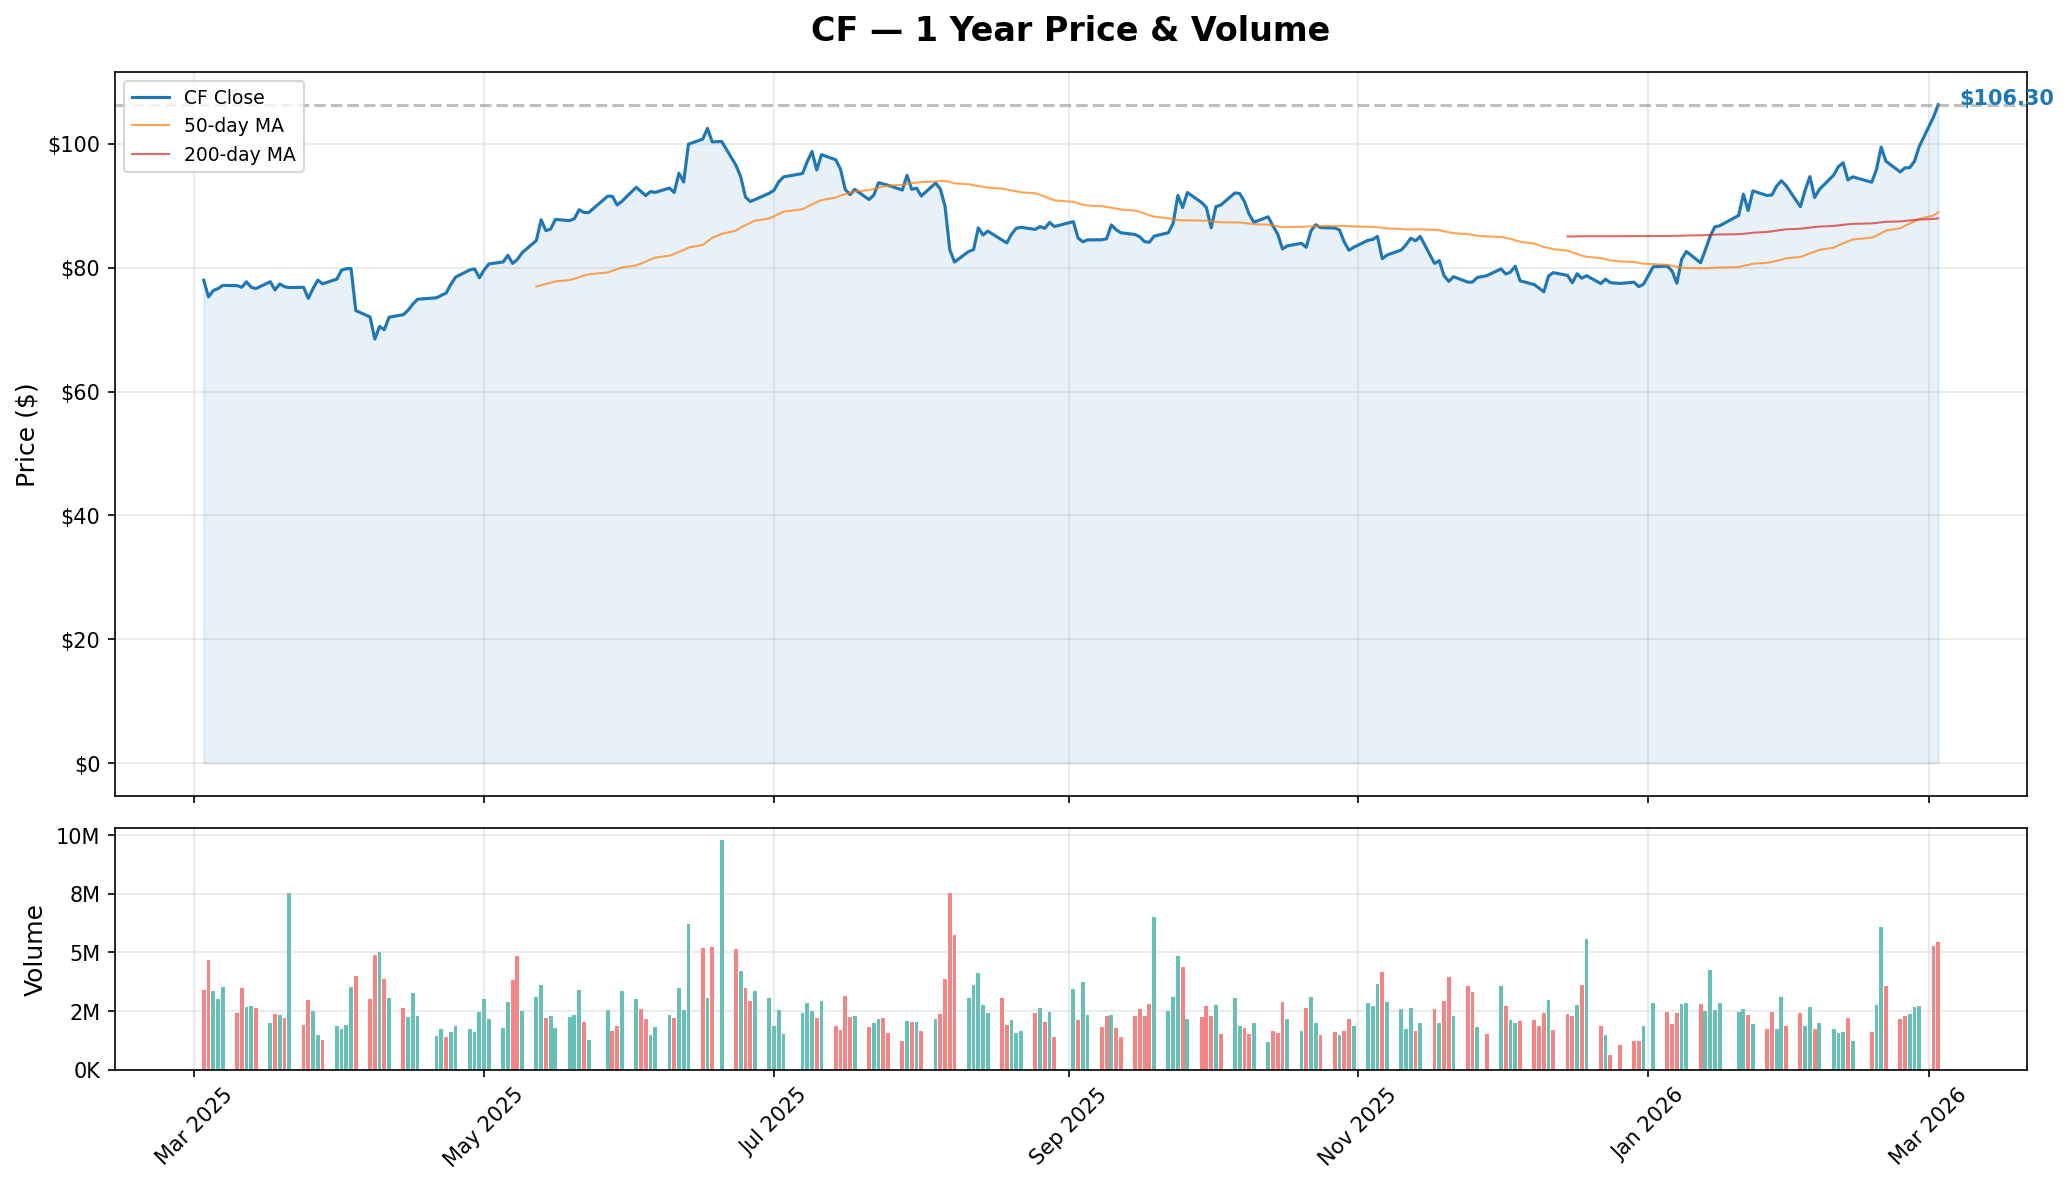
Key observations from the chart:
- 📈 Price has broken decisively above the $100-$106 consolidation zone from late February
- 📊 Volume spiking on up-days confirms institutional accumulation
- 🔵 50-day MA now rising sharply, providing dynamic support around $95-$97
- 🟠 200-day MA around $85 provides the deeper structural support floor
🔵🟠 Gamma-Based Support & Resistance Analysis
The gamma exposure chart shows how dealer hedging activity creates dynamic support and resistance levels. Orange bars (call gamma) above the current price act as resistance -- these are levels where market makers have sold calls and need to hedge by selling shares as price approaches. Blue bars (put gamma) below price act as support, where dealers must buy shares to hedge.
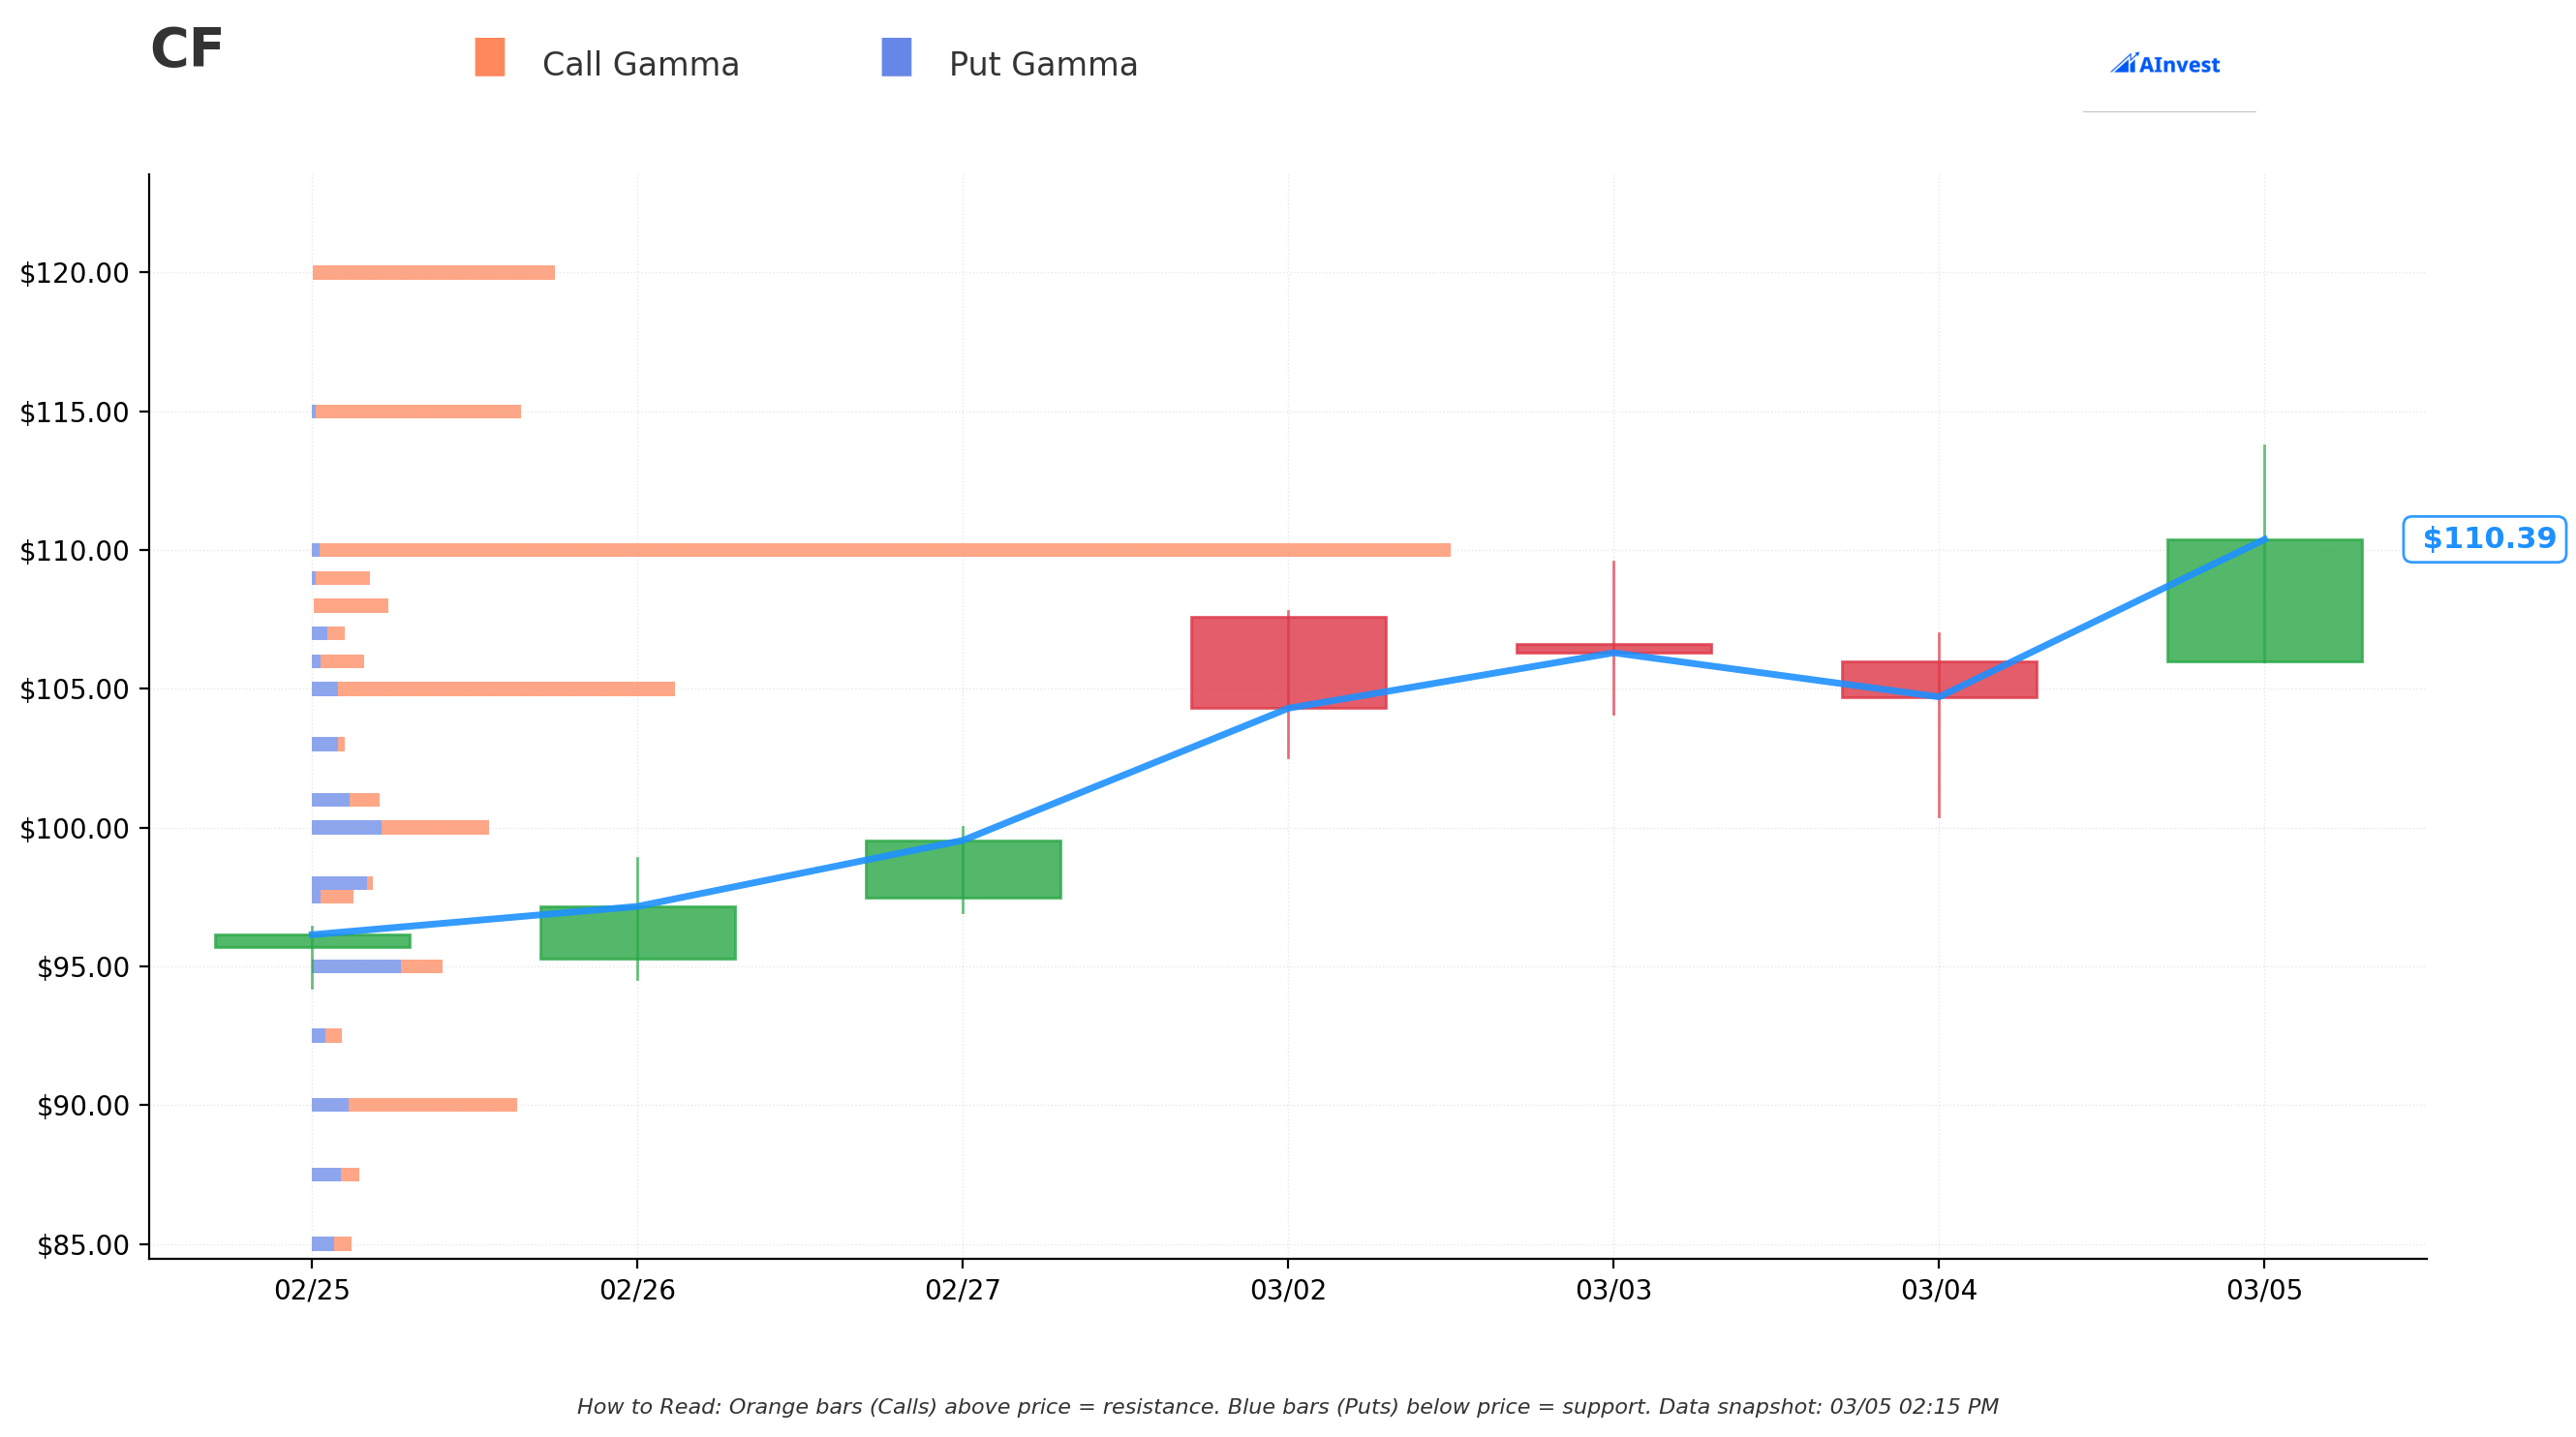
What the gamma chart tells us:
- 🟠 $110 is the dominant call gamma wall -- a massive bar of call gamma stretching across recent sessions. With CF trading at $110.39, it's sitting right at this level. This is where dealers have the heaviest hedge obligations, which tends to create a "sticky" zone
- 🟠 $115 and $120 are the next resistance levels above, with visible call gamma bars from earlier positioning
- 🔵 $95-$98 shows put gamma support -- earlier this month, significant put hedging activity clustered in this zone, creating a natural floor
- 🔵 $85-$90 is the deeper support zone where additional put gamma walls appear
Translation: The stock is currently wrestling with the $110 gamma wall. A clean break above $115 would likely trigger a rapid move toward $120, as there's relatively thin gamma between those levels. On the downside, $95-$98 is well-supported by put hedging flows.
📐 Implied Move Analysis
The options market is pricing in some significant moves across timeframes. Here's what the implied move data tells us:
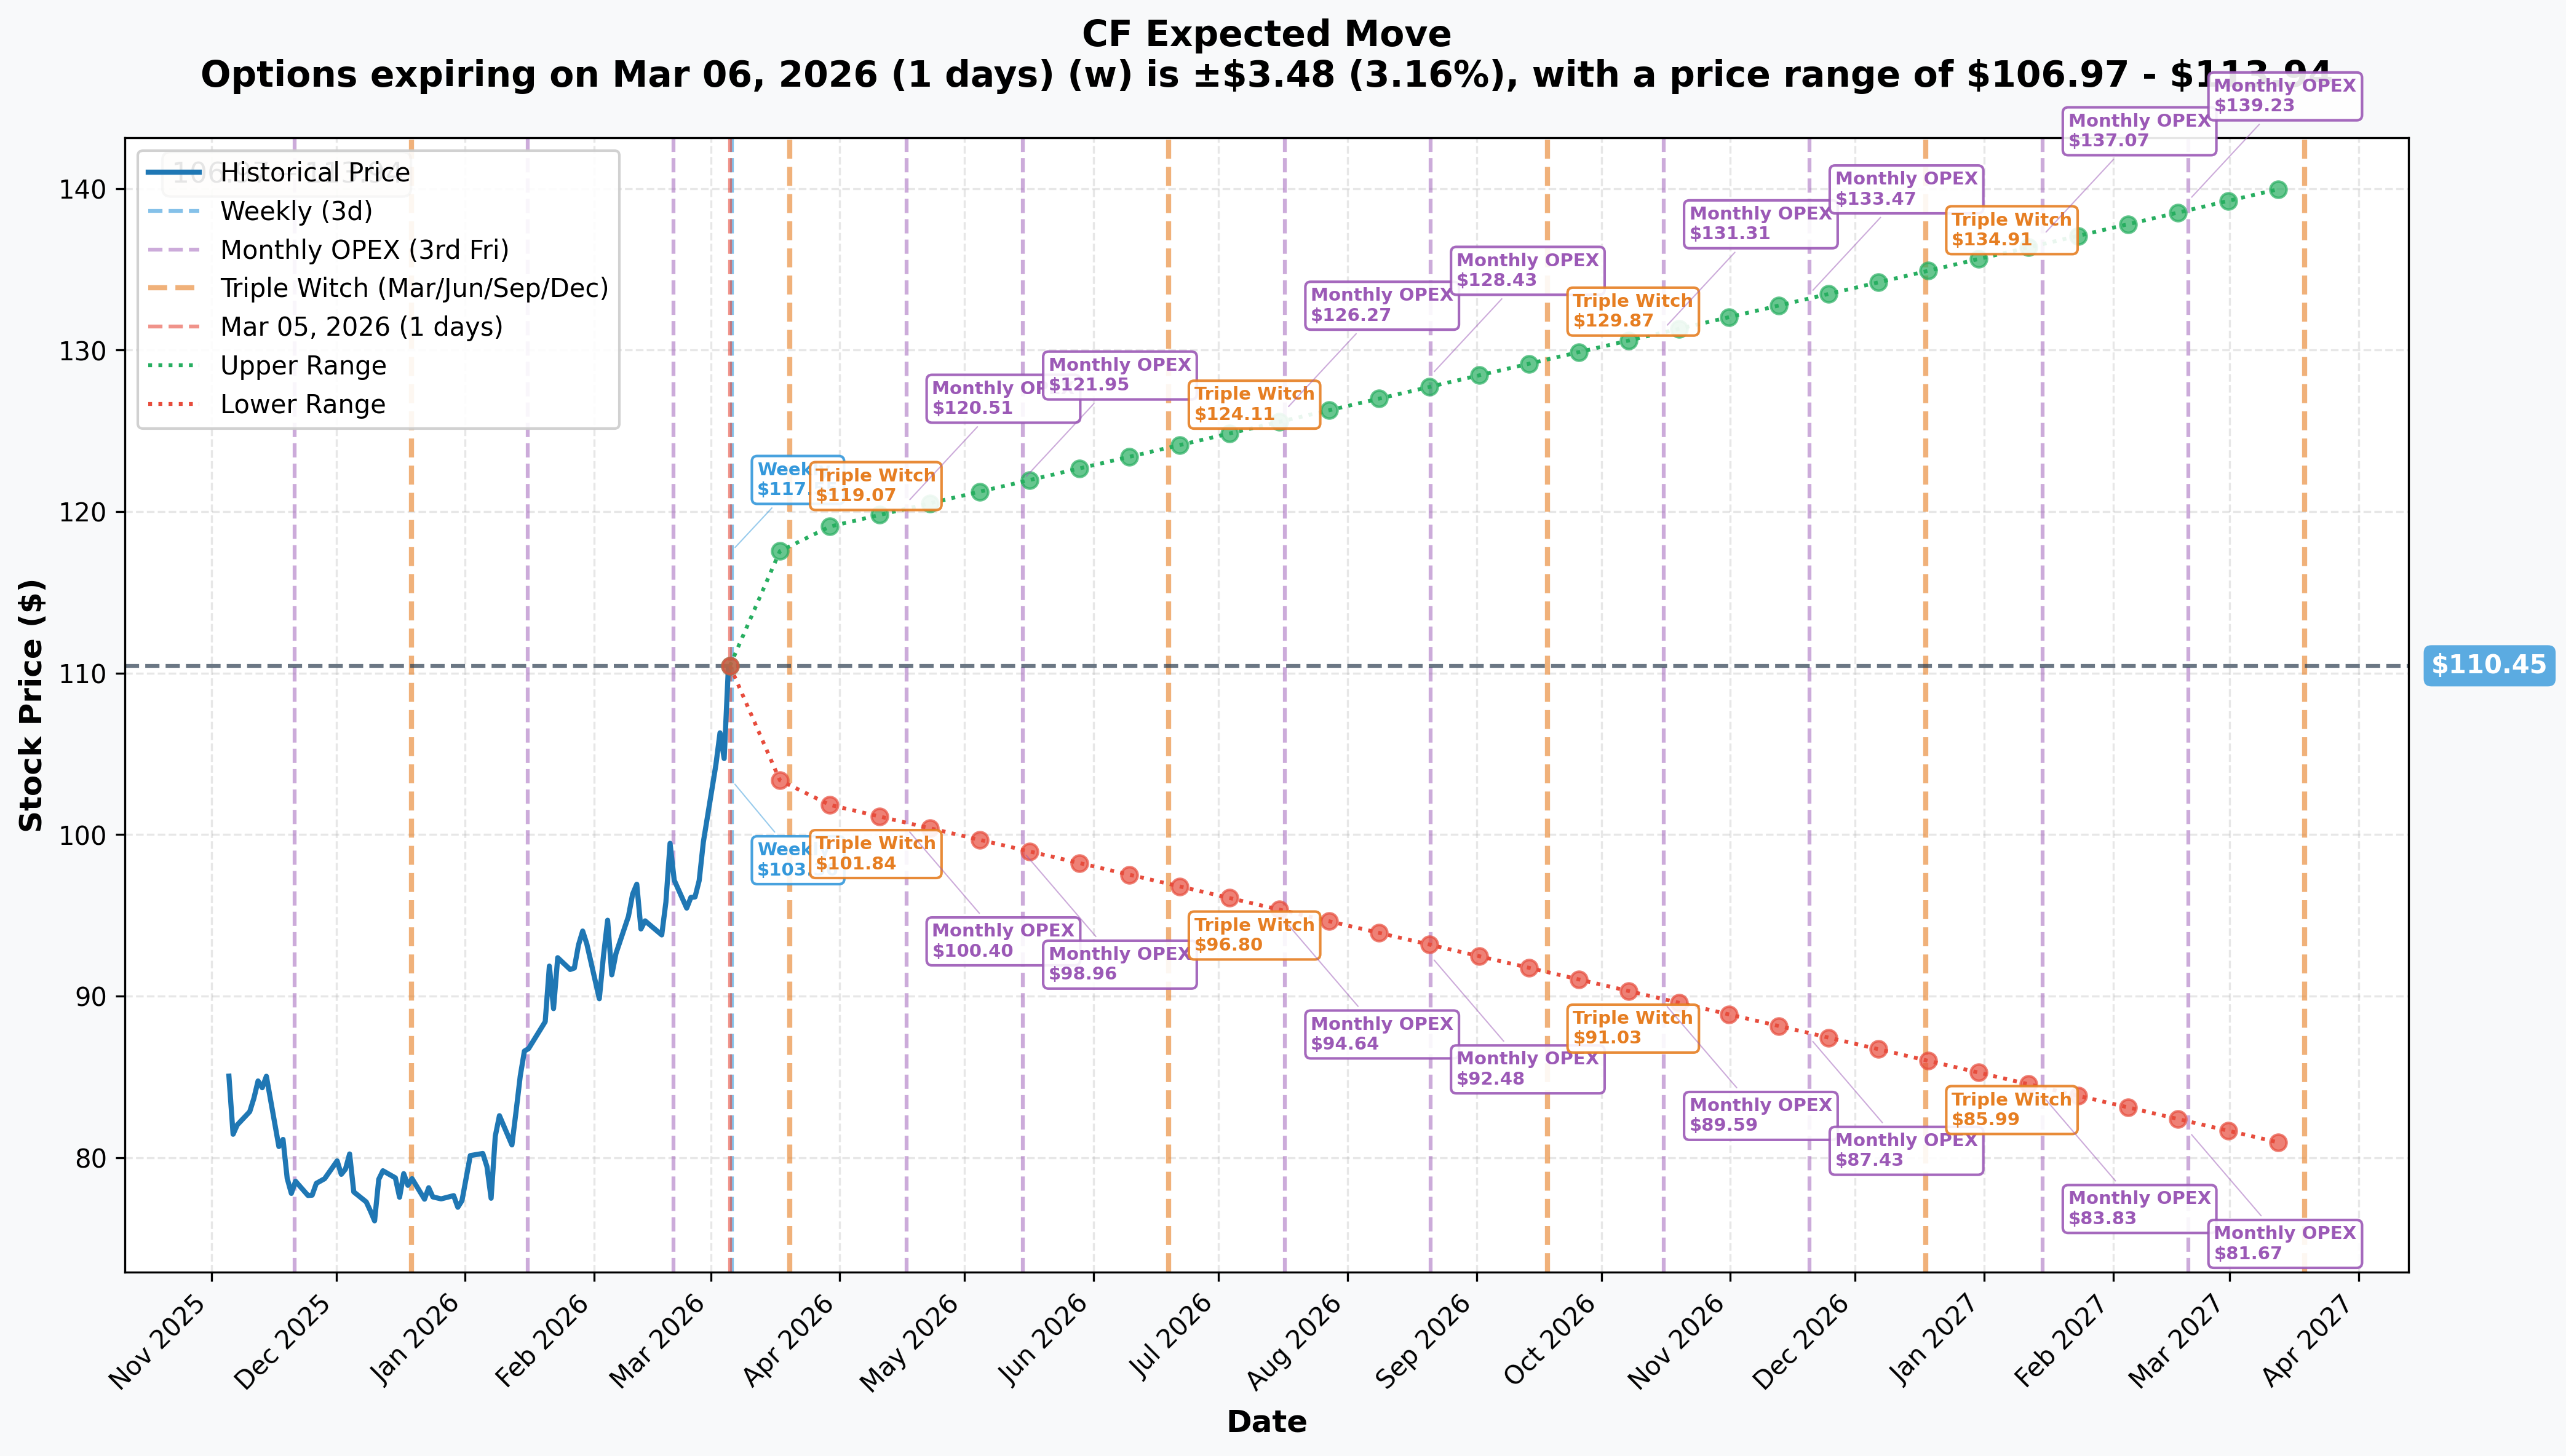
| Timeframe | Expiry | Implied Move | Expected Range |
|---|---|---|---|
| 📅 Weekly | March 6 | ±3.2% (±$3.48) | $106.97 - $113.94 |
| 📅 Monthly OPEX | March 20 | ±7.3% (±$8.07) | $102.38 - $118.53 |
| 📅 Q2 Triple Witch | June 19 | ±12.4% | $96.80 - $124.11 |
| 📅 LEAP (1yr) | March 2027 | ±27.1% (±$29.92) | $80.53 - $140.37 |
Key insight for our whale trade: The January 2027 $130 strike sits within the upper bound of the LEAP implied move ($140.37). That means the options market itself considers $130+ as achievable within the LEAP timeframe. The $140.50 breakeven falls right at the edge of the 1-standard-deviation move -- the market gives this roughly a 30-35% probability of finishing in the money at expiration. But the trader doesn't need it to expire ITM -- any significant move toward $130 over the next 10 months would produce substantial profits on these calls.
🎪 Catalysts
✅ Already Happened (Tailwinds in Motion)
- 🔥 Strait of Hormuz blockade (March 1-5) -- U.S. Operation Epic Fury has disrupted ~33% of global urea and 20-25% of ammonia trade, spiking urea prices $60-80/ton in a single week. Iranian and Qatari producers have halted output. Fertilizer prices surged 6.5% broadly
- 📈 Barclays upgrade (March 4) -- Raised price target from $100 to $120 with Overweight rating. Multiple other brokerages raised targets post-Q4 earnings: RBC to $100, UBS to $97, JPMorgan to $94
- 💰 Q4 2025 earnings beat (February 19) -- Revenue of $1.87B beat consensus by $87M, EPS of $2.99 crushed the $2.50 estimate. Full-year 2025 delivered $7.08B revenue, $8.97 EPS, and $2.89B adjusted EBITDA
- 💸 Massive shareholder returns -- $1.7B returned in 2025, including $1.3B in buybacks (10% of shares outstanding)
📅 Upcoming (What the Whale Is Betting On)
- 📊 March 31 -- USDA Prospective Plantings Report -- Preliminary estimate projects 94.0M corn acres (down 4.8M from 2025). Any upward revision to corn acreage would be bullish for nitrogen demand
- 🌾 March-May -- Peak Spring Planting Season -- This is CF's bread-and-butter quarter. Tight supply + record-high fertilizer prices + incredibly low U.S. inventories = pricing power
- 💵 Mid-May (est.) -- Q1 2026 Earnings -- This will be the first quarter to fully capture the Hormuz-driven nitrogen price spike. If current urea pricing ($520-$550/ton) holds through April, expect a blowout quarter
- 🏗️ Q2 2026 -- Blue Point Complex civil work begins -- The $4B JV with JERA and Mitsui for 1.4M MT/yr blue ammonia production validates CF's clean energy growth vector
- 🔧 Q4 2026 -- Yazoo City plant restart -- The Mississippi facility coming back online would add ~6% production capacity and remove the estimated $200M EBITDA drag
🎲 Price Targets & Probabilities
Using the gamma levels, implied move data, and catalyst timeline, here's how the bull/base/bear cases shape up:
🐻 Bear Case: $90-$96 (15% probability)
If the Strait of Hormuz conflict resolves quickly, fertilizer prices could snap back toward pre-crisis levels. Combined with the USDA projecting lower corn acreage and rising natural gas costs (EIA forecasts $4.30/MMBtu for 2026, up 30% from 2025), CF could retrace to the $96 support zone identified in our gamma analysis, or even the $90 level where deeper put gamma sits. The Yazoo City outage creates a ~$200M EBITDA headwind that weighs on sentiment if the geopolitical premium evaporates.
⚖️ Base Case: $115-$120 (50% probability)
The Hormuz disruption persists through spring planting season, keeping fertilizer prices elevated. CF captures the pricing benefit in Q1 earnings (mid-May), delivering a beat. Analyst price target upgrades accelerate -- Barclays already at $120, and the consensus target of $96.87 (per MarketBeat) has massive room to catch up. The $110 gamma wall gives way, and the stock grinds toward the monthly OPEX implied upper range of $118.53 and the Barclays target of $120. This scenario is supported by the implied move data showing the March OPEX upper range at $118.53 and April OPEX at $120.51.
🚀 Bull Case: $130-$140 (35% probability)
The Hormuz blockade extends through summer, creating a sustained supply crisis similar to 2022's Russia-Ukraine fertilizer shock. Every $10/ton increase in urea adds roughly $50-60M to CF's annual revenue. If urea stays above $550/ton through Q2, CF could see $10+ EPS in 2026. The Yazoo City restart in Q4 adds production capacity at exactly the right time. Analyst upgrades cascade as the consensus target catches up to reality. The implied move data shows the LEAP upper range at $140.37 -- right where our whale's breakeven sits. The June Triple Witch upper range of $124.11 and September Triple Witch upper range of $129.87 provide stepping stones on the way to $130+.
💡 Trading Ideas
🛡️ Conservative: "The Covered Strangle" (Income Play)
If you already own CF shares, sell a March 20 $115 call ($3.00 premium) and use the proceeds to buy a March 20 $105 put ($2.50) for near-free downside protection.
- 💵 Net cost: ~$0.50 debit
- 🎯 Max gain: Shares called away at $115 + $3.50 upside from current price
- 🛡️ Protection kicks in below $105
- ⏰ Timeframe: 15 days to March OPEX
- 📝 Why it works: You capture the remaining upside to $115 while protecting gains if the Hormuz situation de-escalates. The elevated IV (37-41%) means you're selling expensive premium
⚖️ Balanced: "The Bull Call Spread" (Follow the Whale, Limit Risk)
Buy the January 2027 $120 call and sell the January 2027 $140 call to create a bull call spread.
- 💵 Estimated cost: ~$7.50-$8.50 per spread ($750-$850 per contract)
- 🎯 Max gain: $20 per spread ($2,000 per contract) if CF finishes above $140 at January 2027 expiry
- 📉 Max loss: Premium paid ($750-$850 per contract)
- 📊 Reward/risk ratio: ~2.4:1
- 🎯 Breakeven: ~$128.50
- ⏰ Timeframe: 10 months (LEAP territory)
- 📝 Why it works: You're riding the same thesis as the whale trade -- CF above $130 by January 2027 -- but capping your risk. The short $140 call reduces cost and hedges against overpaying for IV. You need less capital than the outright call and benefit from the same seasonal and geopolitical tailwinds
🚀 Aggressive: "The Whale Shadow" (Directional LEAP)
Buy the January 2027 $130 call outright -- the exact same trade the whale just made.
- 💵 Cost: ~$10.50 per contract ($1,050 per contract, scale to your risk tolerance)
- 🎯 Target: $140-$150 by late 2026 (potential 2-4x return on premium)
- 📉 Max loss: 100% of premium (total wipeout if CF stays below $130)
- 🎯 Breakeven: $140.50
- ⏰ Timeframe: 10 months
- 📝 Why it works: You're making the identical bet as an institutional player who committed $3.1M to this thesis. The long time horizon gives you exposure to multiple potential catalysts: Hormuz escalation, spring planting demand, Q1 earnings beat, analyst upgrades, and Yazoo City restart. If the supply crisis intensifies, these calls could appreciate rapidly even before expiration. But real talk -- this needs a 26% move to break even, so size accordingly
⚠️ Risk Factors
- 🕊️ Geopolitical de-escalation -- If the Strait of Hormuz reopens, fertilizer prices could crash back to pre-crisis levels. The 38% YTD rally is largely built on this supply shock premium. A ceasefire or diplomatic resolution would unwind the thesis quickly
- ⛽ Natural gas cost squeeze -- EIA forecasts $4.30/MMBtu for 2026 vs. $3.31 in 2025. Henry Hub spiked to $7.72/MMBtu in January. Higher input costs compress margins even if fertilizer prices stay elevated
- 🌽 USDA corn acreage decline -- The March 31 Prospective Plantings report could confirm 94.0M corn acres (down 4.8M), reducing domestic nitrogen demand by 3-5%
- 🏚️ Yazoo City extended outage -- The Mississippi plant is offline until at least Q4 2026, dragging ~$200M off EBITDA. Further delays would compound the production gap
- 🚨 Insider selling -- EVP Bert Frost sold $540K and Will Anthony sold $24.3M in shares in the last week. That's $24.8M of insider selling at elevated prices
- 📊 Overbought conditions -- CF is trading at new 52-week highs, well above the analyst consensus price target of $96.87. The stock is extended relative to moving averages and could be due for a pullback
- ⏳ Time decay -- The $130 calls cost $10.50/contract. That's $10.50 of pure extrinsic value that erodes every day the stock isn't moving toward $130. At the current rate of theta, these calls lose roughly $0.03-$0.05 per day
🎯 The Bottom Line
Here's the deal: A $3.1M institutional bet just landed on CF Industries January 2027 $130 calls with a volume-to-OI ratio of 20.7x. This is a freshly built, conviction-heavy position from a player who clearly believes the Strait of Hormuz disruption is not a short-term blip -- and that CF's position as America's top nitrogen producer will translate into sustained upside over the next 10 months.
The setup makes fundamental sense. CF just posted record earnings, fertilizer prices are spiking on a genuine supply crisis affecting 33% of global trade, spring planting season is starting, and U.S. inventories are at "incredibly low" levels. The stock has momentum, the catalysts are stacking up, and the analyst community is still playing catch-up with targets that were set before Operation Epic Fury changed the game.
If you're bullish on CF: Mark your calendar for March 31 (USDA Plantings Report) and mid-May (Q1 earnings). Those are the two near-term events that will either validate or challenge this thesis. The bull call spread (Trading Idea #2) gives you a risk-defined way to follow the institutional money without betting the farm.
If you're watching from the sidelines: The $3.1M whale trade is a strong signal, but CF is already up 38% and trading above every analyst's target except Barclays. Wait for a pullback to the $105-$106 support zone before entering. That's where the recent consolidation held and where insider sales occurred -- a natural re-entry point.
If you're bearish: Respect the trend, but watch for any Hormuz de-escalation headlines. A diplomatic resolution would remove the geopolitical premium fast. Selling call spreads above $130 lets you bet against the whale's thesis with defined risk.
The bottom line: when someone deploys $3.1M into a single LEAP call position on a stock already at 52-week highs, they're seeing something the broader market hasn't priced in yet. Whether that's a prolonged Hormuz crisis, a coming wave of analyst upgrades, or Q1 earnings that rewrite the valuation model -- this is a trade worth watching closely. 👀
⚠️ Disclaimer: This analysis is for informational purposes only and does not constitute financial advice. Options trading involves significant risk and is not suitable for all investors. You can lose your entire investment. Always do your own research and consider your risk tolerance before trading. Past performance does not guarantee future results.